| Param | Original file | Final file |
|---|---|---|
| Filename | modeM0/AS1C05_004T01_9000003404_23033cztM0_level2.evt | modeM0/AS1C05_004T01_9000003404_23033cztM0_level2_quad_clean.evt |
| Size (bytes) | 882,440,640 | 186,635,520 |
| Size | 841.6 MB | 178.0 MB |
| Events in quadrant A | 5,385,235 | 1,239,122 |
| Events in quadrant B | 5,871,535 | 1,255,508 |
| Events in quadrant C | 5,465,591 | 1,205,495 |
| Events in quadrant D | 9,211,405 | 1,144,027 |
| Mode M0 | |||
|---|---|---|---|
| Quadrant | BADHDUFLAG | Total packets | Discarded packets |
| A | 0 | 23912 | 2 |
| B | 0 | 25221 | 2 |
| C | 0 | 24115 | 2 |
| D | 0 | 35663 | 2 |
| Mode SS | |||
|---|---|---|---|
| Quadrant | BADHDUFLAG | Total packets | Discarded packets |
| A | 0 | 236 | 0 |
| B | 0 | 236 | 0 |
| C | 0 | 236 | 0 |
| D | 0 | 236 | 0 |
| Mode M9 | |||
|---|---|---|---|
| Quadrant | BADHDUFLAG | Total packets | Discarded packets |
| A | 0 | 10 | 0 |
| B | 0 | 10 | 0 |
| C | 0 | 10 | 0 |
| D | 0 | 10 | 0 |
| Quadrant | Total seconds | Saturated seconds | Saturation percentage |
|---|---|---|---|
| A | 11694 | 200 | 1.710279% |
| B | 11695 | 299 | 2.556648% |
| C | 11695 | 219 | 1.872595% |
| D | 11695 | 727 | 6.216332% |
Noise dominated data is calculated using 1-second bins in cleaned event files. If a bin has >2000 counts, and if more than 50% of those come from <1% of pixels, then it is considered to be noise-dominated and hence unusable.
| Quadrant | # 1 sec bins | Bins with >0 counts | Bins with >2000 counts | High rate bins dominated by noise | Noise dominated (total time) | Noise dominated (detector-on time) | Marked lightcurve |
|---|---|---|---|---|---|---|---|
| A | 12599 | 11698 | 0 | 0 | 0.00% | 0.00% | 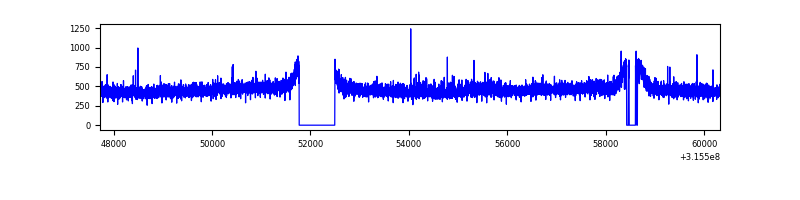 |
| B | 12600 | 11699 | 56 | 56 | 0.44% | 0.48% | 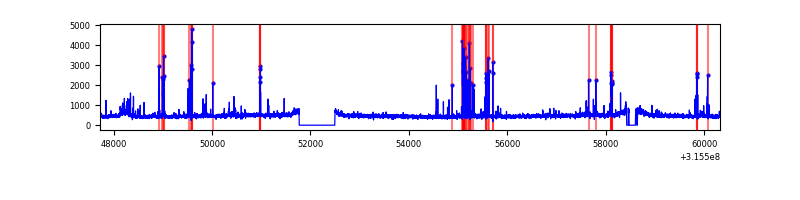 |
| C | 12600 | 11699 | 4 | 4 | 0.03% | 0.03% | 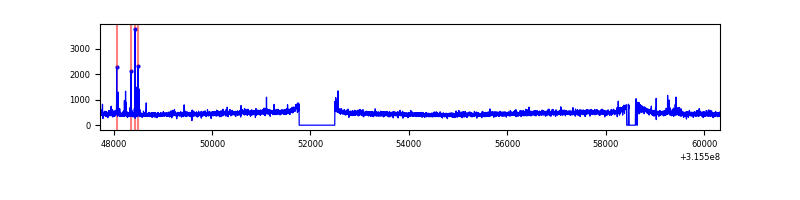 |
| D | 12600 | 11698 | 484 | 484 | 3.84% | 4.14% | 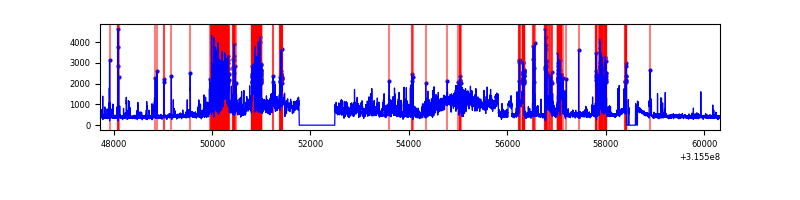 |
Top three noisy pixels from each quadrant. If the there are fewer than three noisy pixels in the level2.evt file, extra rows are filled as -1
| Pixel properties | Quadrant properties | ||||||
|---|---|---|---|---|---|---|---|
| Quadrant | DetID | PixID | Counts | Sigma | Mean | Median | Sigma |
| A | 6 | 16 | 45731 | 159.29 | 1383 | 1351 | 278.6 |
| A | 13 | 254 | 15844 | 52.02 | 1383 | 1351 | 278.6 |
| A | 3 | 137 | 12586 | 40.32 | 1383 | 1351 | 278.6 |
| B | 3 | 64 | 218271 | 839.13 | 1370 | 1334 | 258.5 |
| B | 4 | 216 | 168029 | 644.79 | 1370 | 1334 | 258.5 |
| B | 0 | 189 | 76370 | 290.25 | 1370 | 1334 | 258.5 |
| C | 14 | 238 | 210418 | 683.37 | 1324 | 1333 | 306.0 |
| C | 0 | 207 | 38467 | 121.37 | 1324 | 1333 | 306.0 |
| C | 7 | 247 | 31839 | 99.7 | 1324 | 1333 | 306.0 |
| D | 1 | 52 | 2150287 | 6694.93 | 1321 | 1279 | 321.0 |
| D | 5 | 222 | 785645 | 2443.58 | 1321 | 1279 | 321.0 |
| D | 9 | 85 | 548401 | 1704.48 | 1321 | 1279 | 321.0 |
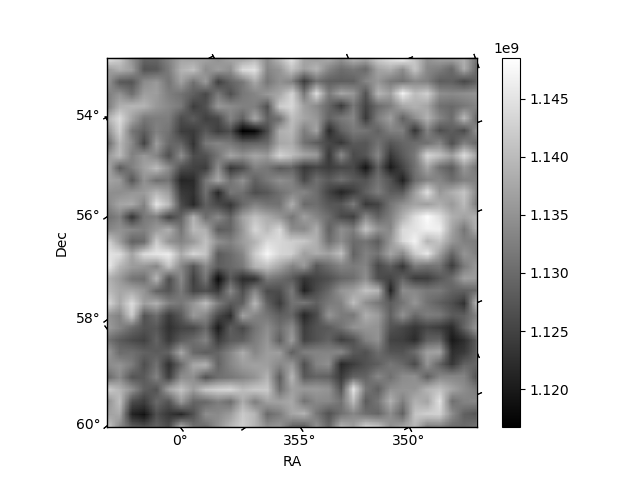
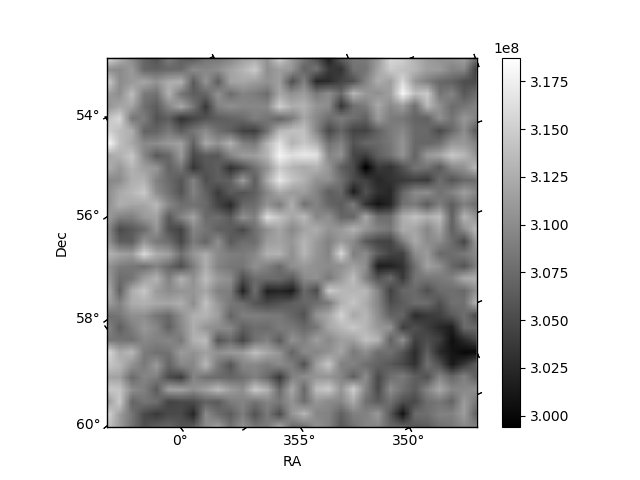
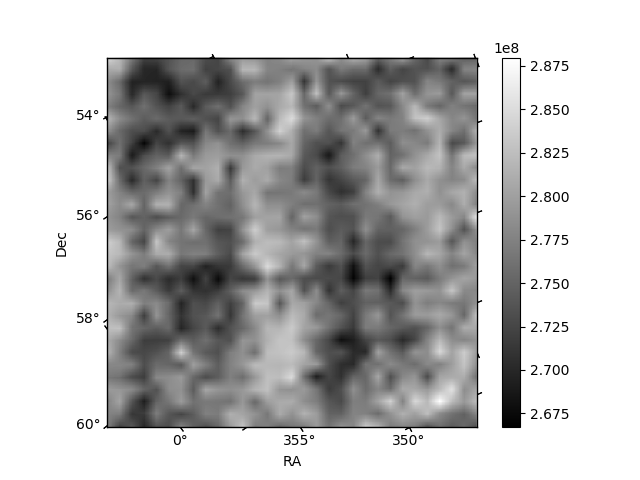
Histogram calculated using DETX and DETY for each event in the final _common_clean file
| Quadrant A | 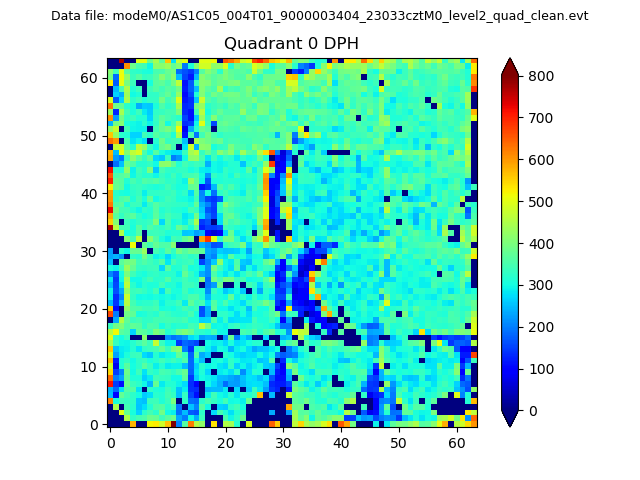 |
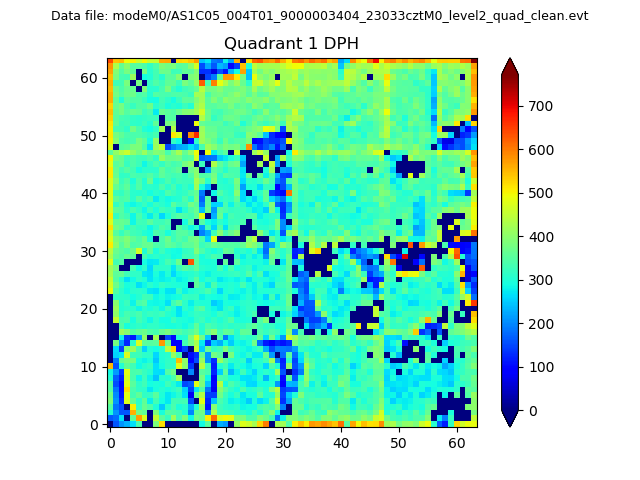 |
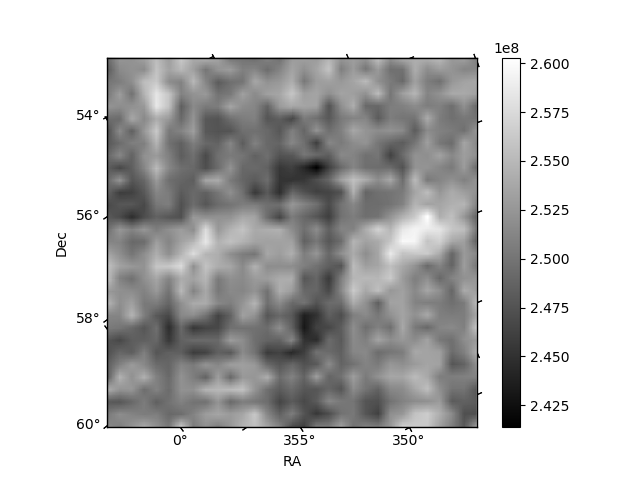
Quadrant B |
|---|---|---|---|
| Quadrant D | 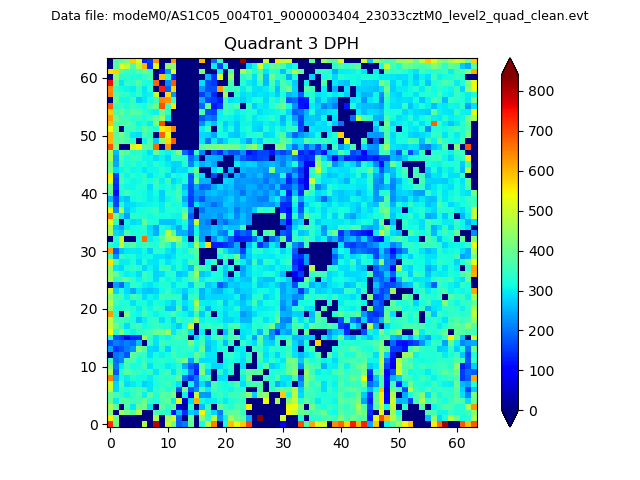 |
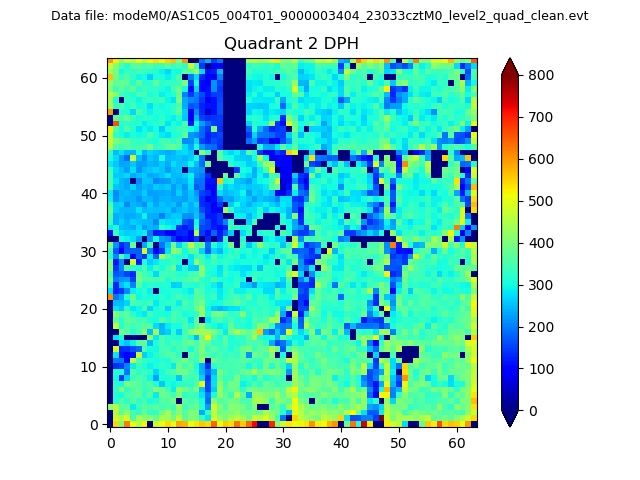 |
Quadrant C |
| Plot type | Count rate plots | Images |
|---|---|---|
| Comparison with Poisson distribution Blue bars denote a histogram of data divided into 1 sec bins. Red curve is a Poisson curve with rate = median count rate of data. |
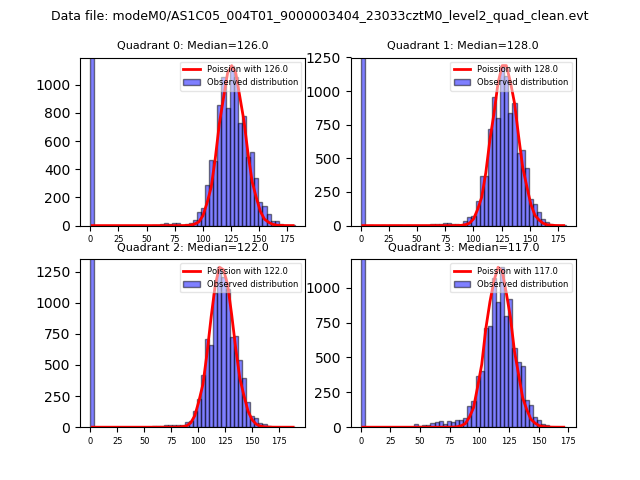 |
 |
| Quadrant-wise count rates Data is divided into 100 sec bins |
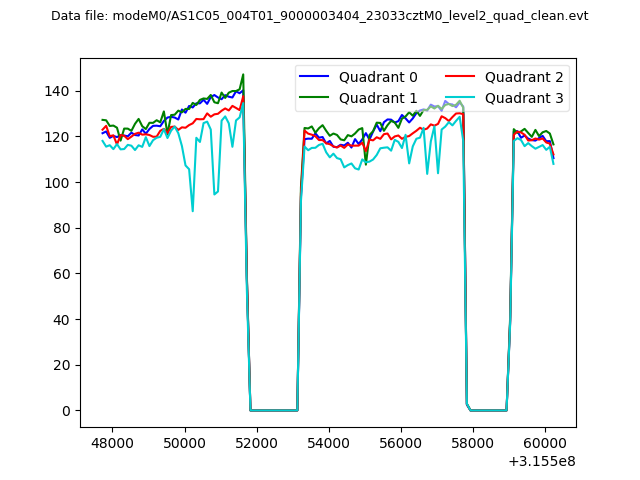 |
|
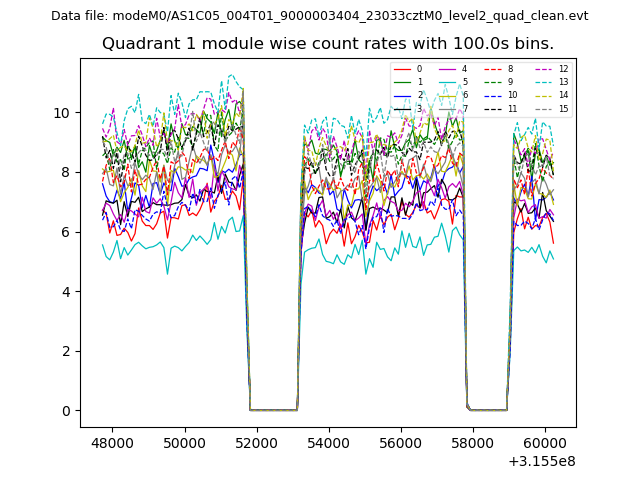
| Module-wise count rates for Quadrant A Data is divided into 100 sec bins |
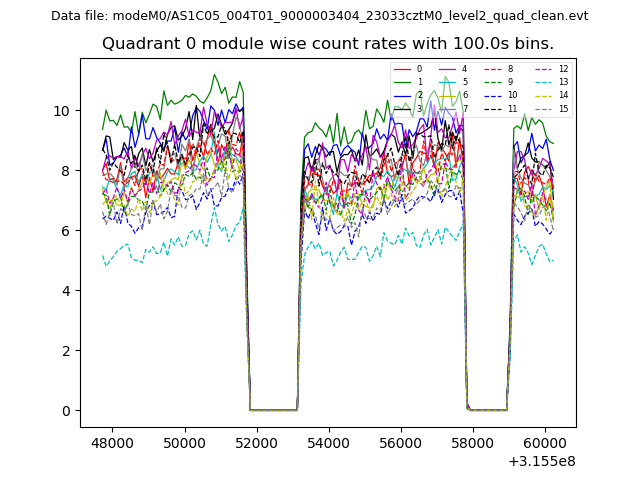 |
 |
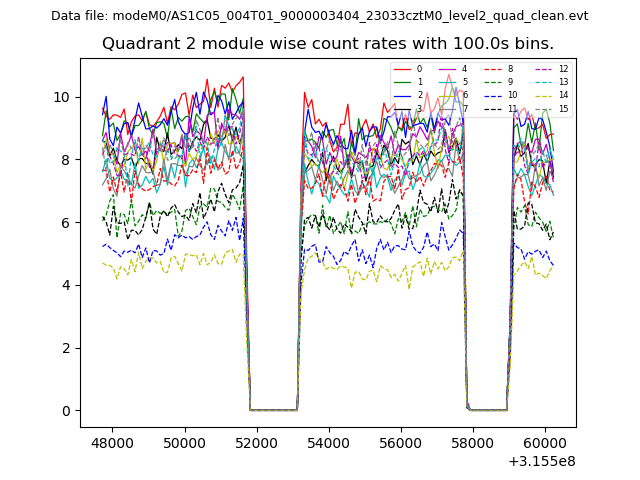
| Module-wise count rates for Quadrant B Data is divided into 100 sec bins |
 |
 |
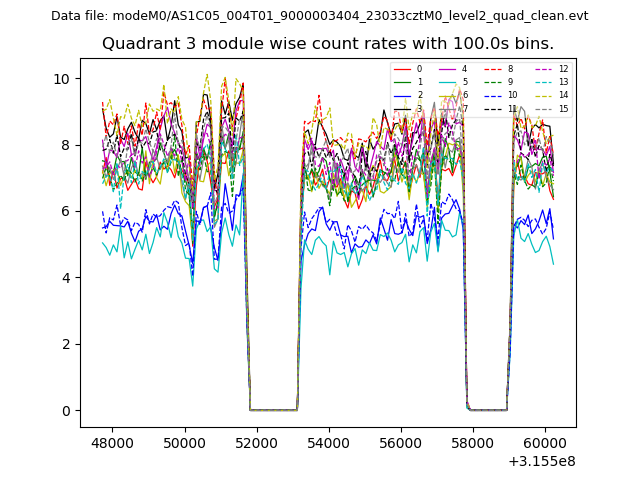
| Module-wise count rates for Quadrant C Data is divided into 100 sec bins |
 |
 |
| Module-wise count rates for Quadrant D Data is divided into 100 sec bins |
 |
 |
| Parameter | Plot |
|---|---|
| CZT HV Monitor | 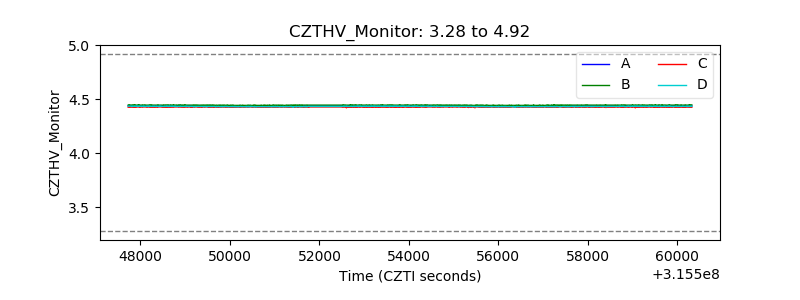 |
| D_VDD | 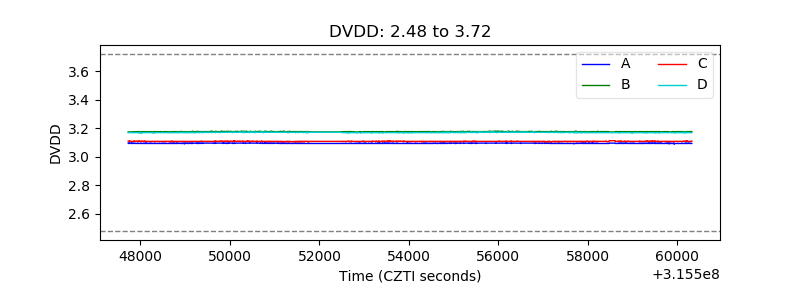 |
| Temperature 1 | 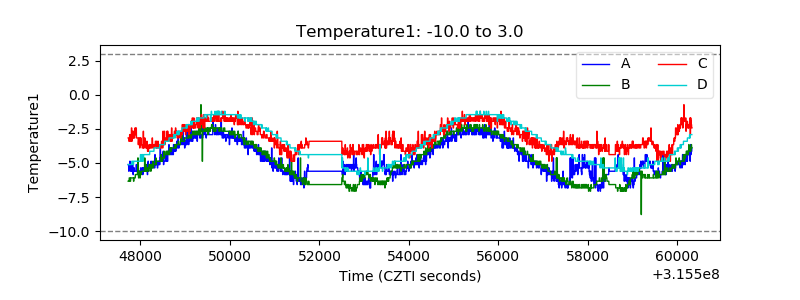 |
| Veto HV Monitor |  |
| Veto LLD | 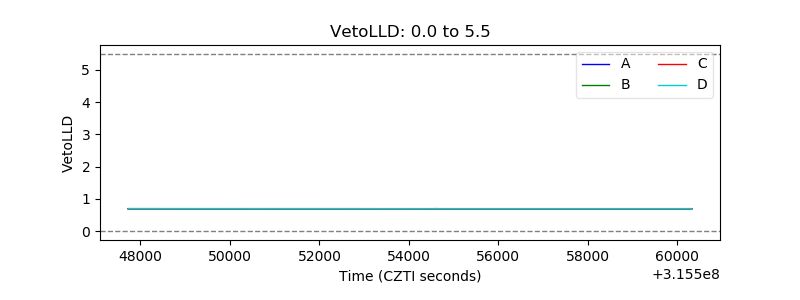 |
| Alpha Counter | 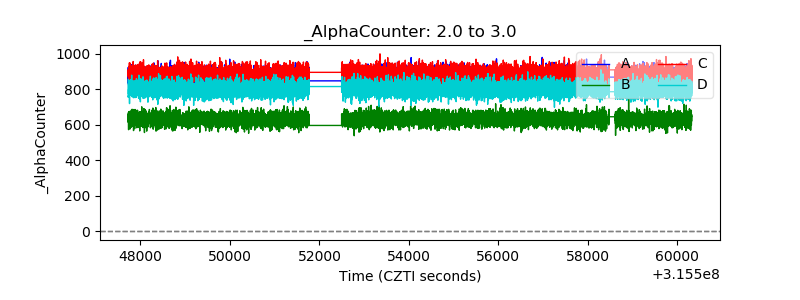 |
| _CPM_Rate |  |
| CZT Counter | 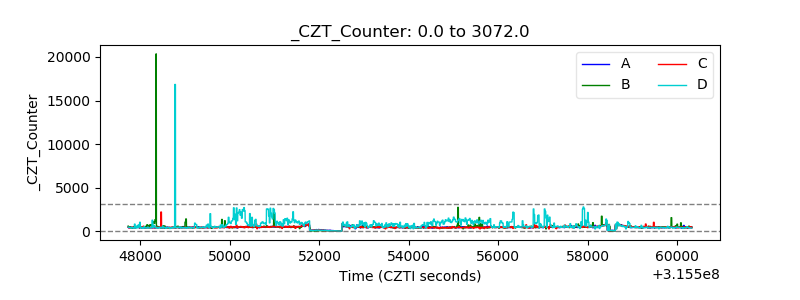 |
| +2.5 Volts monitor |  |
| +5 Volts monitor |  |
| _ROLL_ROT | 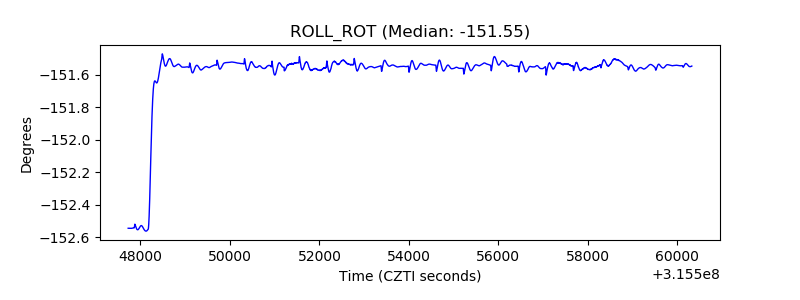 |
| _Roll_DEC |  |
| _Roll_RA | 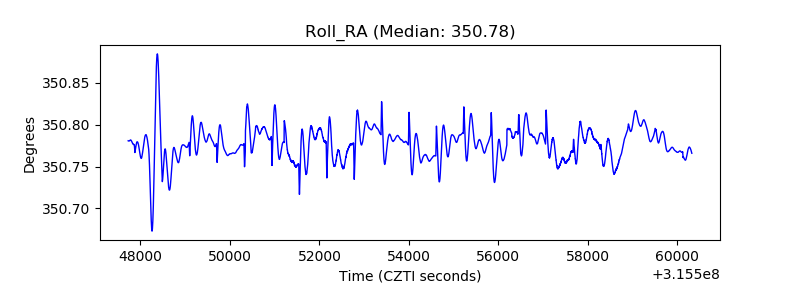 |
| Veto Counter | 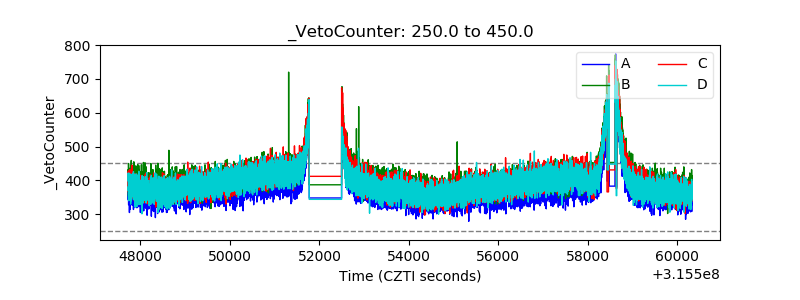 |