| Param | Original file | Final file |
|---|---|---|
| Filename | modeM0/AS1C05_004T01_9000003404_23035cztM0_level2.evt | modeM0/AS1C05_004T01_9000003404_23035cztM0_level2_quad_clean.evt |
| Size (bytes) | 483,471,360 | 111,467,520 |
| Size | 461.1 MB | 106.3 MB |
| Events in quadrant A | 3,285,190 | 729,313 |
| Events in quadrant B | 3,559,816 | 743,078 |
| Events in quadrant C | 3,380,983 | 709,165 |
| Events in quadrant D | 3,922,991 | 689,480 |
| Mode M0 | |||
|---|---|---|---|
| Quadrant | BADHDUFLAG | Total packets | Discarded packets |
| A | 0 | 14733 | 1 |
| B | 0 | 15413 | 1 |
| C | 0 | 14927 | 1 |
| D | 0 | 16682 | 1 |
| Mode SS | |||
|---|---|---|---|
| Quadrant | BADHDUFLAG | Total packets | Discarded packets |
| A | 0 | 146 | 0 |
| B | 0 | 146 | 0 |
| C | 0 | 146 | 0 |
| D | 0 | 146 | 0 |
| Mode M9 | |||
|---|---|---|---|
| Quadrant | BADHDUFLAG | Total packets | Discarded packets |
| A | 0 | 4 | 0 |
| B | 0 | 4 | 0 |
| C | 0 | 4 | 0 |
| D | 0 | 4 | 0 |
| Quadrant | Total seconds | Saturated seconds | Saturation percentage |
|---|---|---|---|
| A | 7254 | 62 | 0.854701% |
| B | 7255 | 128 | 1.764300% |
| C | 7255 | 118 | 1.626465% |
| D | 7255 | 165 | 2.274294% |
Noise dominated data is calculated using 1-second bins in cleaned event files. If a bin has >2000 counts, and if more than 50% of those come from <1% of pixels, then it is considered to be noise-dominated and hence unusable.
| Quadrant | # 1 sec bins | Bins with >0 counts | Bins with >2000 counts | High rate bins dominated by noise | Noise dominated (total time) | Noise dominated (detector-on time) | Marked lightcurve |
|---|---|---|---|---|---|---|---|
| A | 7614 | 7255 | 0 | 0 | 0.00% | 0.00% | 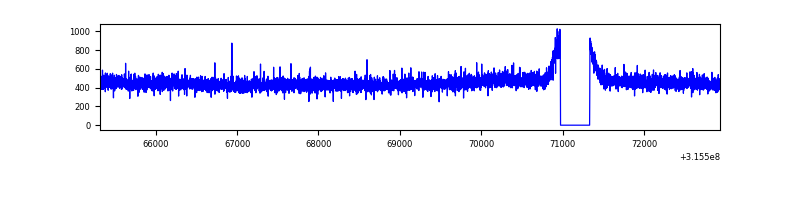 |
| B | 7615 | 7256 | 31 | 31 | 0.41% | 0.43% | 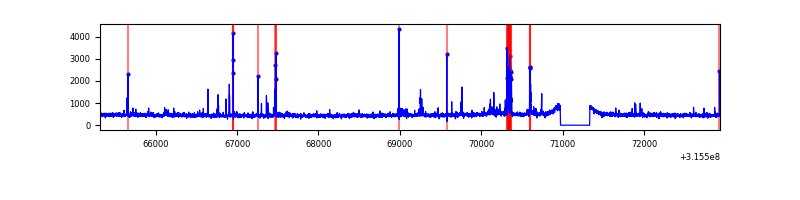 |
| C | 7615 | 7256 | 10 | 10 | 0.13% | 0.14% | 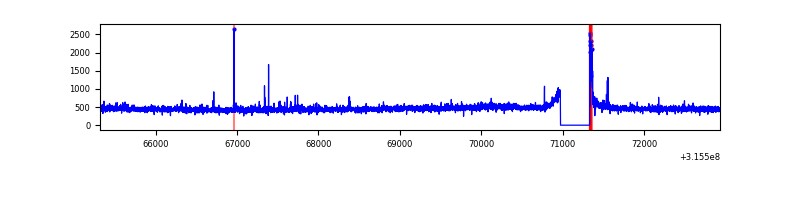 |
| D | 7615 | 7256 | 83 | 83 | 1.09% | 1.14% | 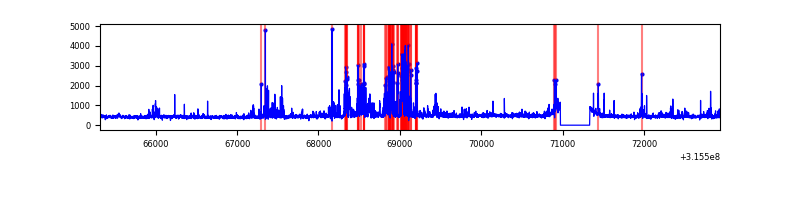 |
Top three noisy pixels from each quadrant. If the there are fewer than three noisy pixels in the level2.evt file, extra rows are filled as -1
| Pixel properties | Quadrant properties | ||||||
|---|---|---|---|---|---|---|---|
| Quadrant | DetID | PixID | Counts | Sigma | Mean | Median | Sigma |
| A | 13 | 254 | 11145 | 59.9 | 850 | 831 | 172.2 |
| A | 3 | 137 | 7626 | 39.46 | 850 | 831 | 172.2 |
| A | 0 | 226 | 7277 | 37.43 | 850 | 831 | 172.2 |
| B | 3 | 64 | 150196 | 922.0 | 841 | 818 | 162.0 |
| B | 0 | 189 | 66847 | 407.55 | 841 | 818 | 162.0 |
| B | 4 | 216 | 21435 | 127.25 | 841 | 818 | 162.0 |
| C | 14 | 238 | 128471 | 676.82 | 810 | 814 | 188.6 |
| C | 0 | 10 | 55444 | 289.64 | 810 | 814 | 188.6 |
| C | 0 | 207 | 35317 | 182.93 | 810 | 814 | 188.6 |
| D | 2 | 136 | 344474 | 1734.82 | 820 | 795 | 198.1 |
| D | 13 | 153 | 125804 | 631.02 | 820 | 795 | 198.1 |
| D | 1 | 52 | 113986 | 571.36 | 820 | 795 | 198.1 |
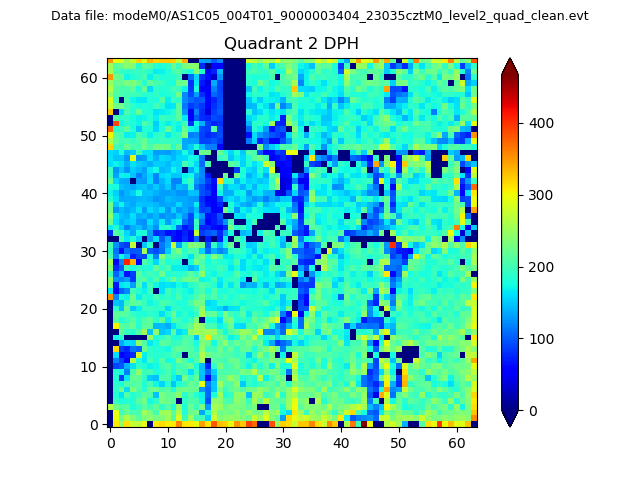
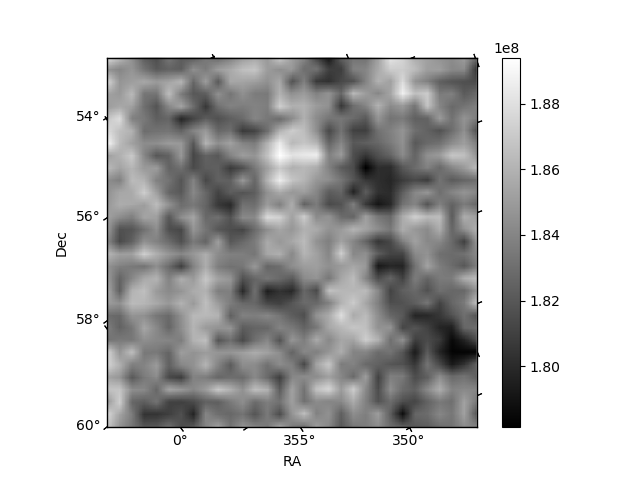
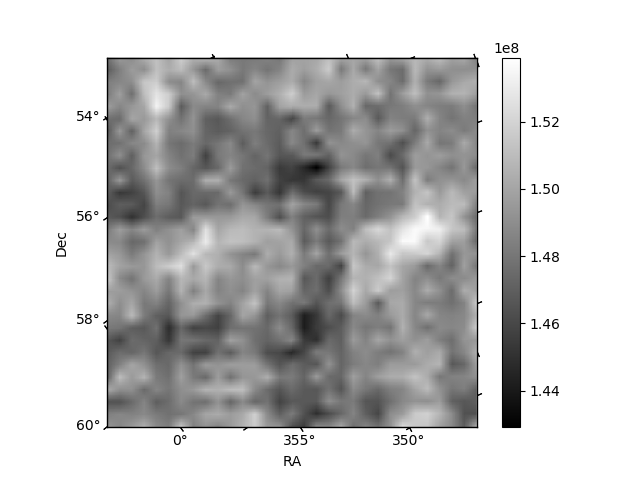
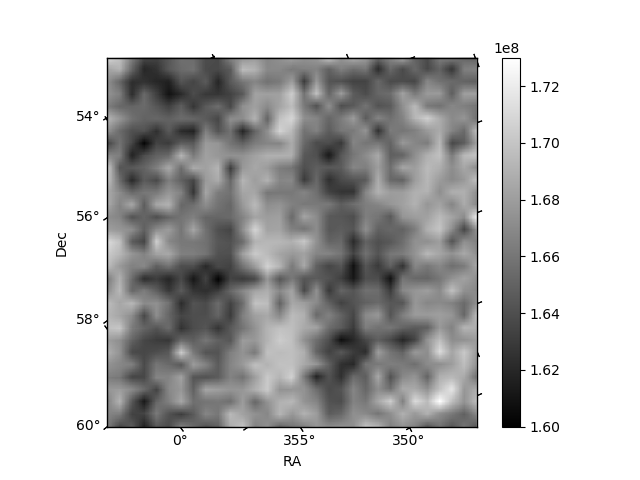
Histogram calculated using DETX and DETY for each event in the final _common_clean file
| Quadrant A | 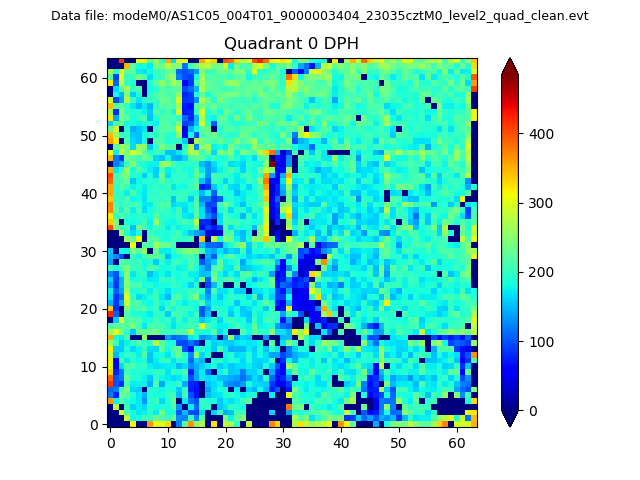 |
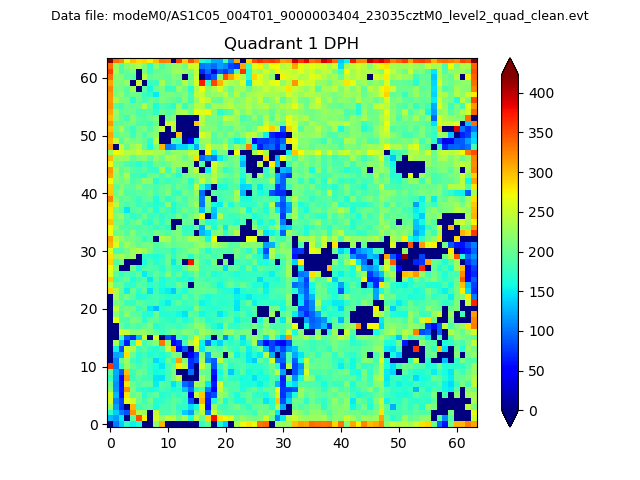 |
Quadrant B |
|---|---|---|---|
| Quadrant D | 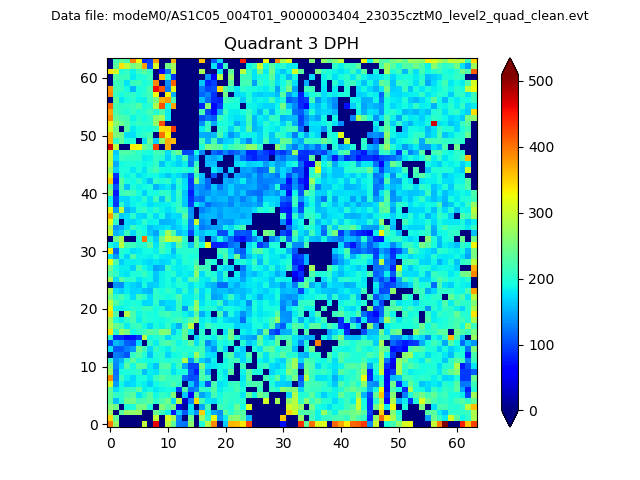 |
 |
Quadrant C |
| Plot type | Count rate plots | Images |
|---|---|---|
| Comparison with Poisson distribution Blue bars denote a histogram of data divided into 1 sec bins. Red curve is a Poisson curve with rate = median count rate of data. |
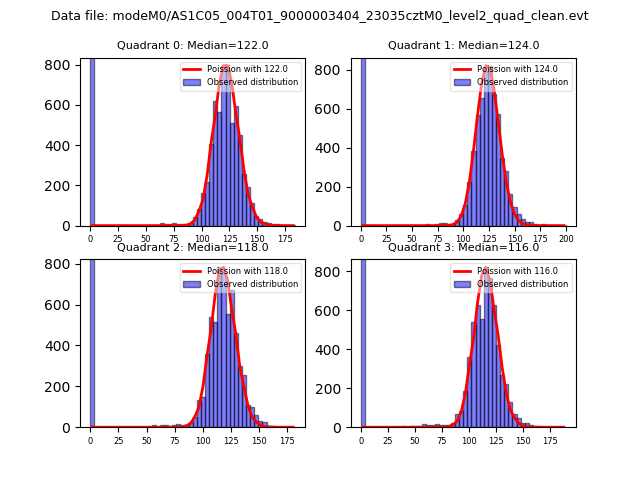 |
 |
| Quadrant-wise count rates Data is divided into 100 sec bins |
 |
|
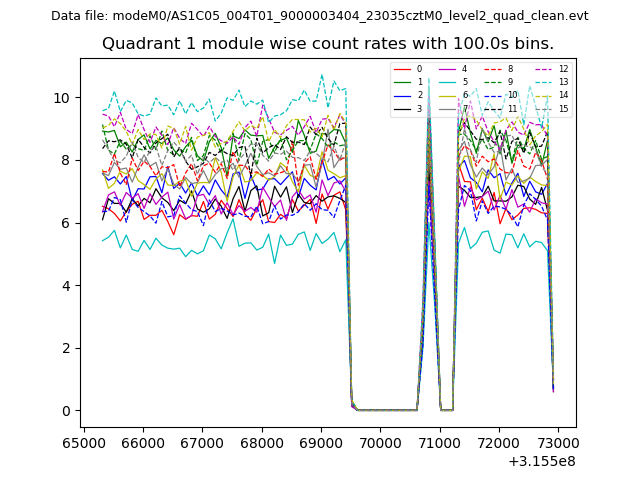
| Module-wise count rates for Quadrant A Data is divided into 100 sec bins |
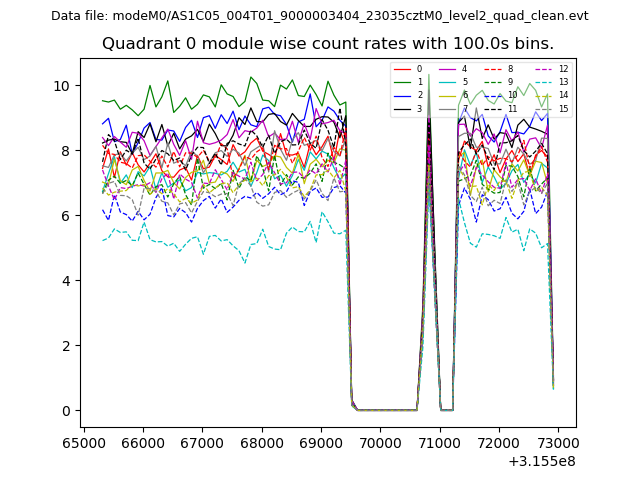 |
 |
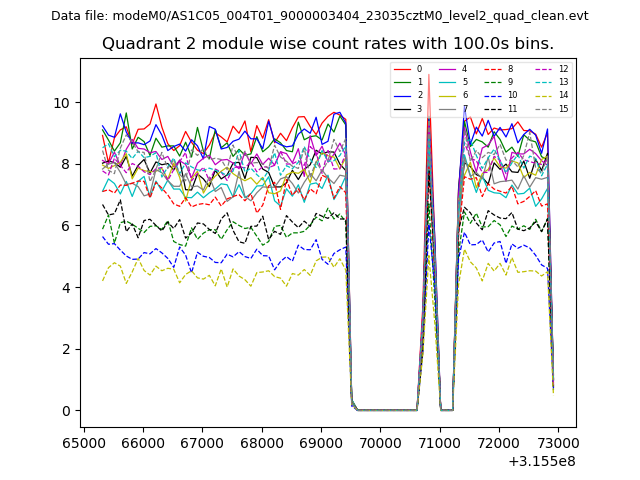
| Module-wise count rates for Quadrant B Data is divided into 100 sec bins |
 |
 |
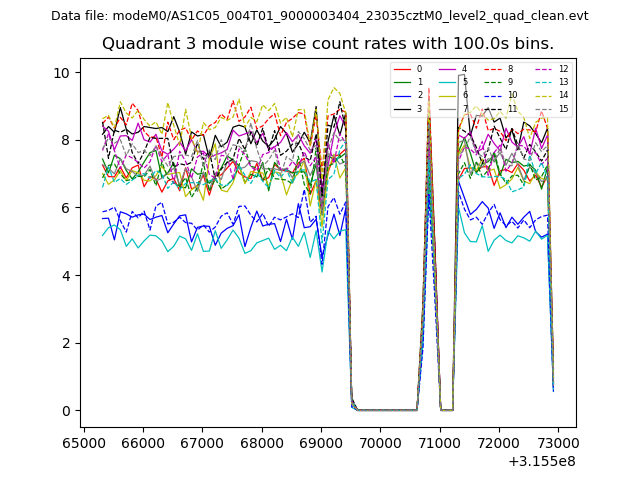
| Module-wise count rates for Quadrant C Data is divided into 100 sec bins |
 |
 |
| Module-wise count rates for Quadrant D Data is divided into 100 sec bins |
 |
 |
| Parameter | Plot |
|---|---|
| CZT HV Monitor | 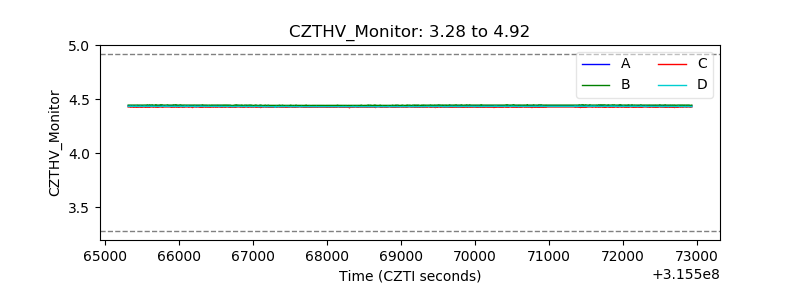 |
| D_VDD | 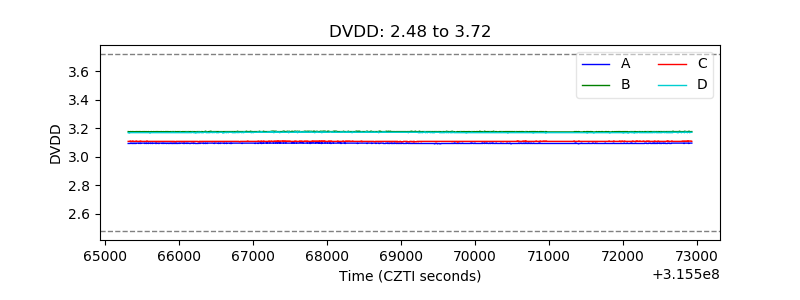 |
| Temperature 1 |  |
| Veto HV Monitor | 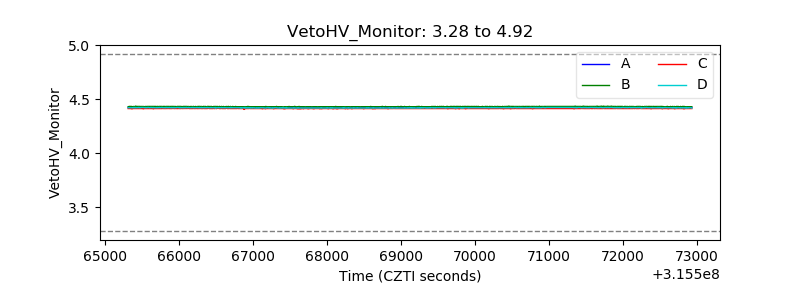 |
| Veto LLD | 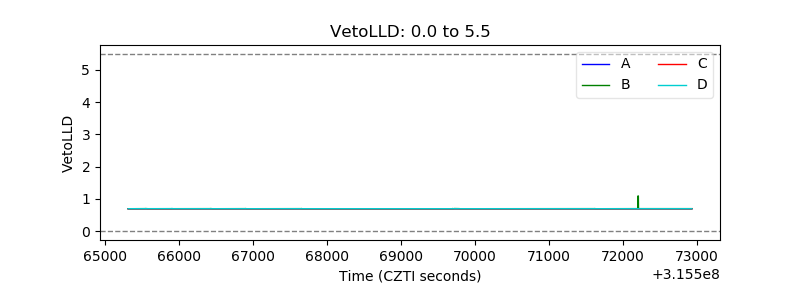 |
| Alpha Counter | 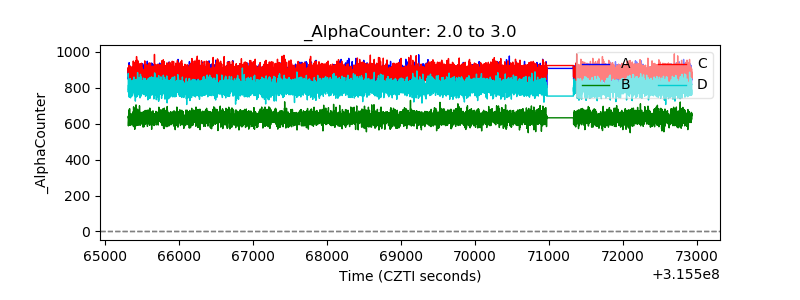 |
| _CPM_Rate | 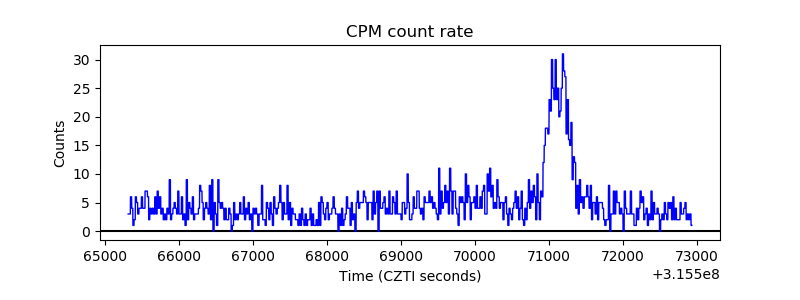 |
| CZT Counter | 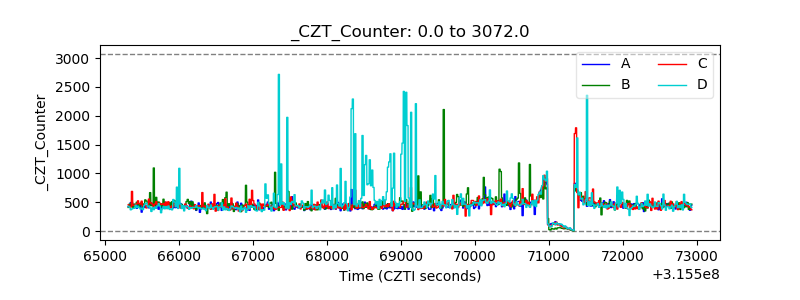 |
| +2.5 Volts monitor |  |
| +5 Volts monitor | 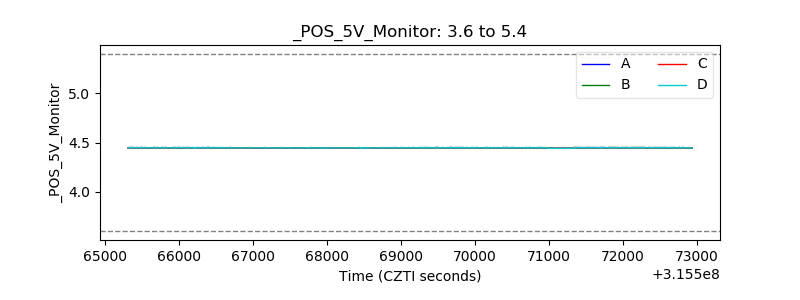 |
| _ROLL_ROT | 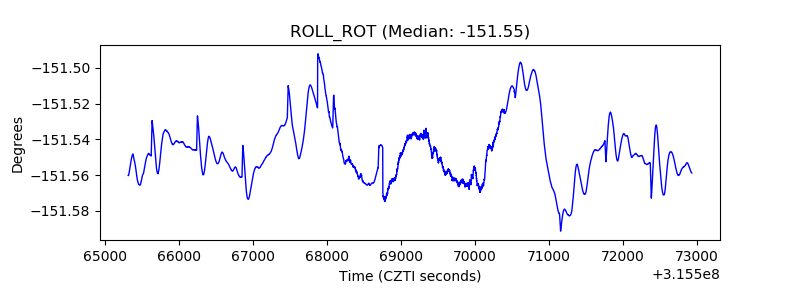 |
| _Roll_DEC |  |
| _Roll_RA | 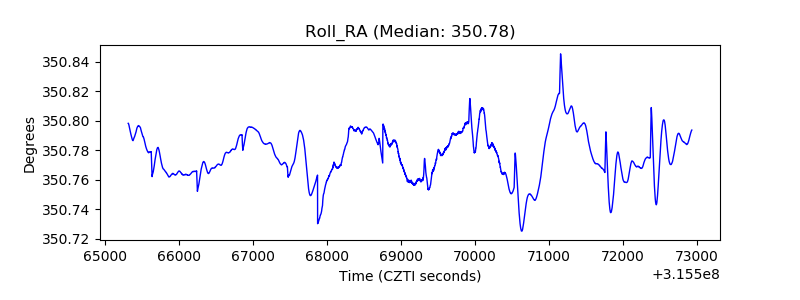 |
| Veto Counter | 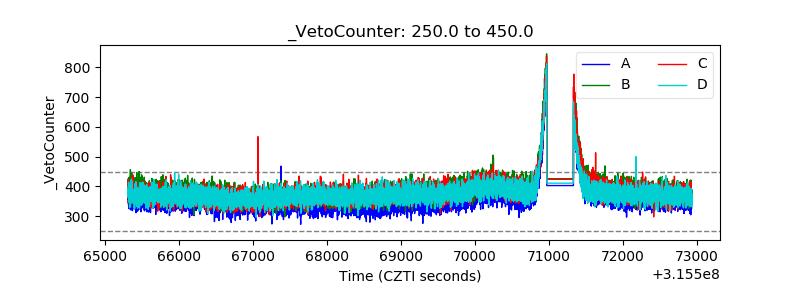 |