| Param | Original file | Final file |
|---|---|---|
| Filename | modeM0/AS1C05_004T01_9000003404_23037cztM0_level2.evt | modeM0/AS1C05_004T01_9000003404_23037cztM0_level2_quad_clean.evt |
| Size (bytes) | 834,621,120 | 181,736,640 |
| Size | 796.0 MB | 173.3 MB |
| Events in quadrant A | 5,521,460 | 1,195,532 |
| Events in quadrant B | 5,872,177 | 1,205,280 |
| Events in quadrant C | 6,047,898 | 1,136,895 |
| Events in quadrant D | 7,010,514 | 1,124,890 |
| Mode M0 | |||
|---|---|---|---|
| Quadrant | BADHDUFLAG | Total packets | Discarded packets |
| A | 0 | 24706 | 2 |
| B | 0 | 25540 | 3 |
| C | 0 | 26077 | 2 |
| D | 0 | 29017 | 2 |
| Mode SS | |||
|---|---|---|---|
| Quadrant | BADHDUFLAG | Total packets | Discarded packets |
| A | 0 | 250 | 0 |
| B | 0 | 250 | 0 |
| C | 0 | 250 | 0 |
| D | 0 | 250 | 0 |
| Mode M9 | |||
|---|---|---|---|
| Quadrant | BADHDUFLAG | Total packets | Discarded packets |
| A | 0 | 12 | 0 |
| B | 0 | 12 | 0 |
| C | 0 | 12 | 0 |
| D | 0 | 12 | 0 |
| Quadrant | Total seconds | Saturated seconds | Saturation percentage |
|---|---|---|---|
| A | 12165 | 105 | 0.863132% |
| B | 12165 | 160 | 1.315249% |
| C | 12165 | 281 | 2.309905% |
| D | 12165 | 252 | 2.071517% |
Noise dominated data is calculated using 1-second bins in cleaned event files. If a bin has >2000 counts, and if more than 50% of those come from <1% of pixels, then it is considered to be noise-dominated and hence unusable.
| Quadrant | # 1 sec bins | Bins with >0 counts | Bins with >2000 counts | High rate bins dominated by noise | Noise dominated (total time) | Noise dominated (detector-on time) | Marked lightcurve |
|---|---|---|---|---|---|---|---|
| A | 13445 | 12167 | 0 | 0 | 0.00% | 0.00% | 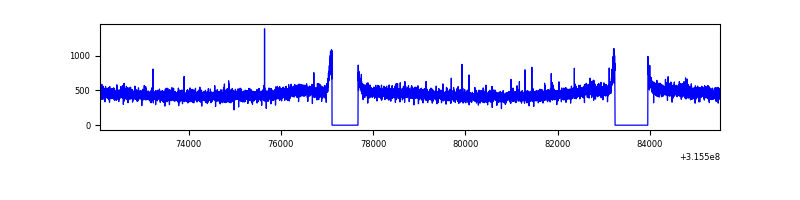 |
| B | 13445 | 12167 | 34 | 34 | 0.25% | 0.28% | 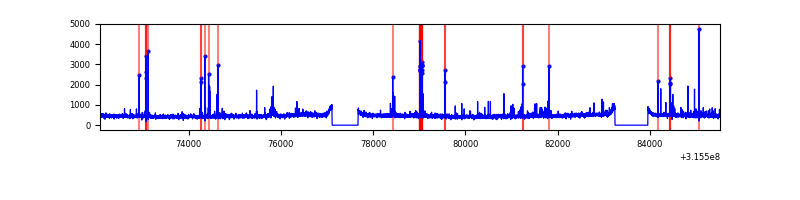 |
| C | 13445 | 12167 | 111 | 111 | 0.83% | 0.91% | 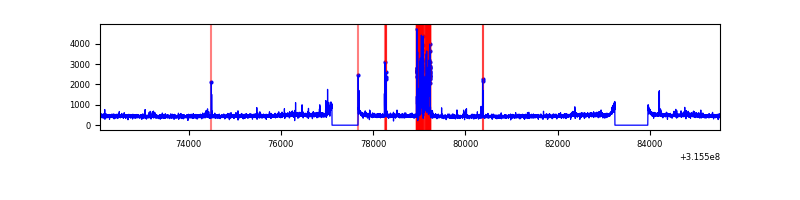 |
| D | 13445 | 12167 | 134 | 134 | 1.00% | 1.10% | 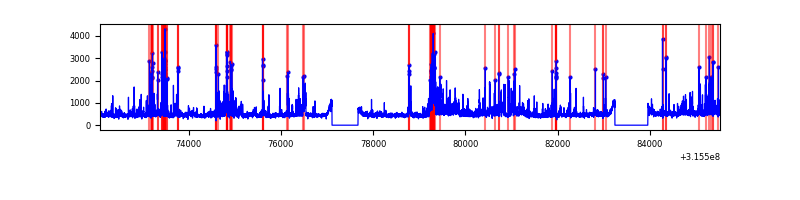 |
Top three noisy pixels from each quadrant. If the there are fewer than three noisy pixels in the level2.evt file, extra rows are filled as -1
| Pixel properties | Quadrant properties | ||||||
|---|---|---|---|---|---|---|---|
| Quadrant | DetID | PixID | Counts | Sigma | Mean | Median | Sigma |
| A | 13 | 254 | 17834 | 57.3 | 1429 | 1399 | 286.8 |
| A | 3 | 137 | 12780 | 39.68 | 1429 | 1399 | 286.8 |
| A | 0 | 226 | 12107 | 37.33 | 1429 | 1399 | 286.8 |
| B | 4 | 216 | 120155 | 439.26 | 1414 | 1377 | 270.4 |
| B | 3 | 64 | 112537 | 411.08 | 1414 | 1377 | 270.4 |
| B | 0 | 189 | 49037 | 176.25 | 1414 | 1377 | 270.4 |
| C | 10 | 9 | 408721 | 1285.94 | 1361 | 1367 | 316.8 |
| C | 14 | 238 | 214241 | 672.01 | 1361 | 1367 | 316.8 |
| C | 0 | 207 | 64589 | 199.58 | 1361 | 1367 | 316.8 |
| D | 13 | 172 | 633983 | 1881.35 | 1387 | 1343 | 336.3 |
| D | 1 | 52 | 476927 | 1414.3 | 1387 | 1343 | 336.3 |
| D | 9 | 85 | 202957 | 599.56 | 1387 | 1343 | 336.3 |
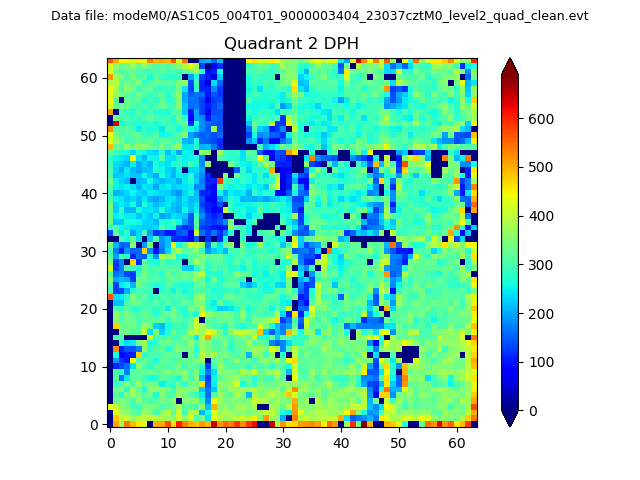
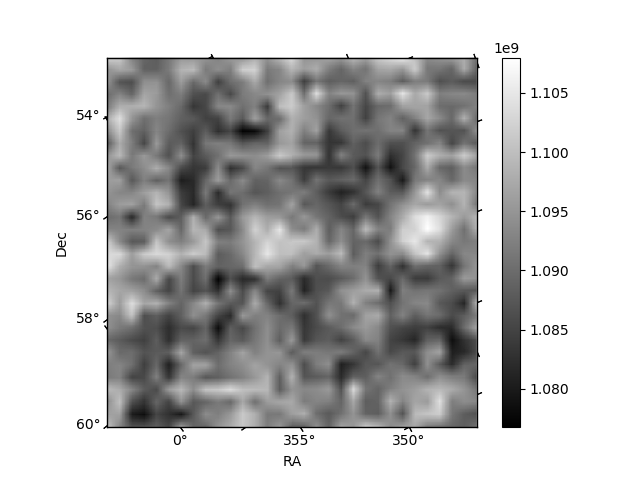
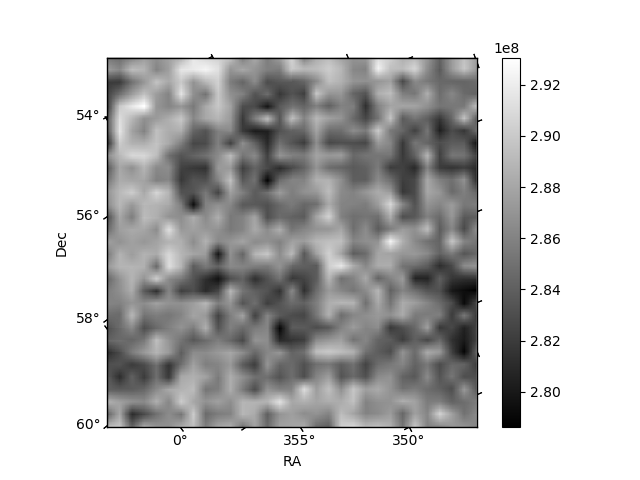
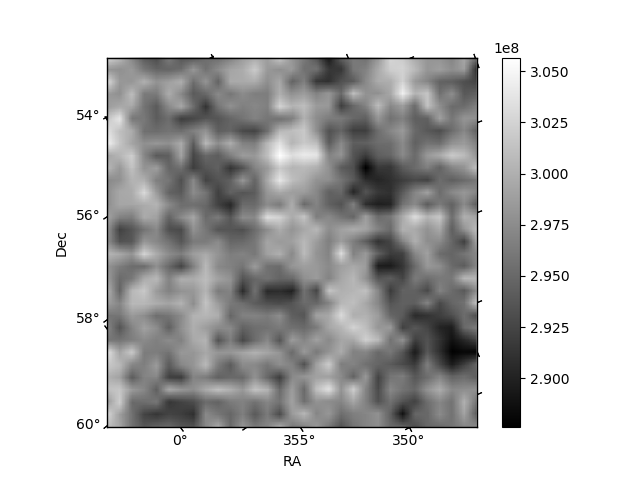
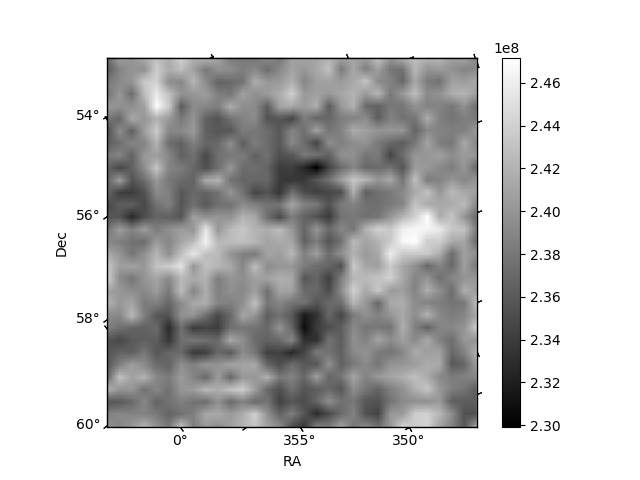
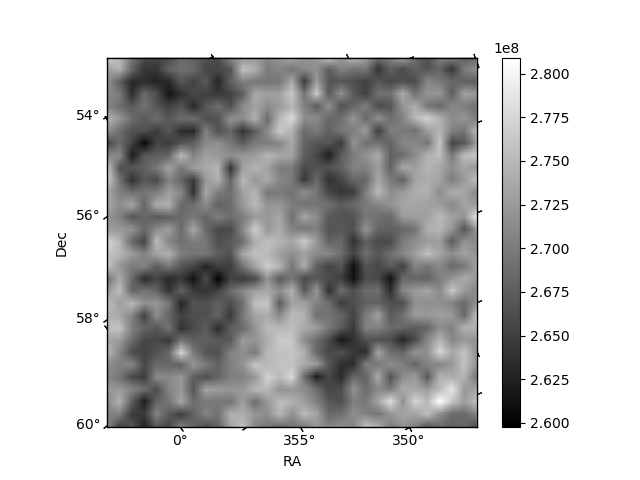
Histogram calculated using DETX and DETY for each event in the final _common_clean file
| Quadrant A | 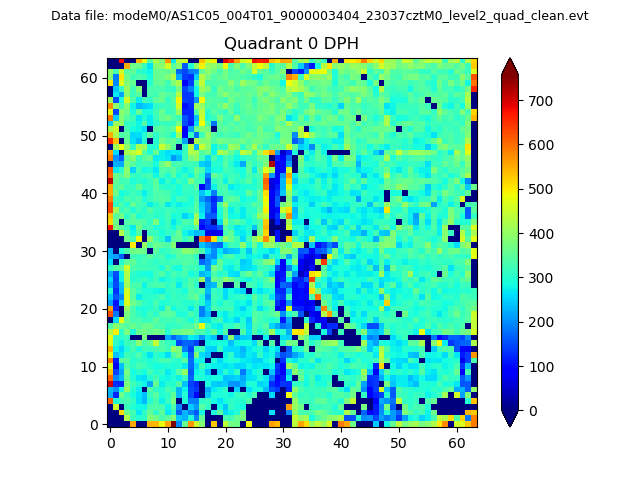 |
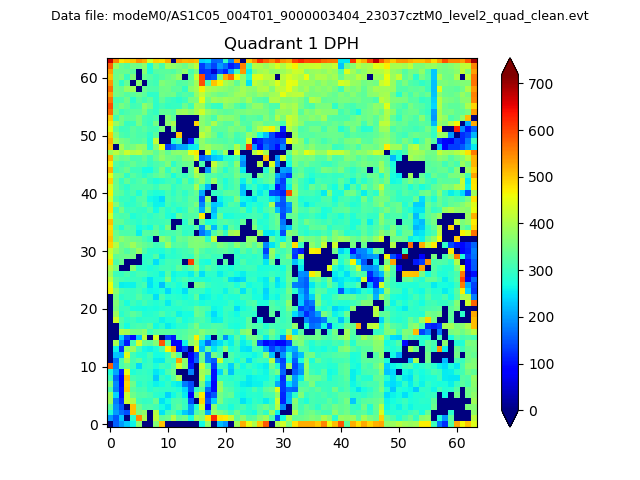 |
Quadrant B |
|---|---|---|---|
| Quadrant D | 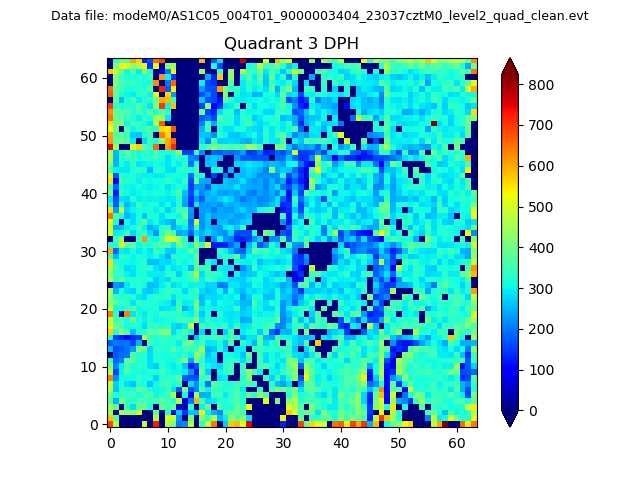 |
 |
Quadrant C |
| Plot type | Count rate plots | Images |
|---|---|---|
| Comparison with Poisson distribution Blue bars denote a histogram of data divided into 1 sec bins. Red curve is a Poisson curve with rate = median count rate of data. |
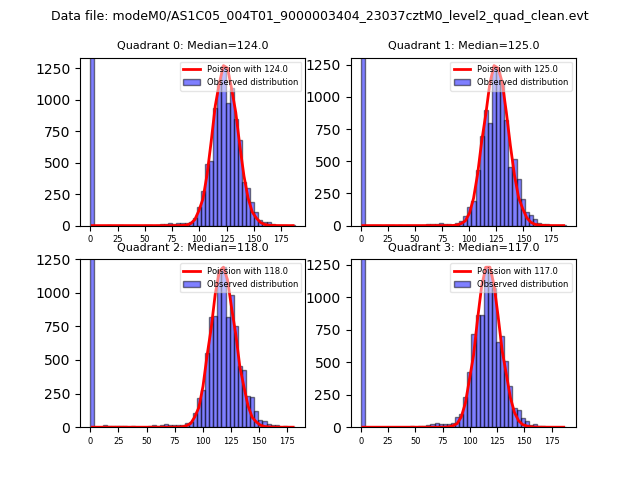 |
 |
| Quadrant-wise count rates Data is divided into 100 sec bins |
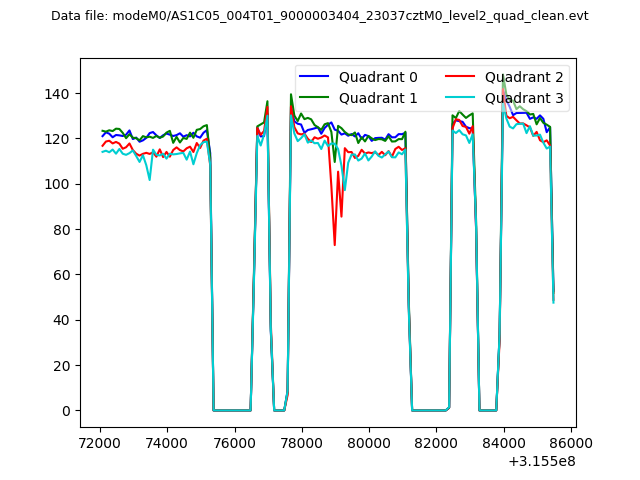 |
|
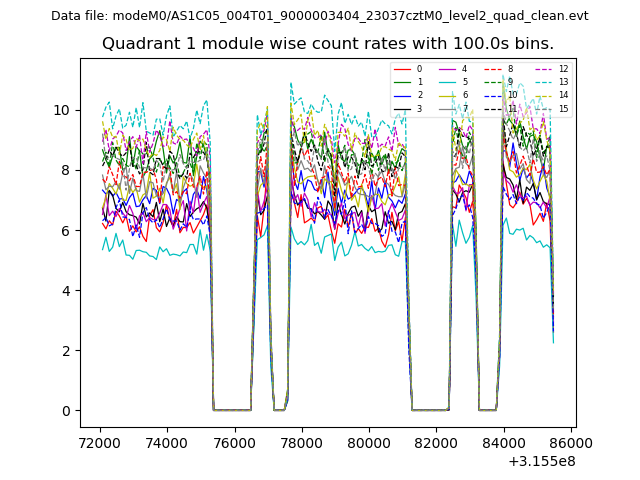
| Module-wise count rates for Quadrant A Data is divided into 100 sec bins |
 |
 |
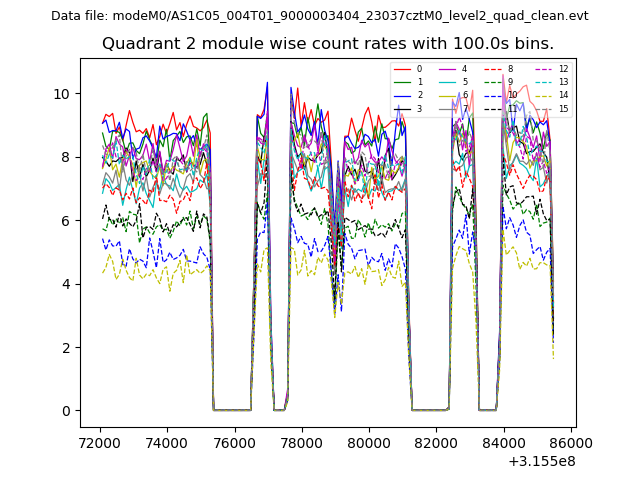
| Module-wise count rates for Quadrant B Data is divided into 100 sec bins |
 |
 |
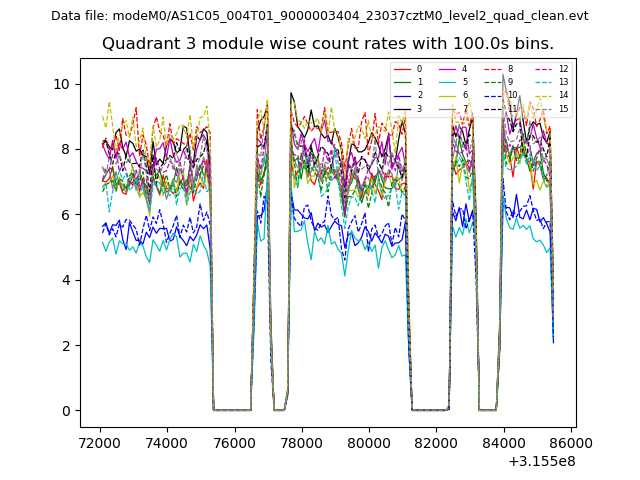
| Module-wise count rates for Quadrant C Data is divided into 100 sec bins |
 |
 |
| Module-wise count rates for Quadrant D Data is divided into 100 sec bins |
 |
 |
| Parameter | Plot |
|---|---|
| CZT HV Monitor | 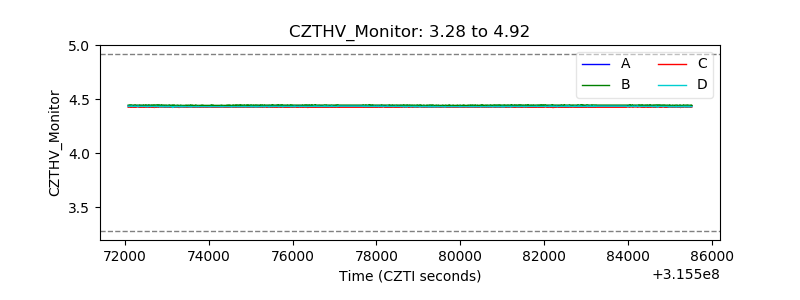 |
| D_VDD | 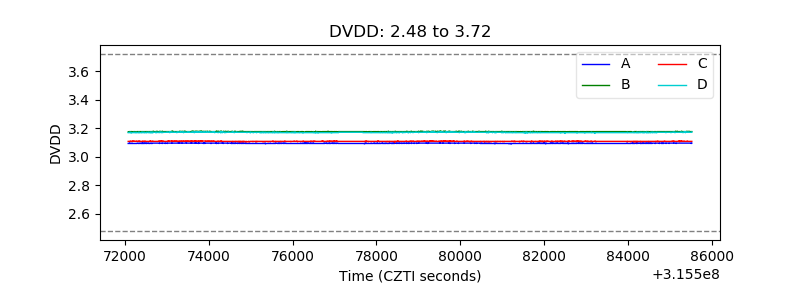 |
| Temperature 1 | 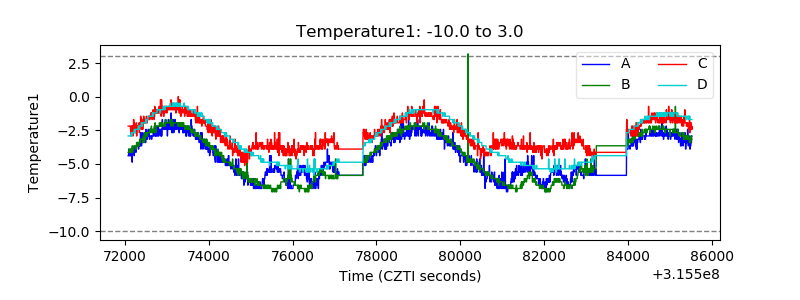 |
| Veto HV Monitor | 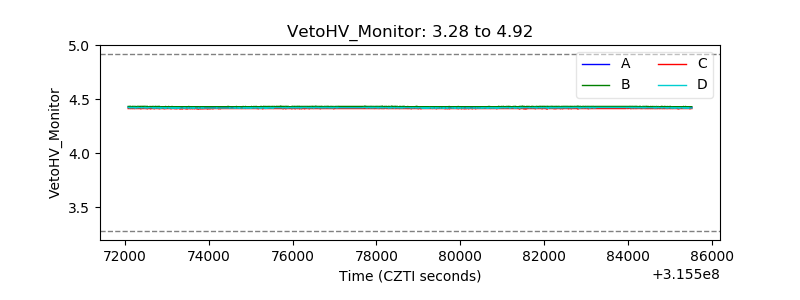 |
| Veto LLD | 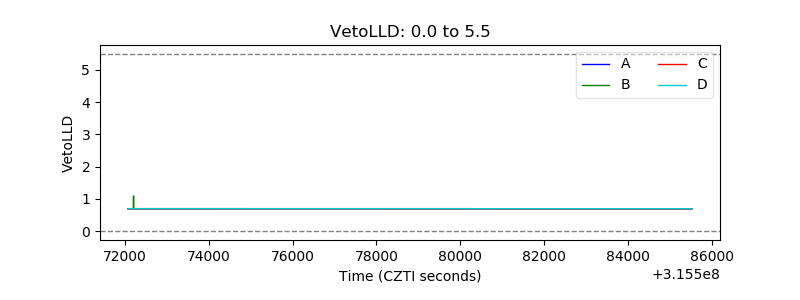 |
| Alpha Counter | 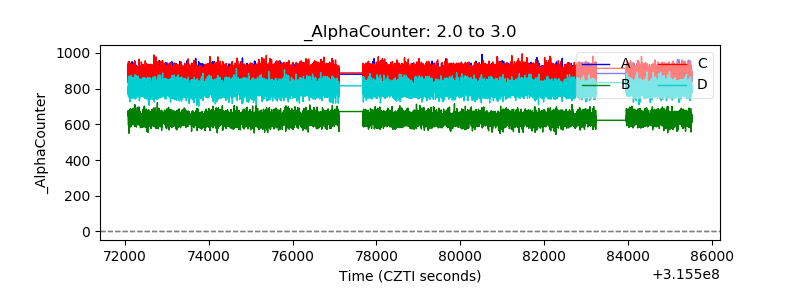 |
| _CPM_Rate | 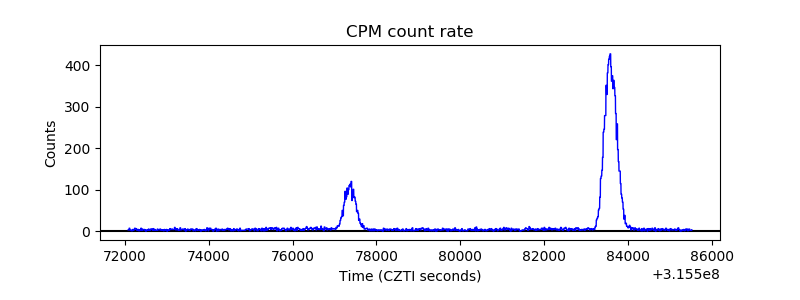 |
| CZT Counter | 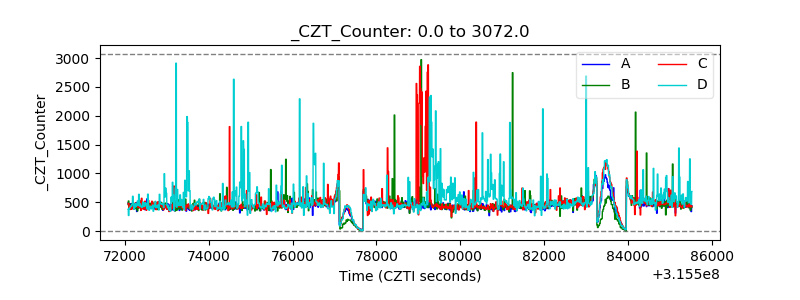 |
| +2.5 Volts monitor | 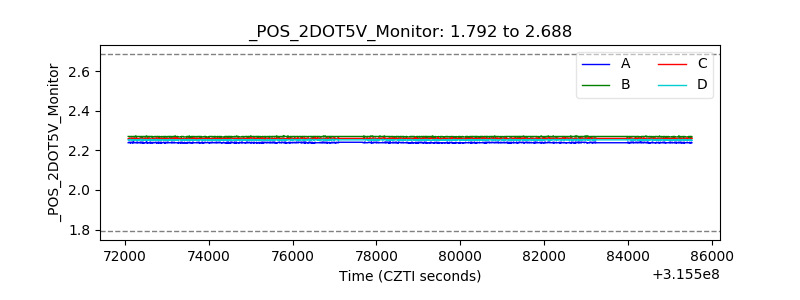 |
| +5 Volts monitor |  |
| _ROLL_ROT | 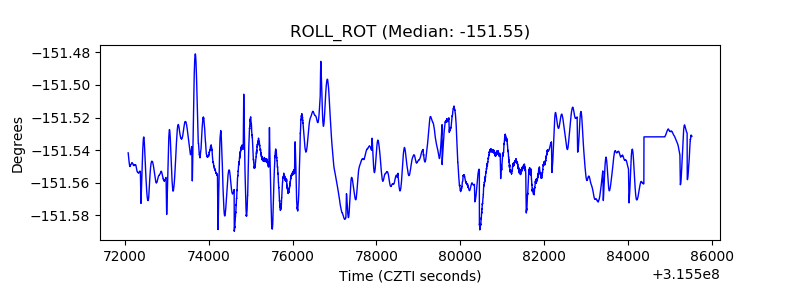 |
| _Roll_DEC | 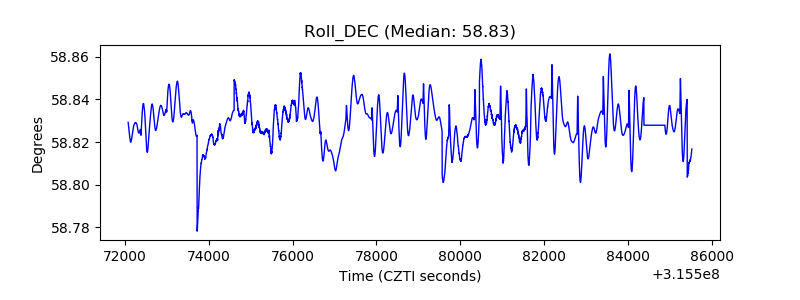 |
| _Roll_RA | 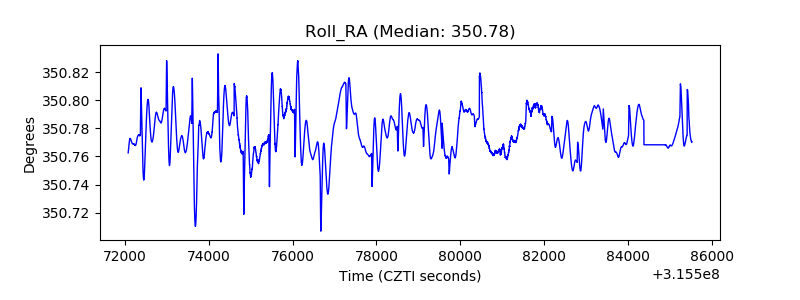 |
| Veto Counter | 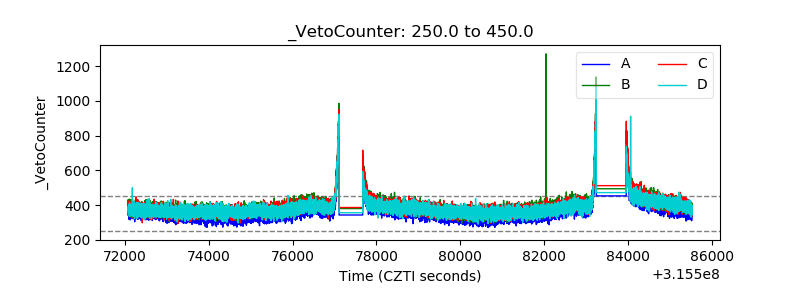 |