| Param | Original file | Final file |
|---|---|---|
| Filename | modeM0/AS1C05_004T01_9000003404_23041cztM0_level2.evt | modeM0/AS1C05_004T01_9000003404_23041cztM0_level2_quad_clean.evt |
| Size (bytes) | 497,712,960 | 108,129,600 |
| Size | 474.7 MB | 103.1 MB |
| Events in quadrant A | 3,032,624 | 724,818 |
| Events in quadrant B | 3,227,739 | 744,623 |
| Events in quadrant C | 3,269,279 | 719,531 |
| Events in quadrant D | 5,116,335 | 646,295 |
| Mode M0 | |||
|---|---|---|---|
| Quadrant | BADHDUFLAG | Total packets | Discarded packets |
| A | 0 | 13170 | 2 |
| B | 0 | 13755 | 2 |
| C | 0 | 13785 | 2 |
| D | 0 | 19519 | 2 |
| Mode SS | |||
|---|---|---|---|
| Quadrant | BADHDUFLAG | Total packets | Discarded packets |
| A | 0 | 130 | 0 |
| B | 0 | 130 | 0 |
| C | 0 | 130 | 0 |
| D | 0 | 130 | 0 |
| Mode M9 | |||
|---|---|---|---|
| Quadrant | BADHDUFLAG | Total packets | Discarded packets |
| A | 0 | 14 | 0 |
| B | 0 | 15 | 0 |
| C | 0 | 15 | 0 |
| D | 0 | 15 | 0 |
| Quadrant | Total seconds | Saturated seconds | Saturation percentage |
|---|---|---|---|
| A | 6288 | 15 | 0.238550% |
| B | 6288 | 69 | 1.097328% |
| C | 6288 | 79 | 1.256361% |
| D | 6288 | 618 | 9.828244% |
Noise dominated data is calculated using 1-second bins in cleaned event files. If a bin has >2000 counts, and if more than 50% of those come from <1% of pixels, then it is considered to be noise-dominated and hence unusable.
| Quadrant | # 1 sec bins | Bins with >0 counts | Bins with >2000 counts | High rate bins dominated by noise | Noise dominated (total time) | Noise dominated (detector-on time) | Marked lightcurve |
|---|---|---|---|---|---|---|---|
| A | 7503 | 6289 | 0 | 0 | 0.00% | 0.00% | 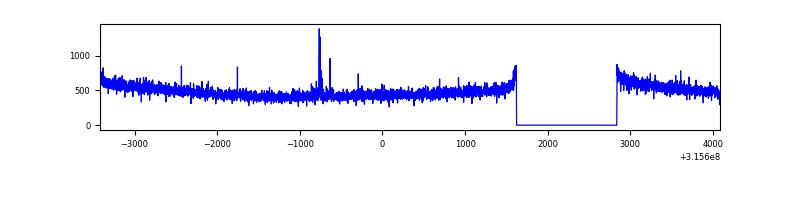 |
| B | 7503 | 6289 | 28 | 28 | 0.37% | 0.45% | 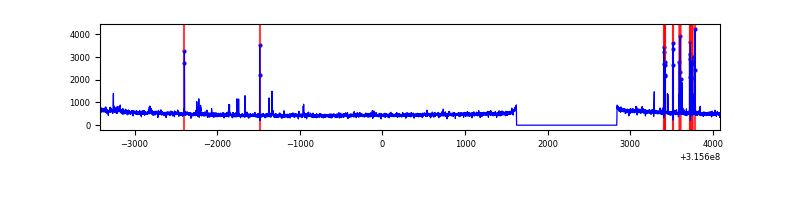 |
| C | 7503 | 6289 | 12 | 12 | 0.16% | 0.19% | 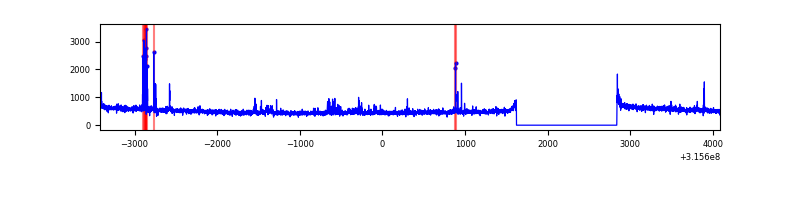 |
| D | 7503 | 6289 | 458 | 458 | 6.10% | 7.28% | 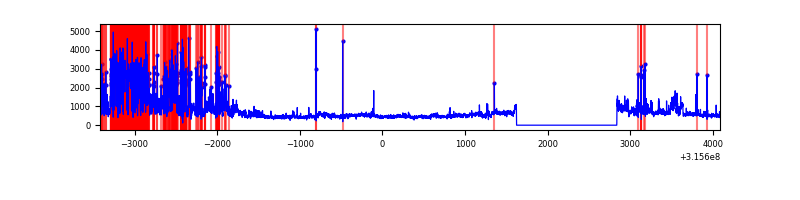 |
Top three noisy pixels from each quadrant. If the there are fewer than three noisy pixels in the level2.evt file, extra rows are filled as -1
| Pixel properties | Quadrant properties | ||||||
|---|---|---|---|---|---|---|---|
| Quadrant | DetID | PixID | Counts | Sigma | Mean | Median | Sigma |
| A | 15 | 174 | 13234 | 79.57 | 782 | 767 | 156.7 |
| A | 13 | 254 | 10205 | 60.24 | 782 | 767 | 156.7 |
| A | 0 | 226 | 6642 | 37.5 | 782 | 767 | 156.7 |
| B | 4 | 216 | 99186 | 680.31 | 782 | 765 | 144.7 |
| B | 0 | 190 | 25262 | 169.33 | 782 | 765 | 144.7 |
| B | 3 | 64 | 20821 | 138.63 | 782 | 765 | 144.7 |
| C | 14 | 238 | 123393 | 691.05 | 768 | 775 | 177.4 |
| C | 0 | 207 | 114023 | 638.24 | 768 | 775 | 177.4 |
| C | 10 | 22 | 19240 | 104.07 | 768 | 775 | 177.4 |
| D | 1 | 52 | 2023174 | 11421.13 | 734 | 713 | 177.1 |
| D | 9 | 85 | 117251 | 658.11 | 734 | 713 | 177.1 |
| D | 12 | 227 | 80758 | 452.03 | 734 | 713 | 177.1 |
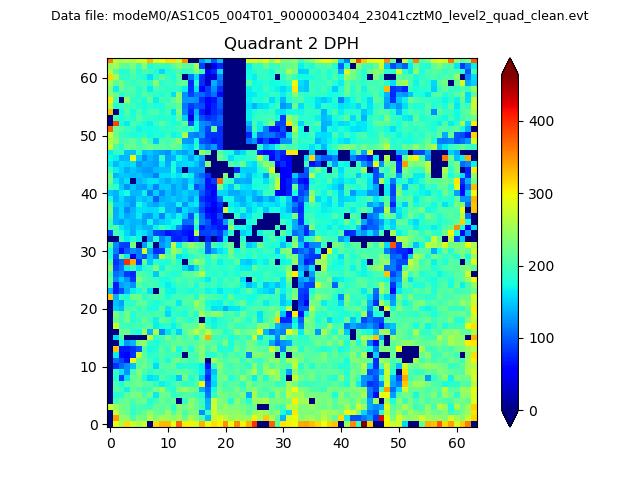
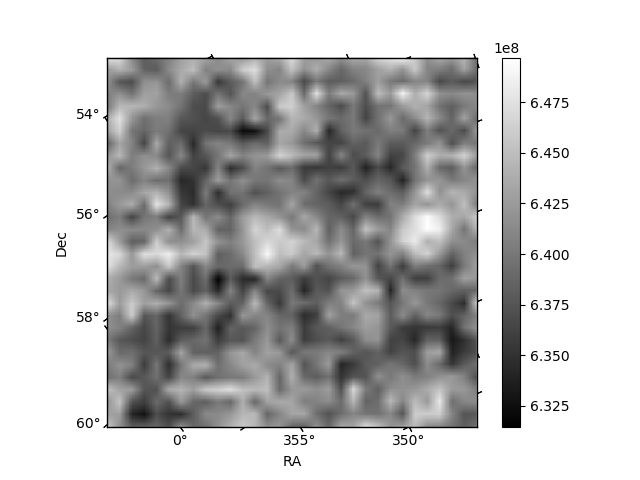
Histogram calculated using DETX and DETY for each event in the final _common_clean file
| Quadrant A | 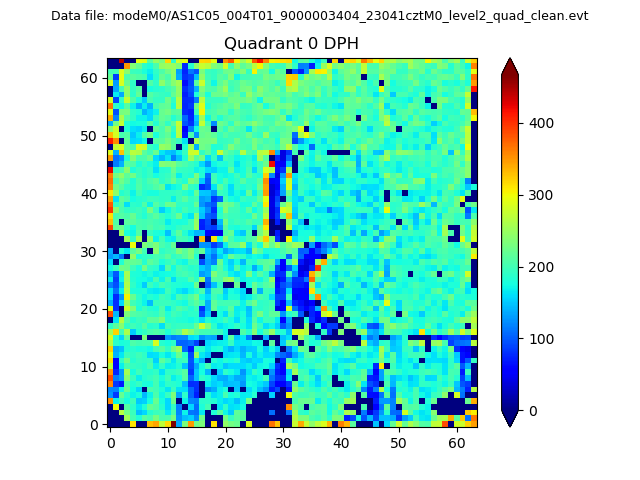 |
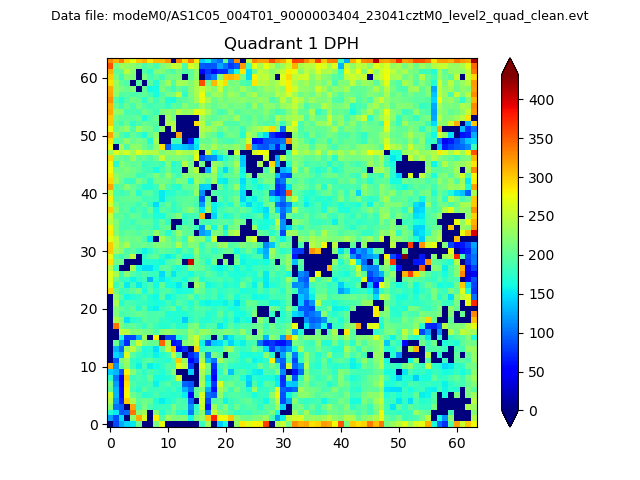 |
Quadrant B |
|---|---|---|---|
| Quadrant D | 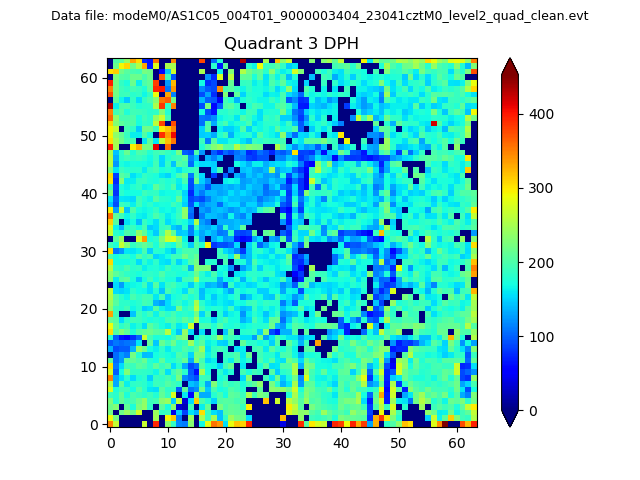 |
 |
Quadrant C |
| Plot type | Count rate plots | Images |
|---|---|---|
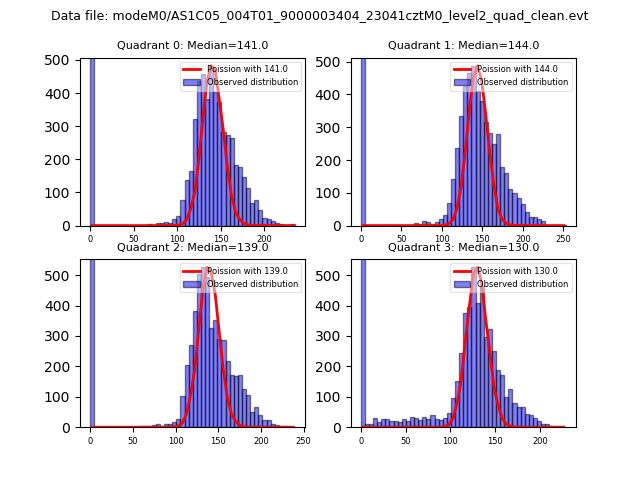
| Comparison with Poisson distribution Blue bars denote a histogram of data divided into 1 sec bins. Red curve is a Poisson curve with rate = median count rate of data. |
 |
 |
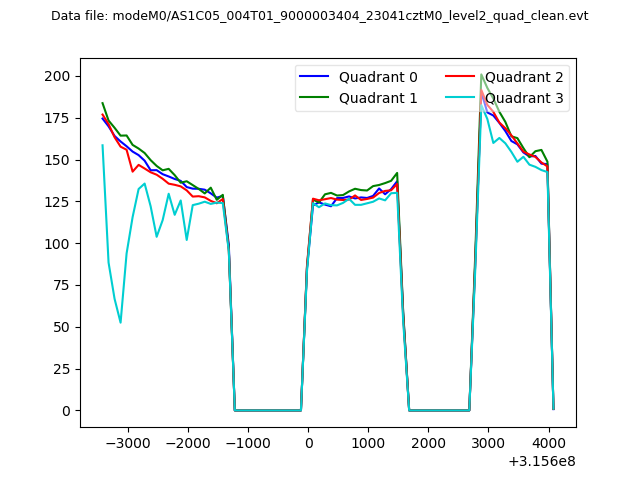
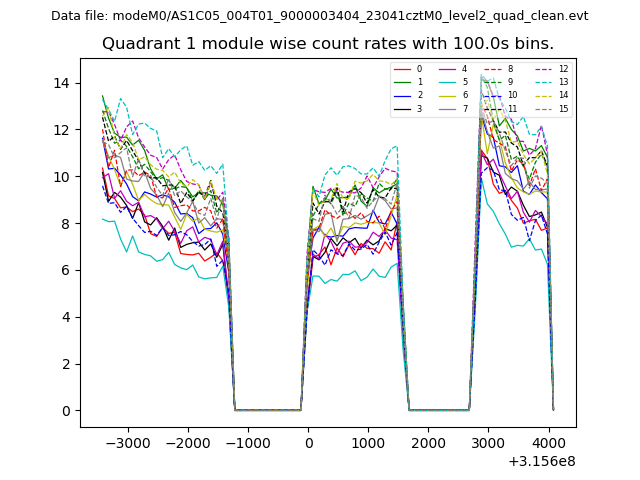
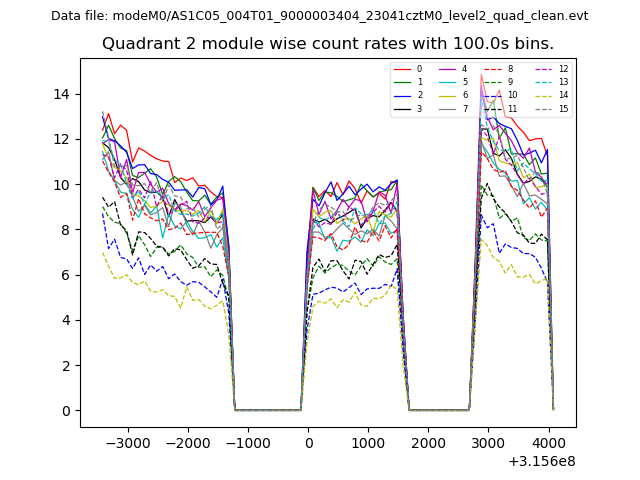
| Quadrant-wise count rates Data is divided into 100 sec bins |
 |
|
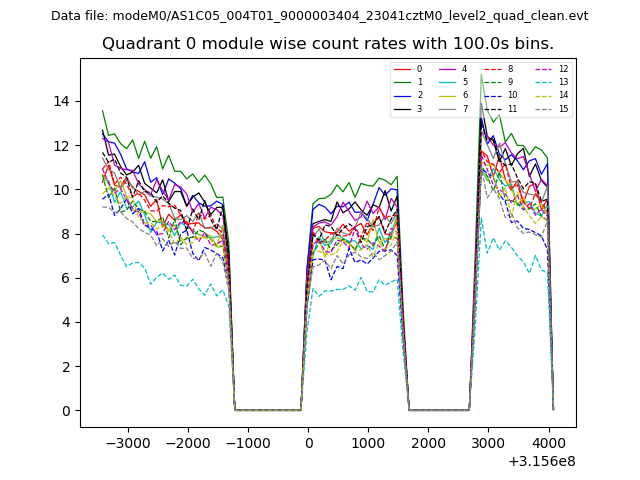
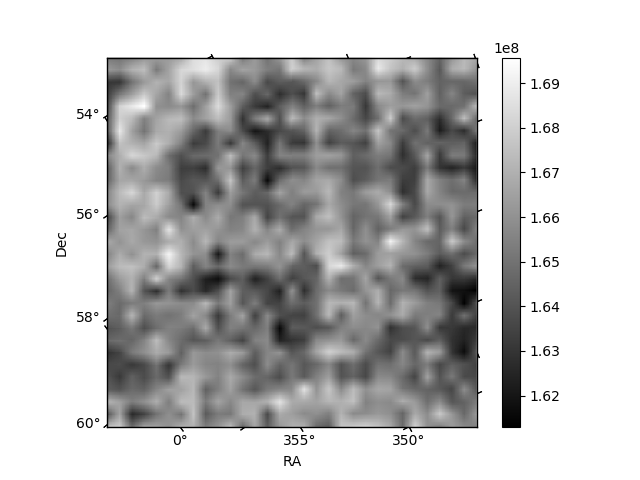
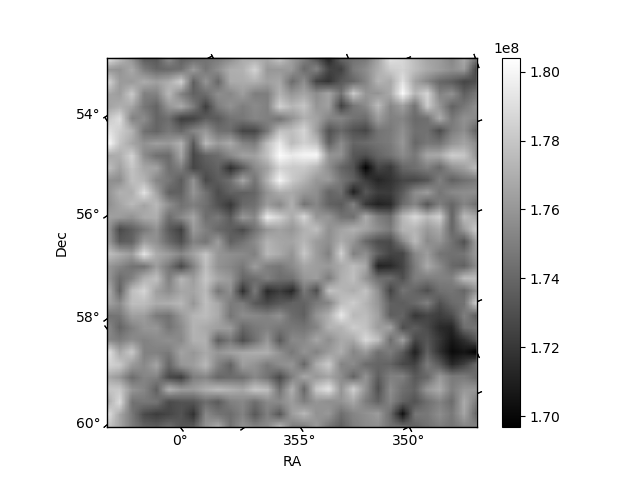
| Module-wise count rates for Quadrant A Data is divided into 100 sec bins |
 |
 |
| Module-wise count rates for Quadrant B Data is divided into 100 sec bins |
 |
 |
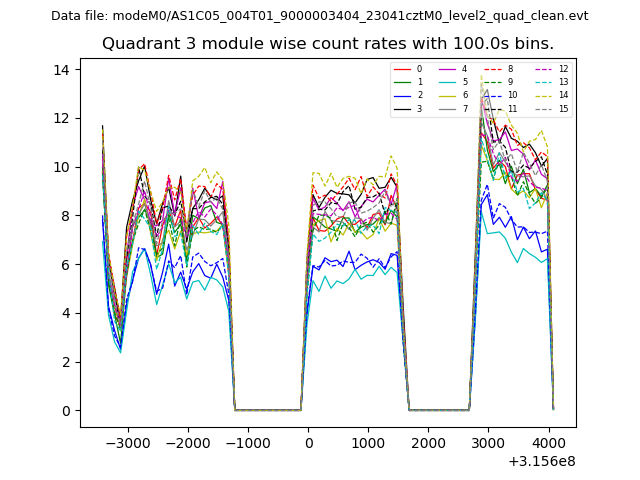
| Module-wise count rates for Quadrant C Data is divided into 100 sec bins |
 |
 |
| Module-wise count rates for Quadrant D Data is divided into 100 sec bins |
 |
 |
| Parameter | Plot |
|---|---|
| CZT HV Monitor | 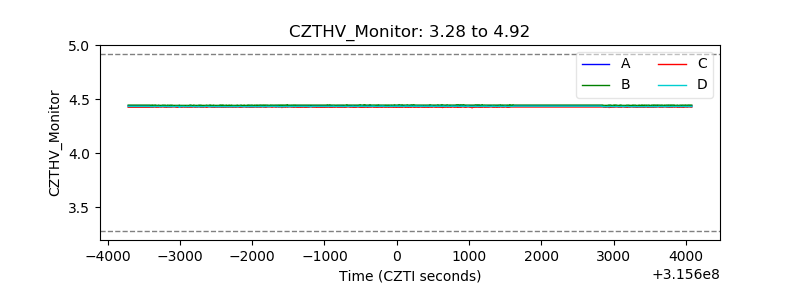 |
| D_VDD | 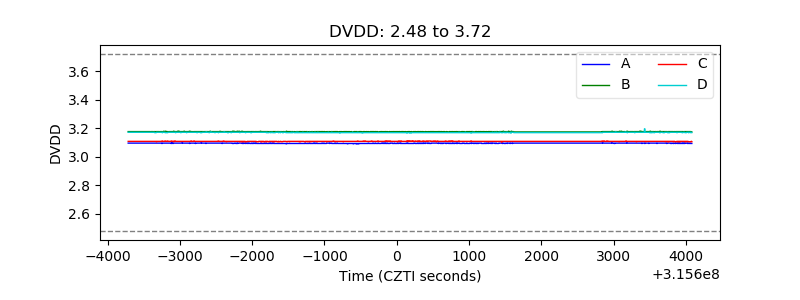 |
| Temperature 1 | 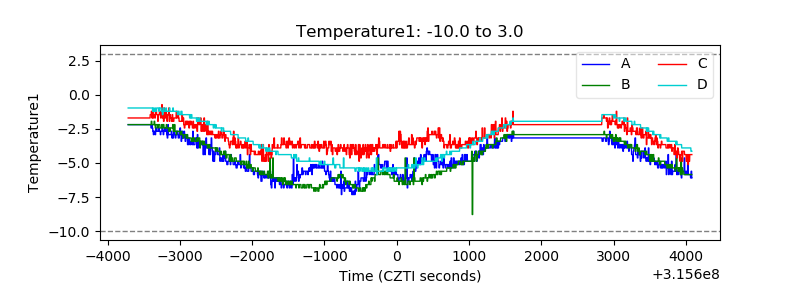 |
| Veto HV Monitor | 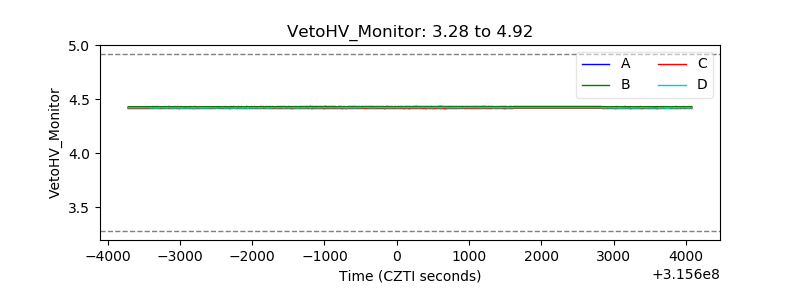 |
| Veto LLD | 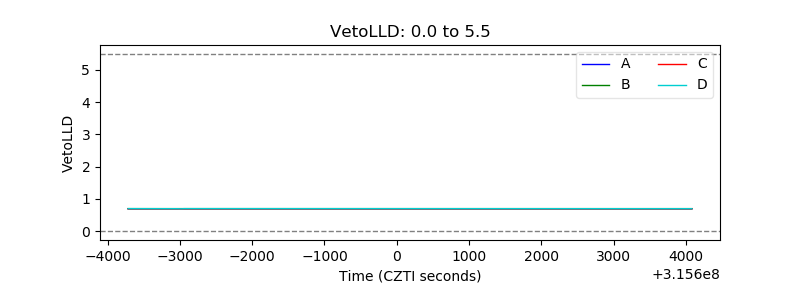 |
| Alpha Counter | 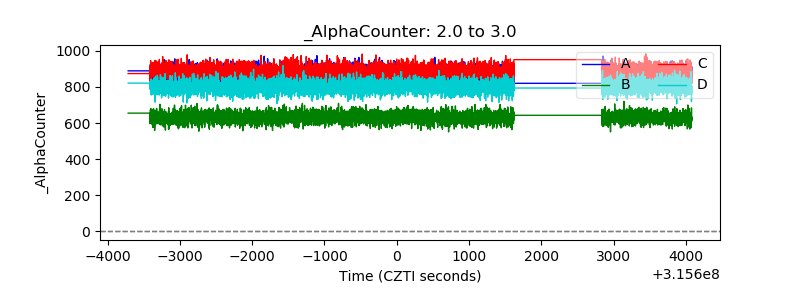 |
| _CPM_Rate | 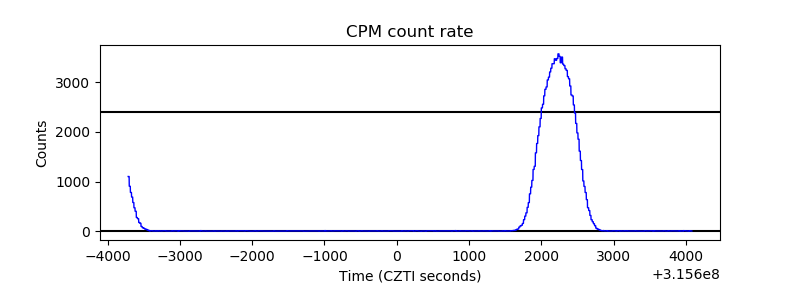 |
| CZT Counter | 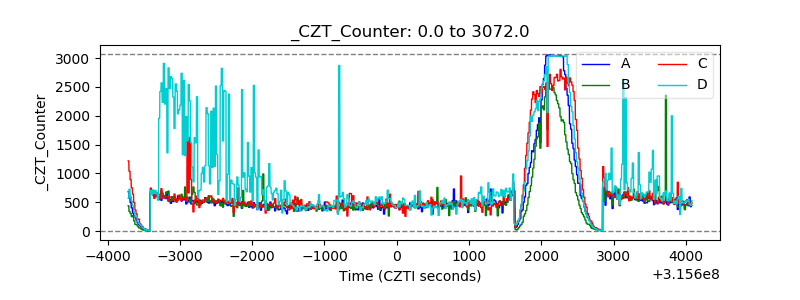 |
| +2.5 Volts monitor | 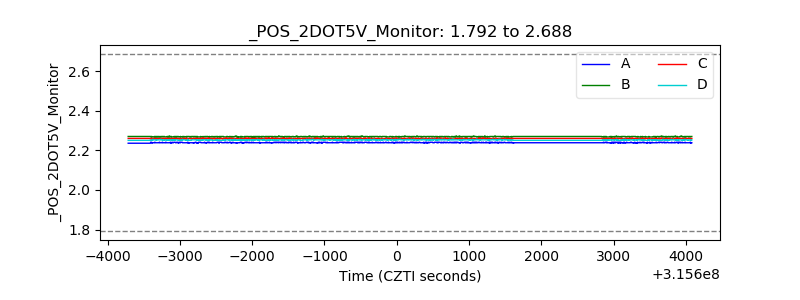 |
| +5 Volts monitor | 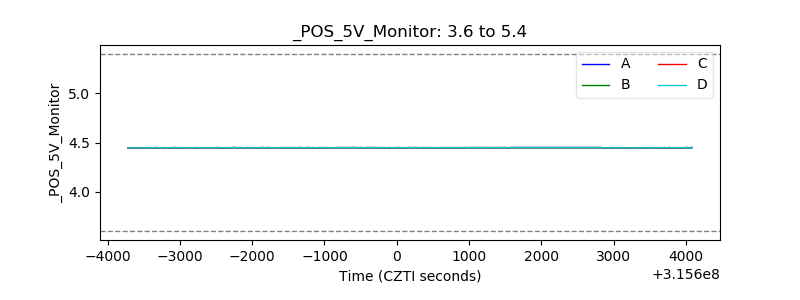 |
| _ROLL_ROT | 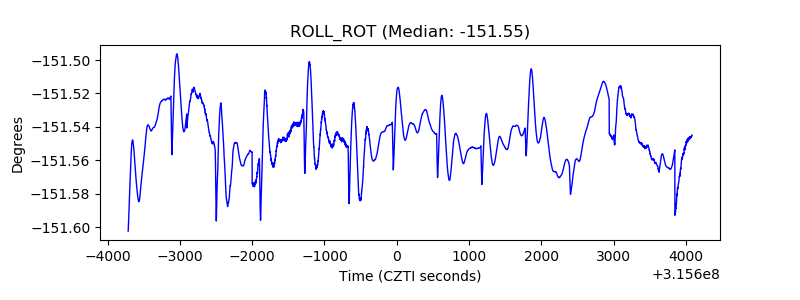 |
| _Roll_DEC | 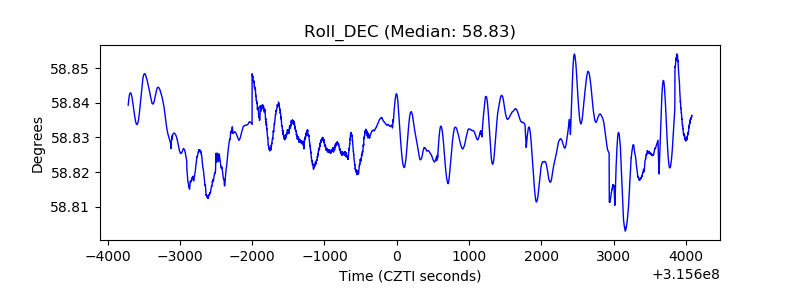 |
| _Roll_RA | 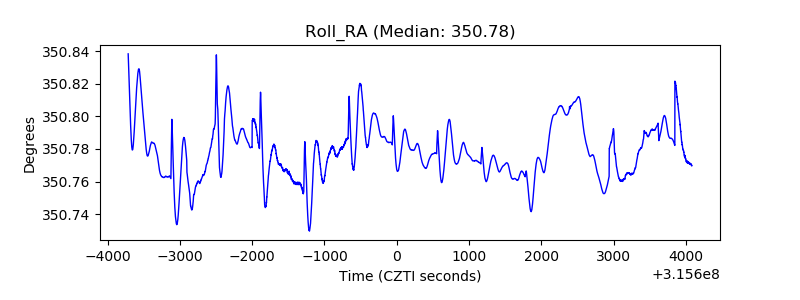 |
| Veto Counter | 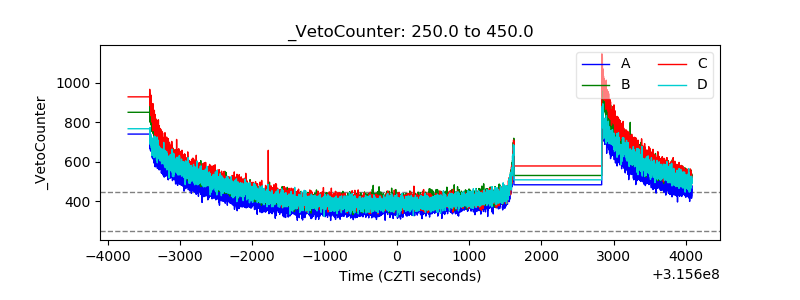 |