| Param | Original file | Final file |
|---|---|---|
| Filename | modeM0/AS1C05_004T01_9000003404_23042cztM0_level2.evt | modeM0/AS1C05_004T01_9000003404_23042cztM0_level2_quad_clean.evt |
| Size (bytes) | 446,639,040 | 112,985,280 |
| Size | 425.9 MB | 107.8 MB |
| Events in quadrant A | 3,052,577 | 747,209 |
| Events in quadrant B | 3,295,956 | 775,275 |
| Events in quadrant C | 3,248,470 | 747,742 |
| Events in quadrant D | 3,507,443 | 718,337 |
| Mode M0 | |||
|---|---|---|---|
| Quadrant | BADHDUFLAG | Total packets | Discarded packets |
| A | 0 | 13126 | 2 |
| B | 0 | 13829 | 2 |
| C | 0 | 13674 | 2 |
| D | 0 | 14684 | 2 |
| Mode SS | |||
|---|---|---|---|
| Quadrant | BADHDUFLAG | Total packets | Discarded packets |
| A | 0 | 124 | 0 |
| B | 0 | 124 | 0 |
| C | 0 | 124 | 0 |
| D | 0 | 124 | 0 |
| Mode M9 | |||
|---|---|---|---|
| Quadrant | BADHDUFLAG | Total packets | Discarded packets |
| A | 0 | 18 | 0 |
| B | 0 | 19 | 0 |
| C | 0 | 19 | 0 |
| D | 0 | 19 | 0 |
| Quadrant | Total seconds | Saturated seconds | Saturation percentage |
|---|---|---|---|
| A | 6220 | 15 | 0.241158% |
| B | 6220 | 60 | 0.964630% |
| C | 6220 | 82 | 1.318328% |
| D | 6220 | 67 | 1.077170% |
Noise dominated data is calculated using 1-second bins in cleaned event files. If a bin has >2000 counts, and if more than 50% of those come from <1% of pixels, then it is considered to be noise-dominated and hence unusable.
| Quadrant | # 1 sec bins | Bins with >0 counts | Bins with >2000 counts | High rate bins dominated by noise | Noise dominated (total time) | Noise dominated (detector-on time) | Marked lightcurve |
|---|---|---|---|---|---|---|---|
| A | 7540 | 6221 | 0 | 0 | 0.00% | 0.00% | 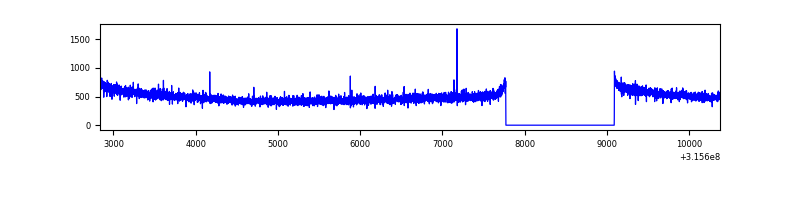 |
| B | 7540 | 6221 | 32 | 32 | 0.42% | 0.51% | 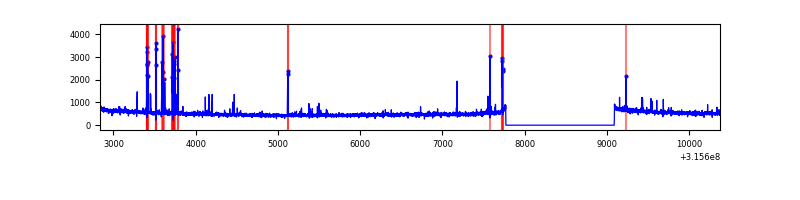 |
| C | 7540 | 6221 | 9 | 9 | 0.12% | 0.14% | 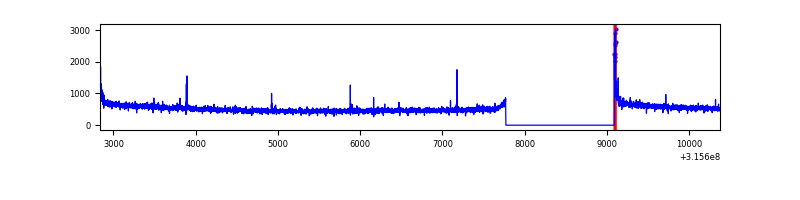 |
| D | 7540 | 6221 | 35 | 35 | 0.46% | 0.56% | 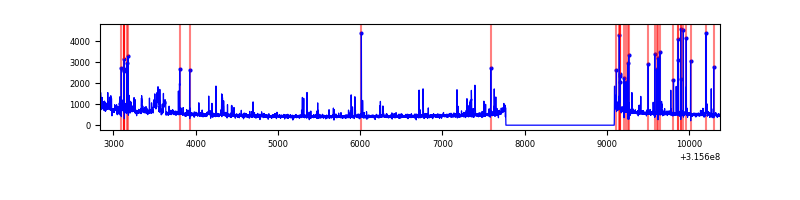 |
Top three noisy pixels from each quadrant. If the there are fewer than three noisy pixels in the level2.evt file, extra rows are filled as -1
| Pixel properties | Quadrant properties | ||||||
|---|---|---|---|---|---|---|---|
| Quadrant | DetID | PixID | Counts | Sigma | Mean | Median | Sigma |
| A | 13 | 254 | 9155 | 53.34 | 789 | 775 | 157.1 |
| A | 0 | 226 | 6958 | 39.36 | 789 | 775 | 157.1 |
| A | 3 | 137 | 6495 | 36.41 | 789 | 775 | 157.1 |
| B | 4 | 216 | 114380 | 777.81 | 796 | 778 | 146.1 |
| B | 5 | 172 | 18483 | 121.22 | 796 | 778 | 146.1 |
| B | 3 | 64 | 17072 | 111.56 | 796 | 778 | 146.1 |
| C | 14 | 238 | 123591 | 679.37 | 782 | 789 | 180.8 |
| C | 0 | 10 | 53645 | 292.41 | 782 | 789 | 180.8 |
| C | 0 | 207 | 12690 | 65.84 | 782 | 789 | 180.8 |
| D | 1 | 52 | 312555 | 1661.23 | 782 | 760 | 187.7 |
| D | 12 | 227 | 83928 | 443.12 | 782 | 760 | 187.7 |
| D | 13 | 153 | 47625 | 249.69 | 782 | 760 | 187.7 |
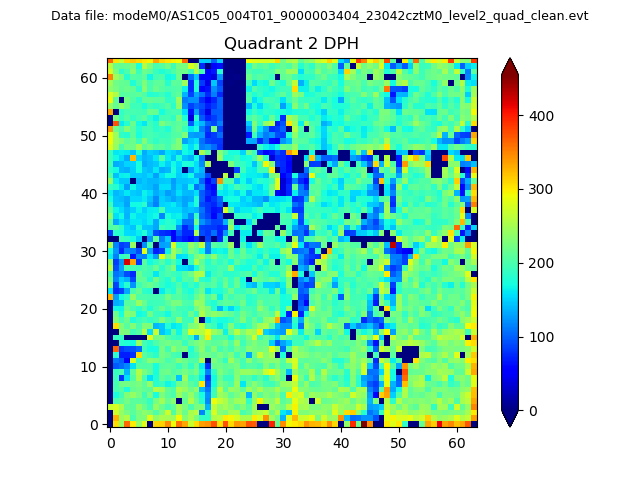
Histogram calculated using DETX and DETY for each event in the final _common_clean file
| Quadrant A | 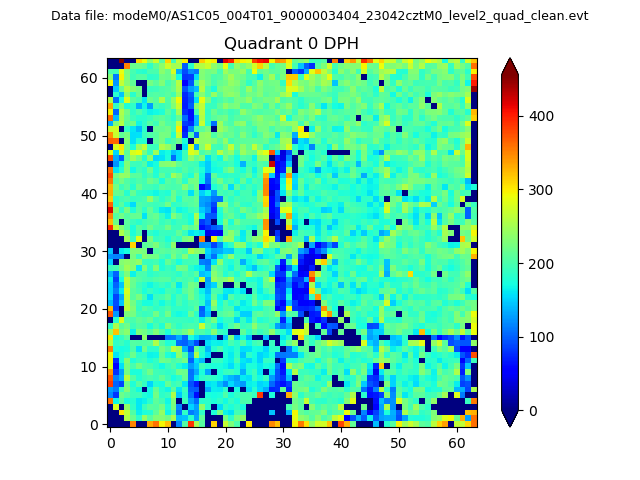 |
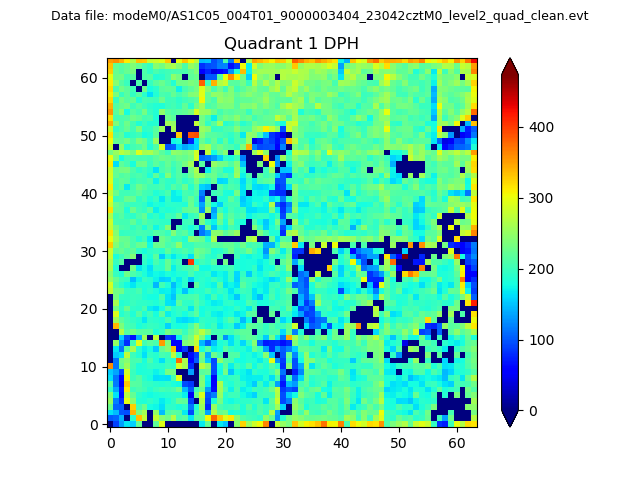 |
Quadrant B |
|---|---|---|---|
| Quadrant D | 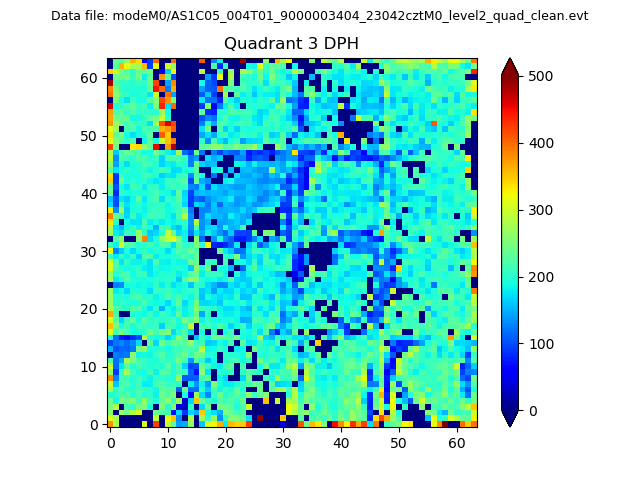 |
 |
Quadrant C |
| Plot type | Count rate plots | Images |
|---|---|---|
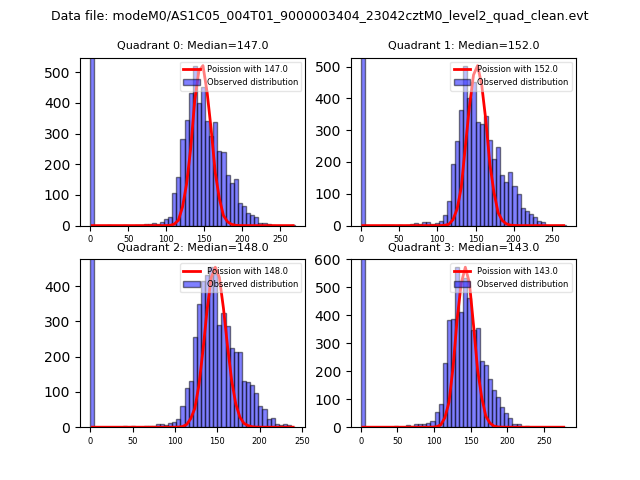
| Comparison with Poisson distribution Blue bars denote a histogram of data divided into 1 sec bins. Red curve is a Poisson curve with rate = median count rate of data. |
 |
 |
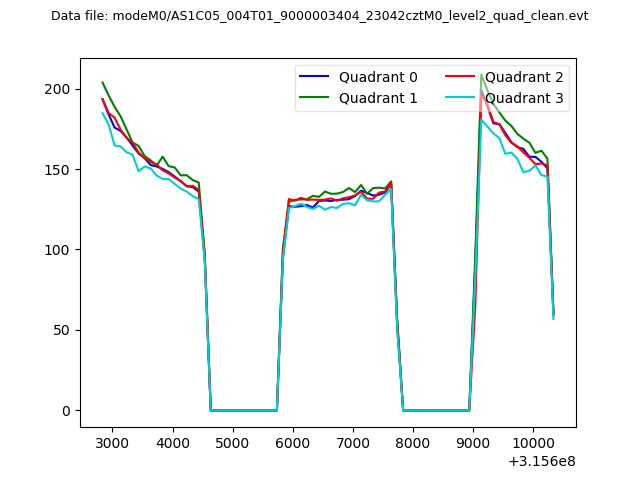
| Quadrant-wise count rates Data is divided into 100 sec bins |
 |
|
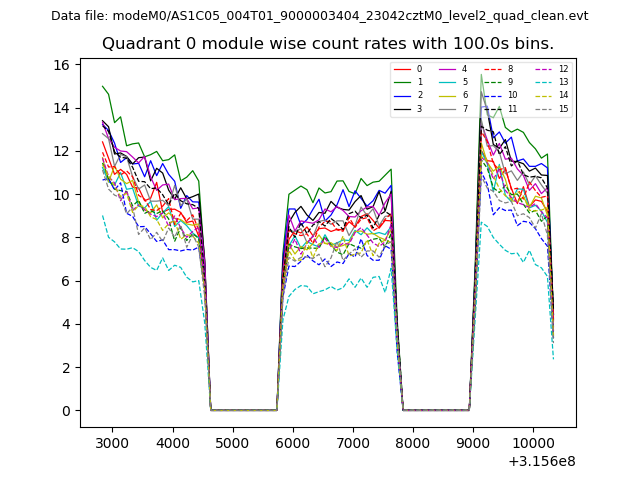
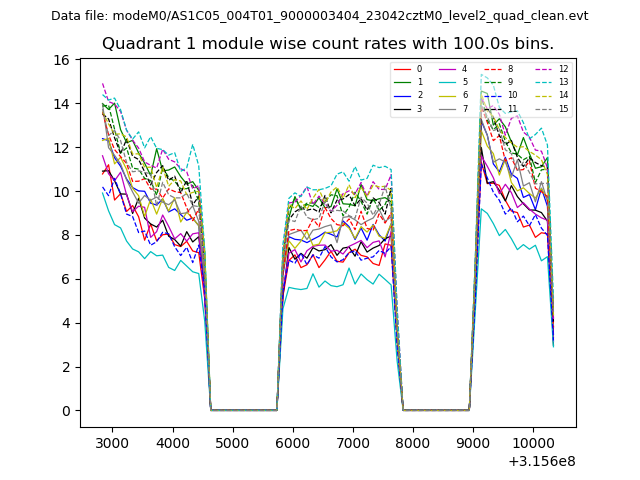
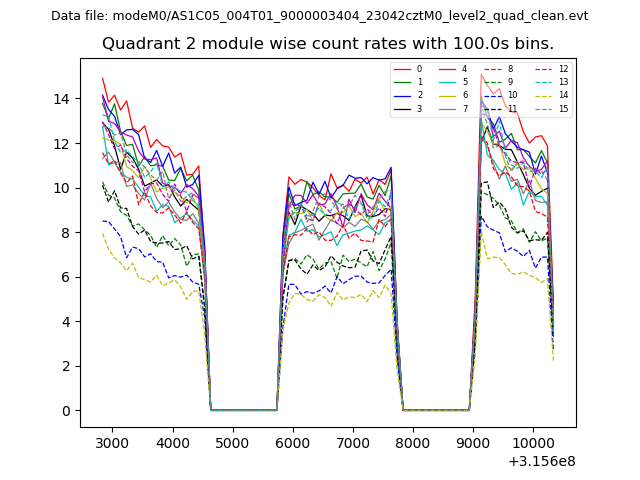
| Module-wise count rates for Quadrant A Data is divided into 100 sec bins |
 |
 |
| Module-wise count rates for Quadrant B Data is divided into 100 sec bins |
 |
 |
| Module-wise count rates for Quadrant C Data is divided into 100 sec bins |
 |
 |
| Module-wise count rates for Quadrant D Data is divided into 100 sec bins |
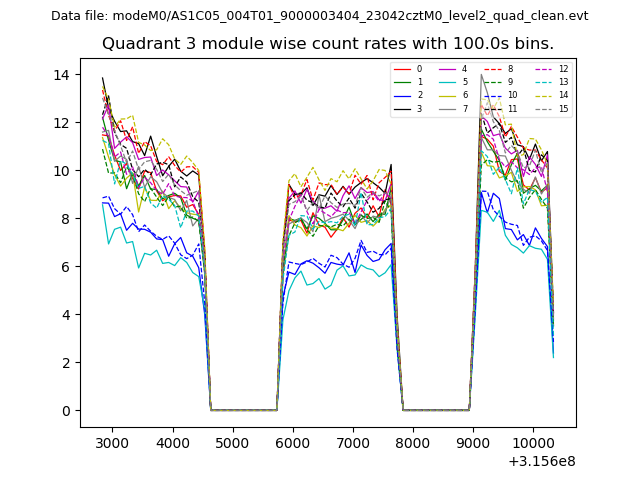 |
 |
| Parameter | Plot |
|---|---|
| CZT HV Monitor | 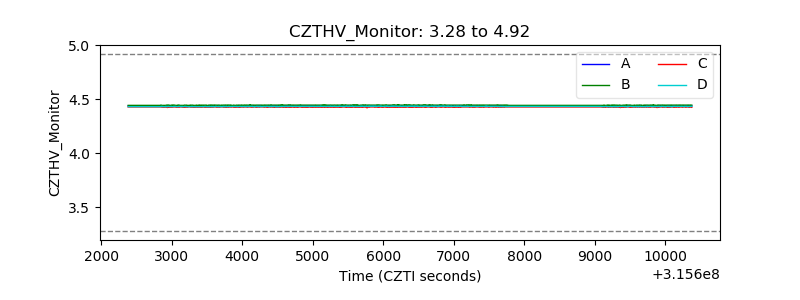 |
| D_VDD | 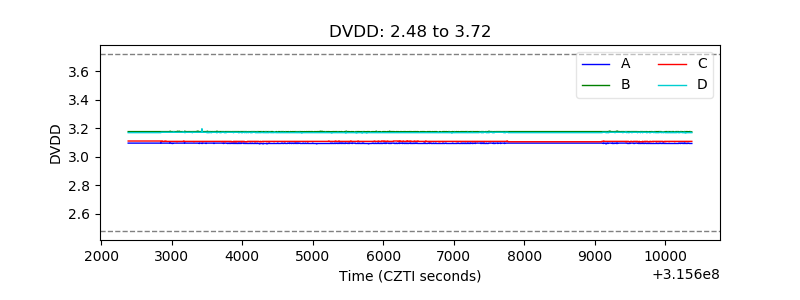 |
| Temperature 1 | 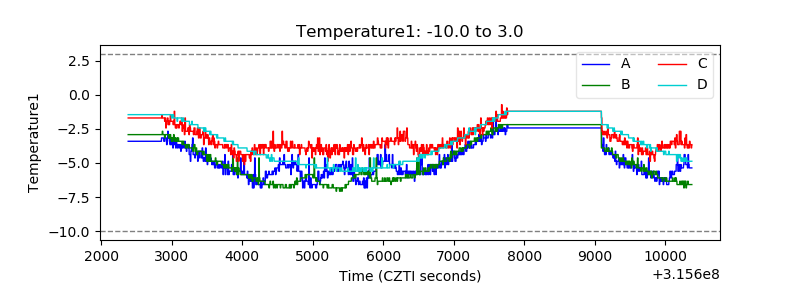 |
| Veto HV Monitor | 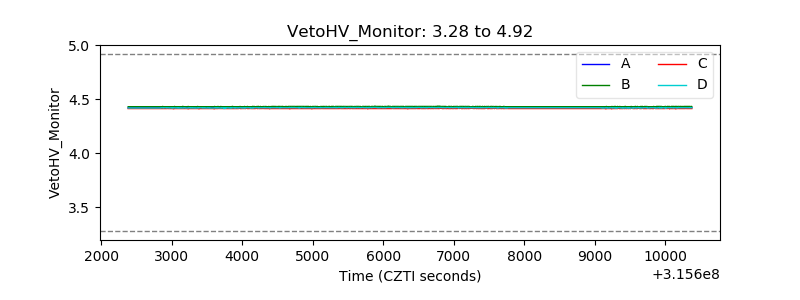 |
| Veto LLD | 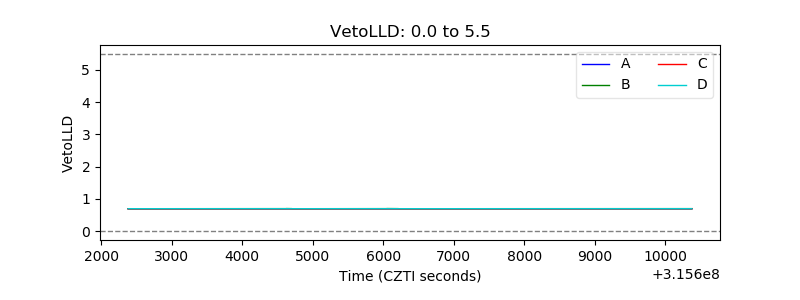 |
| Alpha Counter | 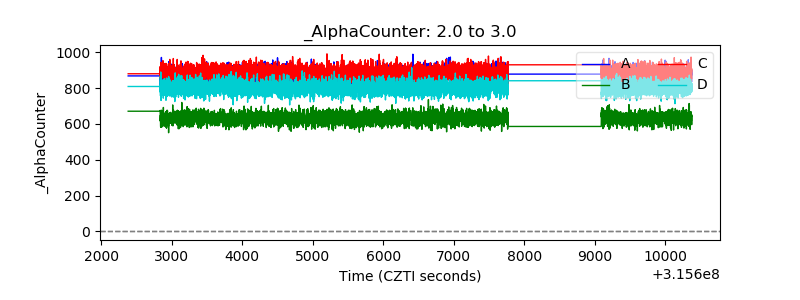 |
| _CPM_Rate | 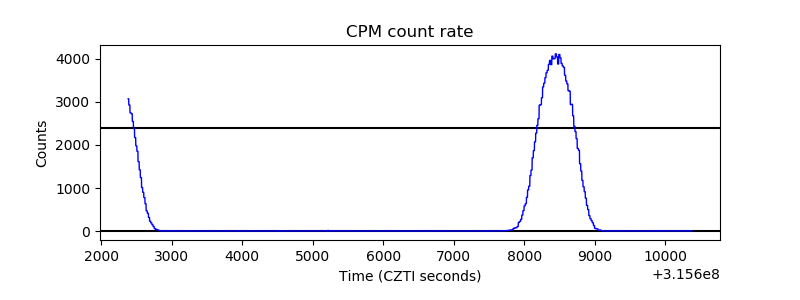 |
| CZT Counter | 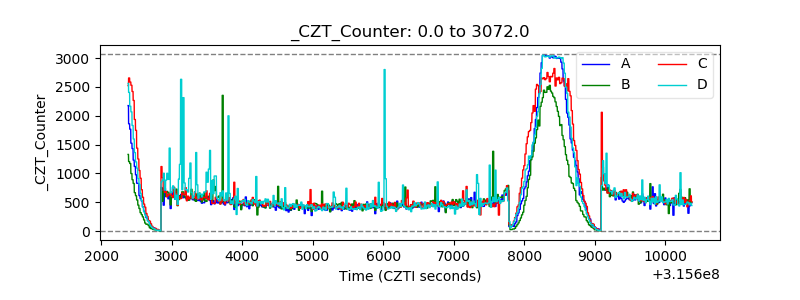 |
| +2.5 Volts monitor |  |
| +5 Volts monitor |  |
| _ROLL_ROT |  |
| _Roll_DEC |  |
| _Roll_RA | 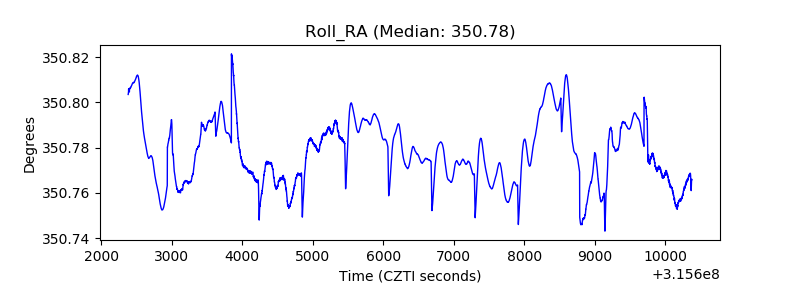 |
| Veto Counter |  |