| Param | Original file | Final file |
|---|---|---|
| Filename | modeM0/AS1C05_004T01_9000003404_23043cztM0_level2.evt | modeM0/AS1C05_004T01_9000003404_23043cztM0_level2_quad_clean.evt |
| Size (bytes) | 450,875,520 | 106,032,960 |
| Size | 430.0 MB | 101.1 MB |
| Events in quadrant A | 3,058,738 | 698,994 |
| Events in quadrant B | 3,264,227 | 727,622 |
| Events in quadrant C | 3,320,212 | 688,793 |
| Events in quadrant D | 3,593,803 | 666,718 |
| Mode M0 | |||
|---|---|---|---|
| Quadrant | BADHDUFLAG | Total packets | Discarded packets |
| A | 0 | 13011 | 2 |
| B | 0 | 13521 | 2 |
| C | 0 | 13699 | 2 |
| D | 0 | 14642 | 2 |
| Mode SS | |||
|---|---|---|---|
| Quadrant | BADHDUFLAG | Total packets | Discarded packets |
| A | 0 | 124 | 0 |
| B | 0 | 124 | 0 |
| C | 0 | 124 | 0 |
| D | 0 | 124 | 0 |
| Mode M9 | |||
|---|---|---|---|
| Quadrant | BADHDUFLAG | Total packets | Discarded packets |
| A | 0 | 19 | 0 |
| B | 0 | 20 | 0 |
| C | 0 | 20 | 0 |
| D | 0 | 20 | 0 |
| Quadrant | Total seconds | Saturated seconds | Saturation percentage |
|---|---|---|---|
| A | 6151 | 20 | 0.325150% |
| B | 6151 | 58 | 0.942936% |
| C | 6151 | 136 | 2.211023% |
| D | 6151 | 144 | 2.341083% |
Noise dominated data is calculated using 1-second bins in cleaned event files. If a bin has >2000 counts, and if more than 50% of those come from <1% of pixels, then it is considered to be noise-dominated and hence unusable.
| Quadrant | # 1 sec bins | Bins with >0 counts | Bins with >2000 counts | High rate bins dominated by noise | Noise dominated (total time) | Noise dominated (detector-on time) | Marked lightcurve |
|---|---|---|---|---|---|---|---|
| A | 7531 | 6152 | 0 | 0 | 0.00% | 0.00% | 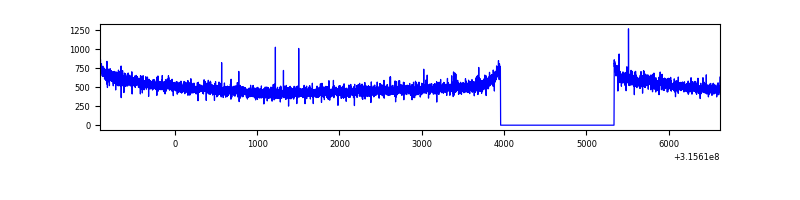 |
| B | 7531 | 6152 | 16 | 16 | 0.21% | 0.26% | 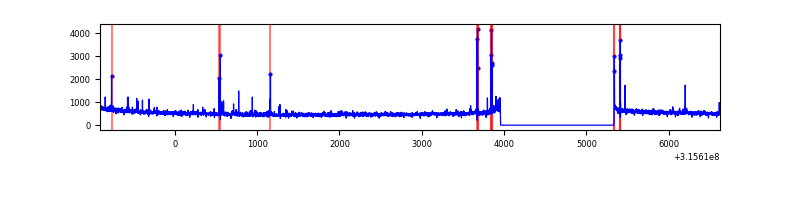 |
| C | 7531 | 6152 | 47 | 47 | 0.62% | 0.76% | 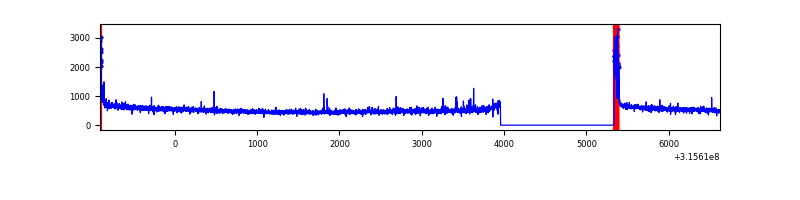 |
| D | 7531 | 6152 | 96 | 96 | 1.27% | 1.56% | 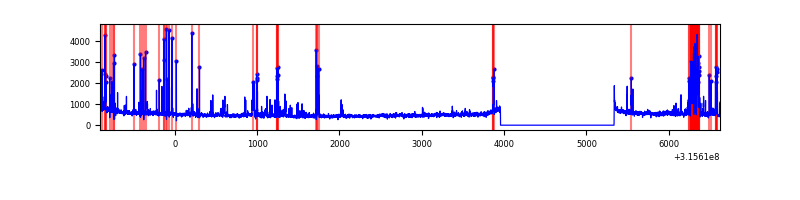 |
Top three noisy pixels from each quadrant. If the there are fewer than three noisy pixels in the level2.evt file, extra rows are filled as -1
| Pixel properties | Quadrant properties | ||||||
|---|---|---|---|---|---|---|---|
| Quadrant | DetID | PixID | Counts | Sigma | Mean | Median | Sigma |
| A | 6 | 16 | 16684 | 103.0 | 788 | 772 | 154.5 |
| A | 13 | 254 | 9583 | 57.03 | 788 | 772 | 154.5 |
| A | 0 | 226 | 6866 | 39.45 | 788 | 772 | 154.5 |
| B | 4 | 216 | 65854 | 443.26 | 799 | 780 | 146.8 |
| B | 3 | 209 | 24462 | 161.31 | 799 | 780 | 146.8 |
| B | 3 | 64 | 18430 | 120.22 | 799 | 780 | 146.8 |
| C | 0 | 10 | 150877 | 837.37 | 774 | 779 | 179.2 |
| C | 14 | 238 | 124062 | 687.77 | 774 | 779 | 179.2 |
| C | 0 | 207 | 28004 | 151.88 | 774 | 779 | 179.2 |
| D | 13 | 153 | 371428 | 1994.4 | 773 | 752 | 185.9 |
| D | 1 | 52 | 218950 | 1174.0 | 773 | 752 | 185.9 |
| D | 2 | 234 | 22647 | 117.8 | 773 | 752 | 185.9 |
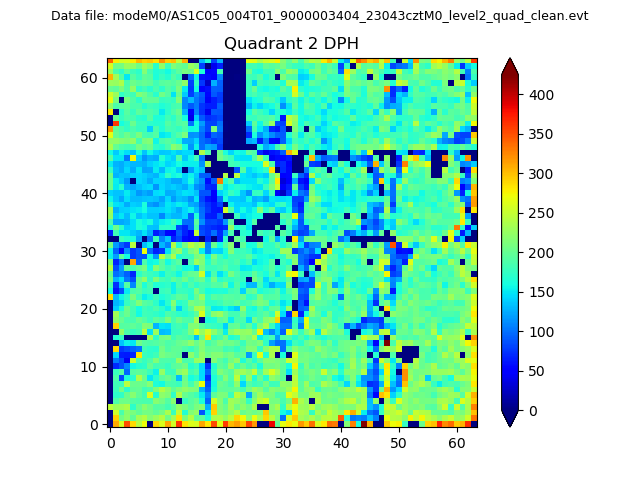
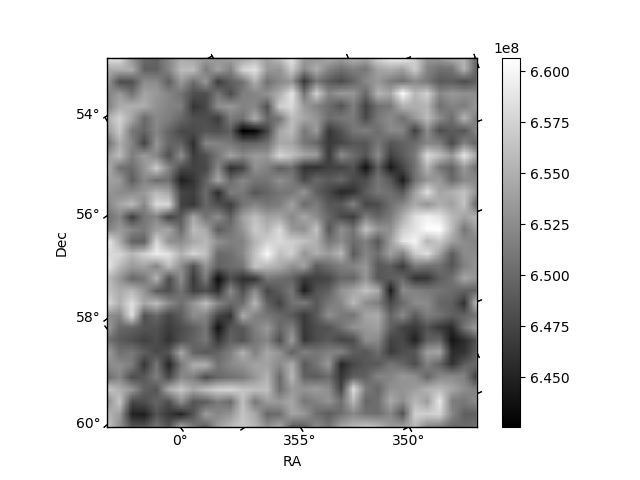
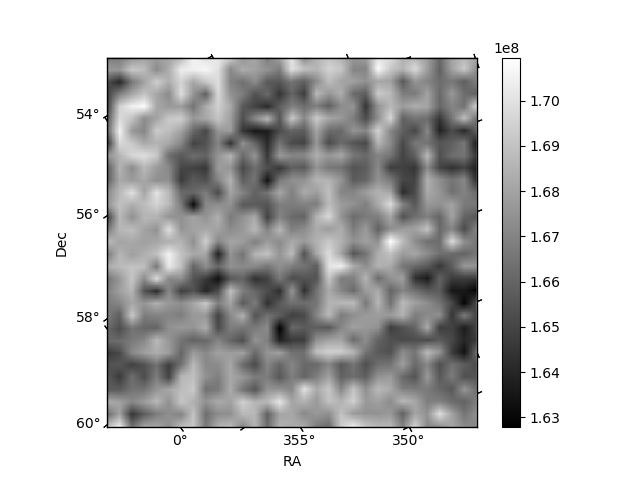
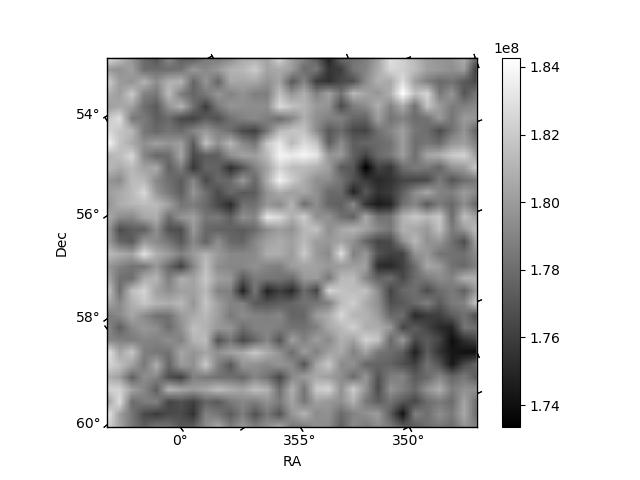
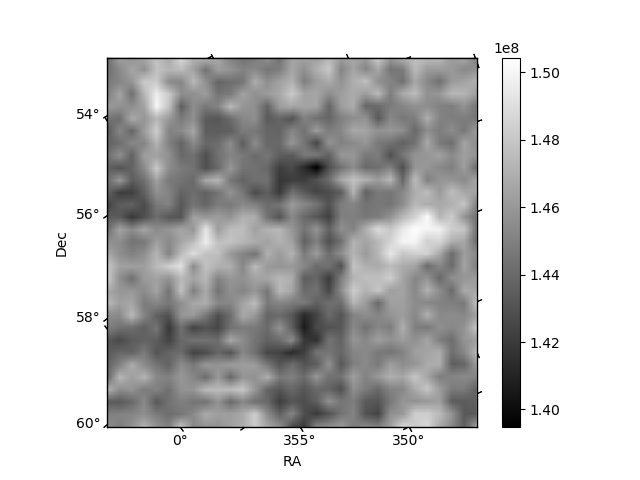
Histogram calculated using DETX and DETY for each event in the final _common_clean file
| Quadrant A | 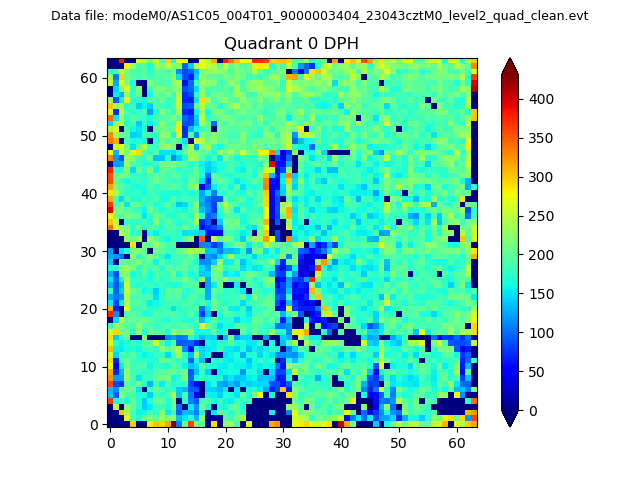 |
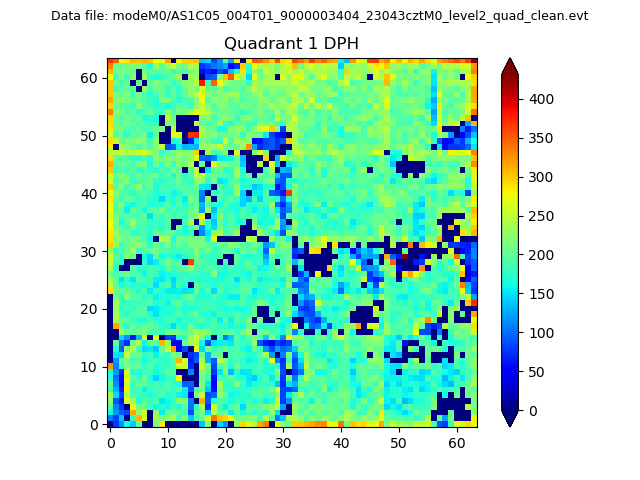 |
Quadrant B |
|---|---|---|---|
| Quadrant D | 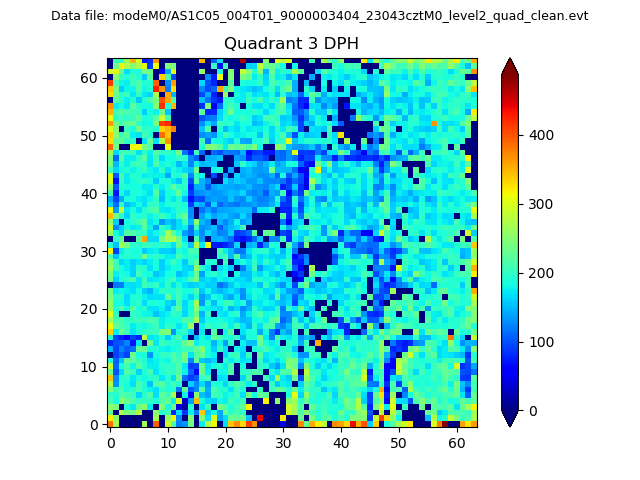 |
 |
Quadrant C |
| Plot type | Count rate plots | Images |
|---|---|---|
| Comparison with Poisson distribution Blue bars denote a histogram of data divided into 1 sec bins. Red curve is a Poisson curve with rate = median count rate of data. |
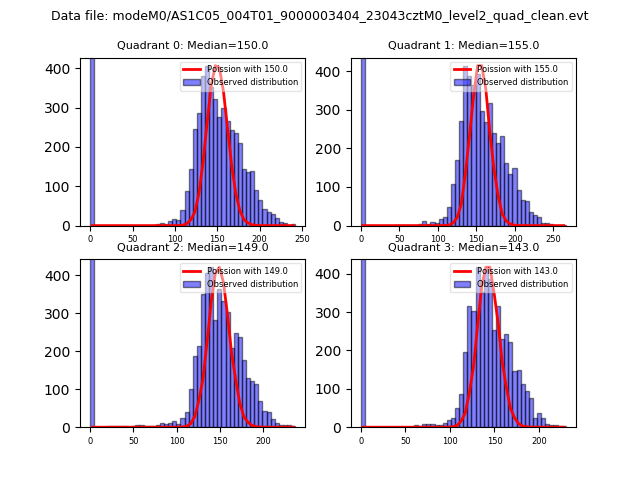 |
 |
| Quadrant-wise count rates Data is divided into 100 sec bins |
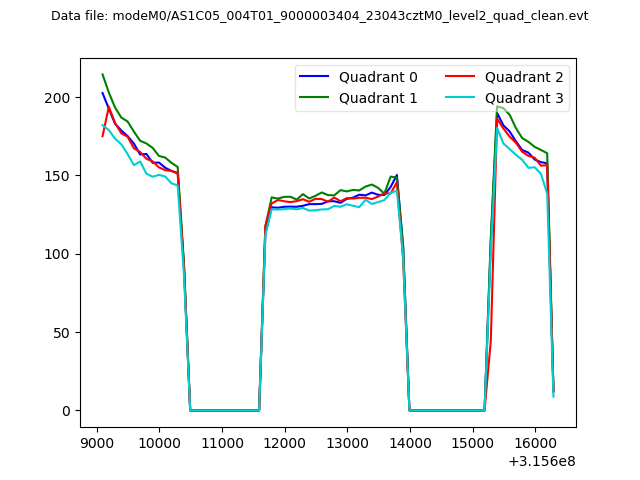 |
|
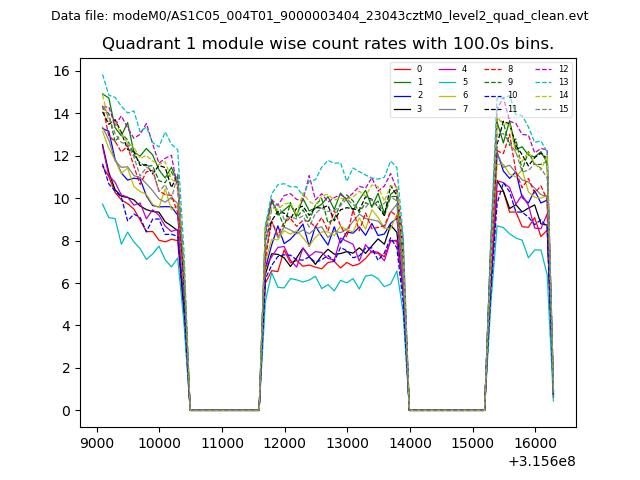
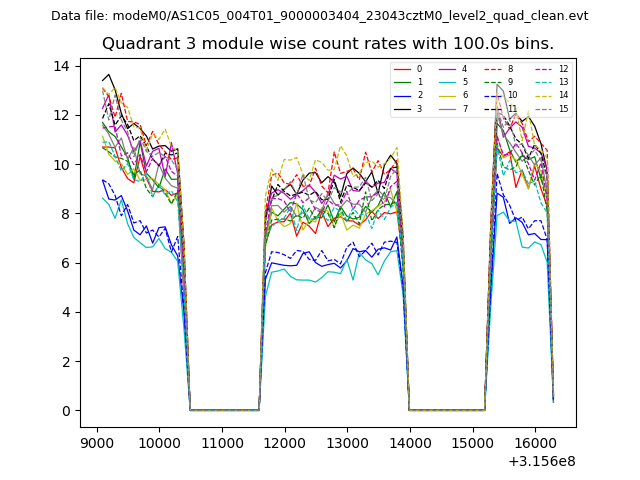
| Module-wise count rates for Quadrant A Data is divided into 100 sec bins |
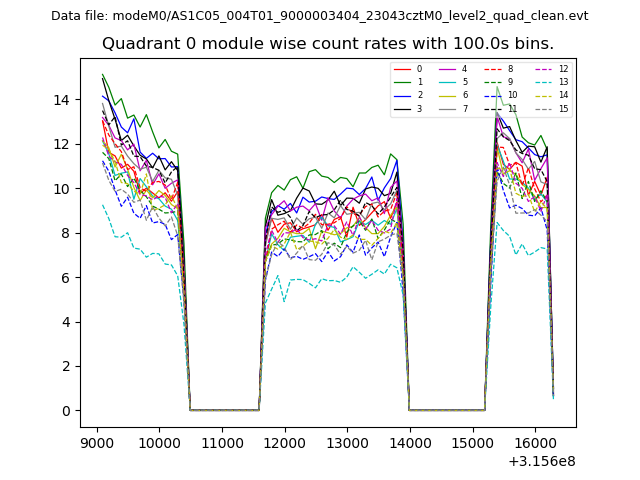 |
 |
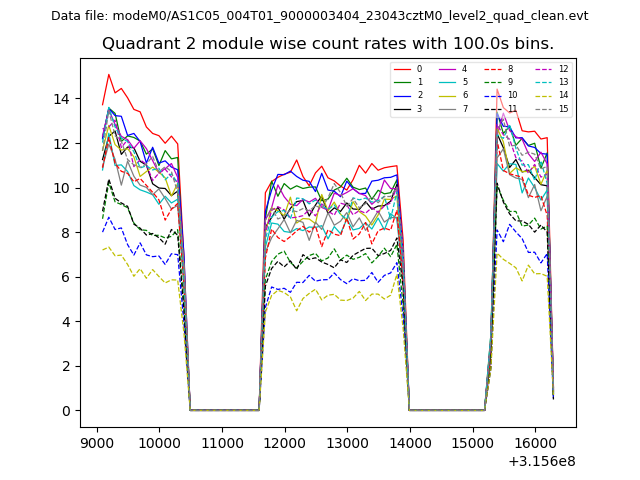
| Module-wise count rates for Quadrant B Data is divided into 100 sec bins |
 |
 |
| Module-wise count rates for Quadrant C Data is divided into 100 sec bins |
 |
 |
| Module-wise count rates for Quadrant D Data is divided into 100 sec bins |
 |
 |
| Parameter | Plot |
|---|---|
| CZT HV Monitor | 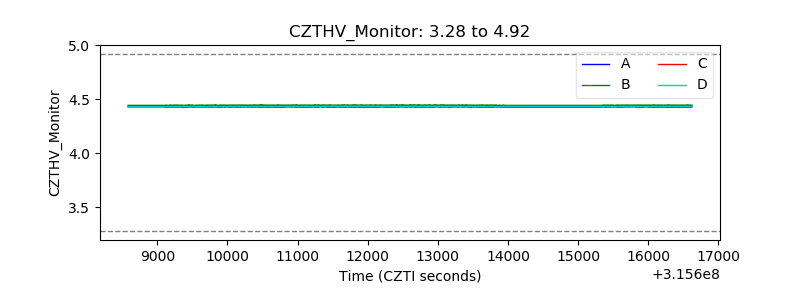 |
| D_VDD | 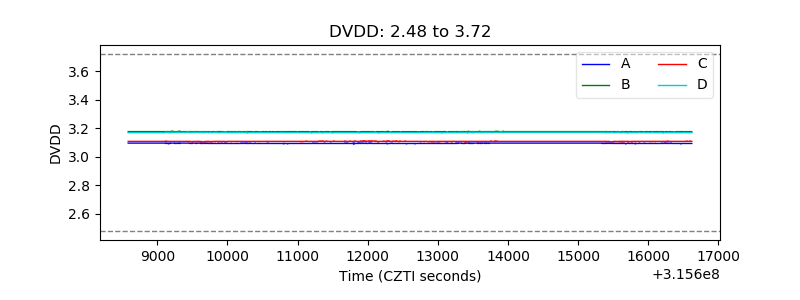 |
| Temperature 1 |  |
| Veto HV Monitor |  |
| Veto LLD | 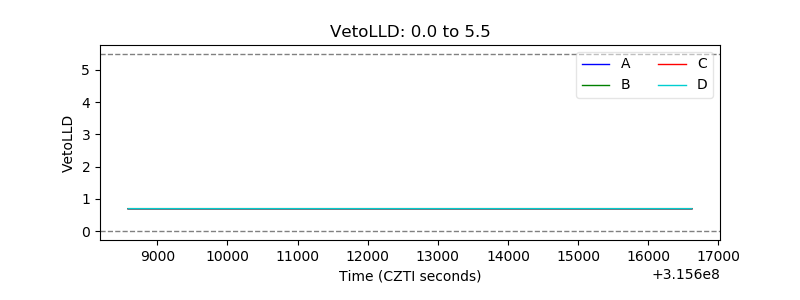 |
| Alpha Counter | 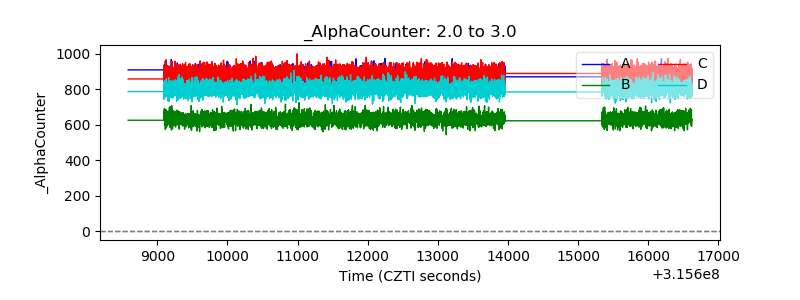 |
| _CPM_Rate | 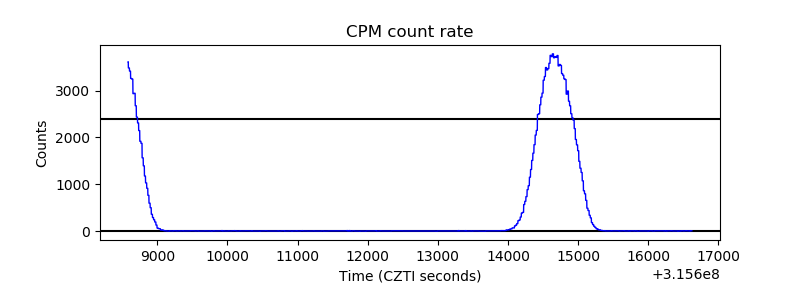 |
| CZT Counter | 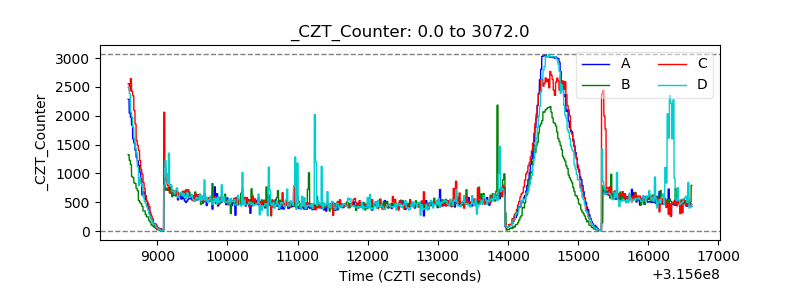 |
| +2.5 Volts monitor |  |
| +5 Volts monitor | 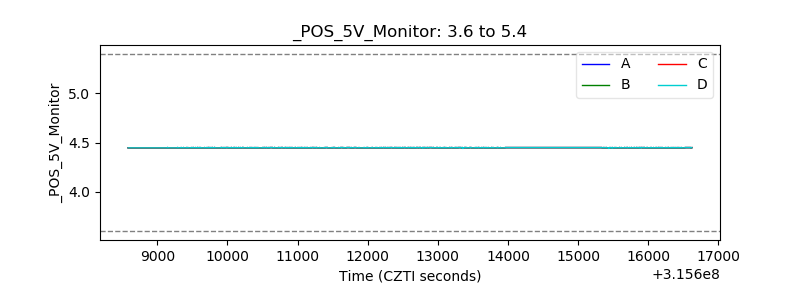 |
| _ROLL_ROT | 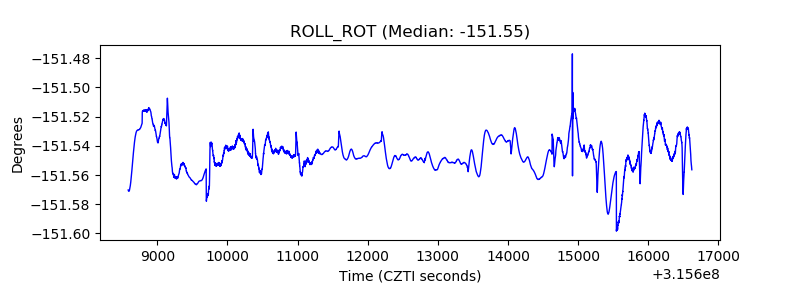 |
| _Roll_DEC | 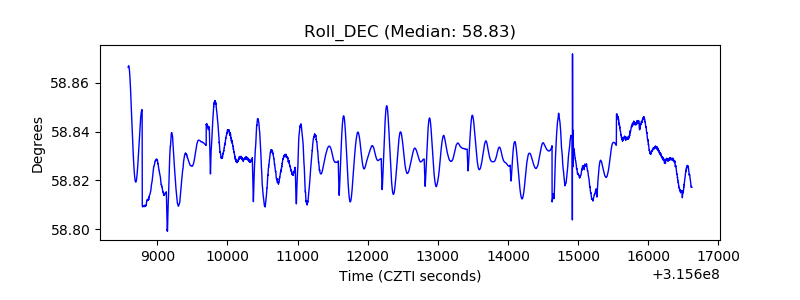 |
| _Roll_RA | 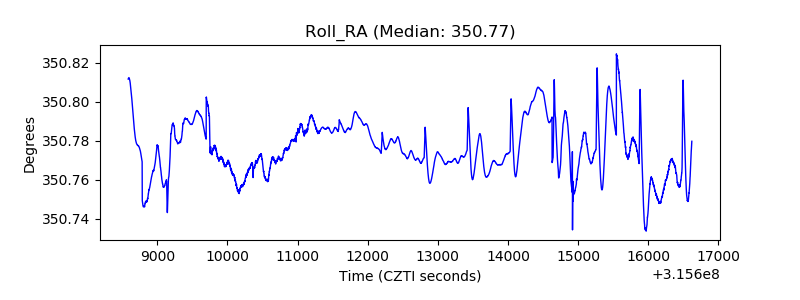 |
| Veto Counter | 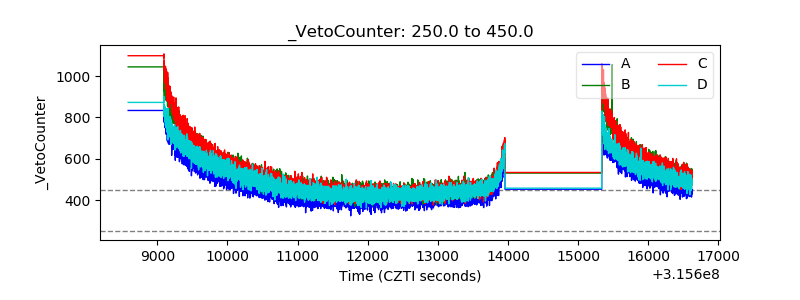 |