| Param | Original file | Final file |
|---|---|---|
| Filename | modeM0/AS1C05_004T01_9000003404_23044cztM0_level2.evt | modeM0/AS1C05_004T01_9000003404_23044cztM0_level2_quad_clean.evt |
| Size (bytes) | 351,915,840 | 79,908,480 |
| Size | 335.6 MB | 76.2 MB |
| Events in quadrant A | 2,361,483 | 525,950 |
| Events in quadrant B | 2,530,110 | 540,608 |
| Events in quadrant C | 2,523,469 | 513,893 |
| Events in quadrant D | 2,912,195 | 498,797 |
| Mode M0 | |||
|---|---|---|---|
| Quadrant | BADHDUFLAG | Total packets | Discarded packets |
| A | 0 | 10169 | 1 |
| B | 0 | 10586 | 1 |
| C | 0 | 10543 | 1 |
| D | 0 | 12023 | 1 |
| Mode SS | |||
|---|---|---|---|
| Quadrant | BADHDUFLAG | Total packets | Discarded packets |
| A | 0 | 100 | 0 |
| B | 0 | 100 | 0 |
| C | 0 | 100 | 0 |
| D | 0 | 100 | 0 |
| Mode M9 | |||
|---|---|---|---|
| Quadrant | BADHDUFLAG | Total packets | Discarded packets |
| A | 0 | 11 | 0 |
| B | 0 | 12 | 0 |
| C | 0 | 12 | 0 |
| D | 0 | 12 | 0 |
| Quadrant | Total seconds | Saturated seconds | Saturation percentage |
|---|---|---|---|
| A | 4850 | 30 | 0.618557% |
| B | 4850 | 68 | 1.402062% |
| C | 4850 | 118 | 2.432990% |
| D | 4850 | 140 | 2.886598% |
Noise dominated data is calculated using 1-second bins in cleaned event files. If a bin has >2000 counts, and if more than 50% of those come from <1% of pixels, then it is considered to be noise-dominated and hence unusable.
| Quadrant | # 1 sec bins | Bins with >0 counts | Bins with >2000 counts | High rate bins dominated by noise | Noise dominated (total time) | Noise dominated (detector-on time) | Marked lightcurve |
|---|---|---|---|---|---|---|---|
| A | 4850 | 4850 | 0 | 0 | 0.00% | 0.00% | 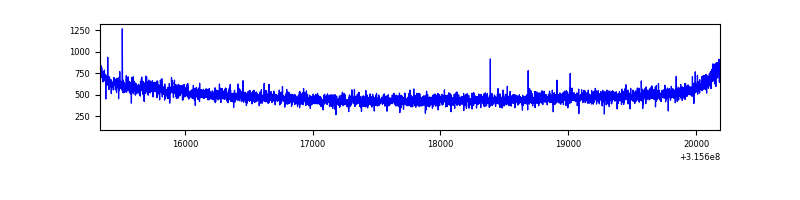 |
| B | 4850 | 4850 | 18 | 18 | 0.37% | 0.37% | 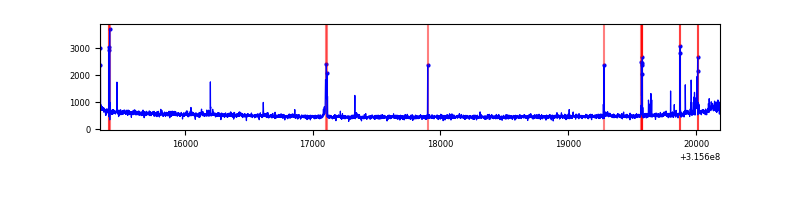 |
| C | 4850 | 4850 | 38 | 38 | 0.78% | 0.78% | 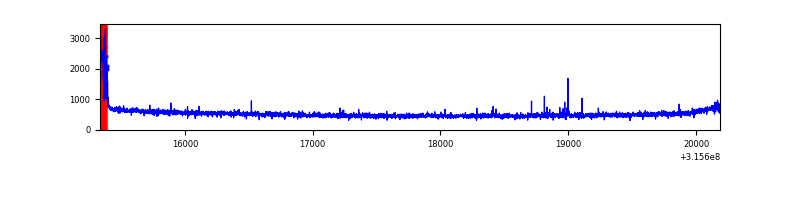 |
| D | 4850 | 4850 | 66 | 66 | 1.36% | 1.36% | 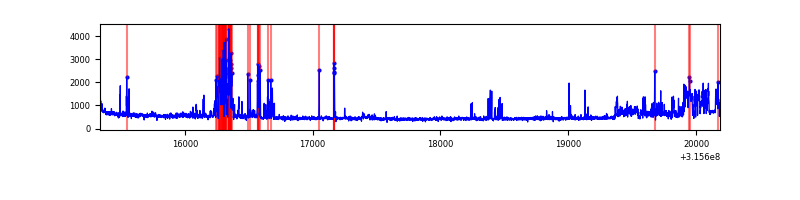 |
Top three noisy pixels from each quadrant. If the there are fewer than three noisy pixels in the level2.evt file, extra rows are filled as -1
| Pixel properties | Quadrant properties | ||||||
|---|---|---|---|---|---|---|---|
| Quadrant | DetID | PixID | Counts | Sigma | Mean | Median | Sigma |
| A | 6 | 16 | 16628 | 132.97 | 608 | 598 | 120.6 |
| A | 13 | 254 | 7663 | 58.61 | 608 | 598 | 120.6 |
| A | 0 | 226 | 5156 | 37.81 | 608 | 598 | 120.6 |
| B | 4 | 216 | 51904 | 454.45 | 610 | 595 | 112.9 |
| B | 0 | 190 | 30373 | 263.75 | 610 | 595 | 112.9 |
| B | 4 | 173 | 27443 | 237.8 | 610 | 595 | 112.9 |
| C | 0 | 10 | 110996 | 807.11 | 589 | 593 | 136.8 |
| C | 14 | 238 | 94312 | 685.14 | 589 | 593 | 136.8 |
| C | 0 | 207 | 17034 | 120.19 | 589 | 593 | 136.8 |
| D | 1 | 52 | 366552 | 2597.84 | 588 | 572 | 140.9 |
| D | 13 | 153 | 286081 | 2026.63 | 588 | 572 | 140.9 |
| D | 2 | 234 | 17613 | 120.96 | 588 | 572 | 140.9 |
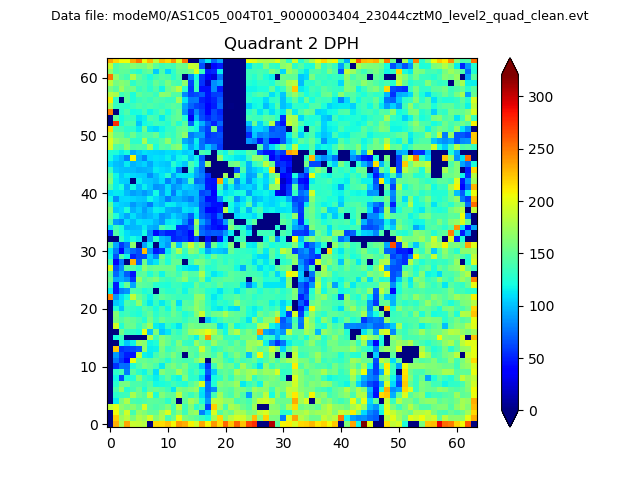
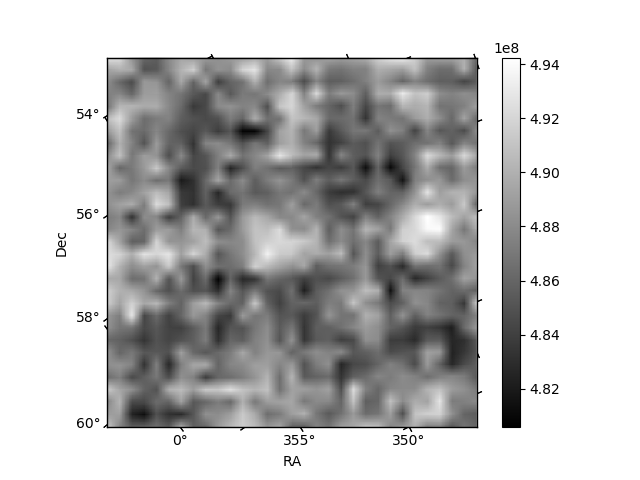
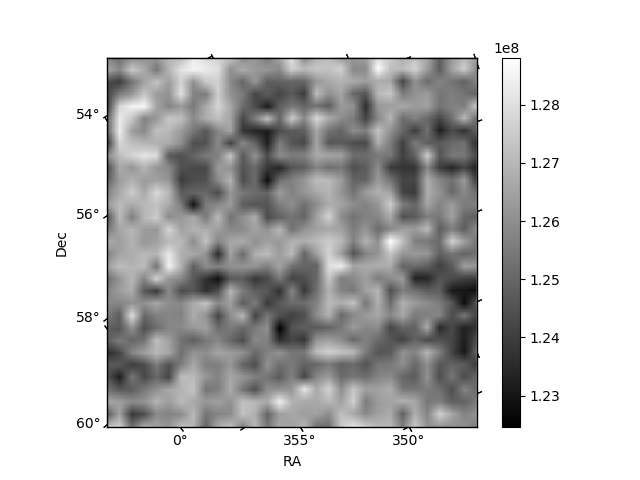
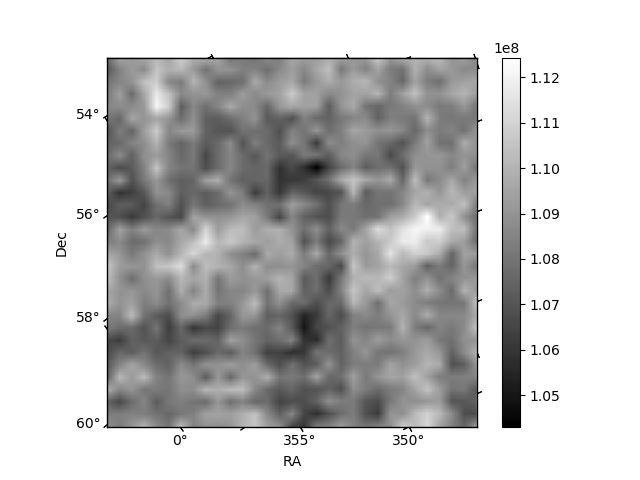
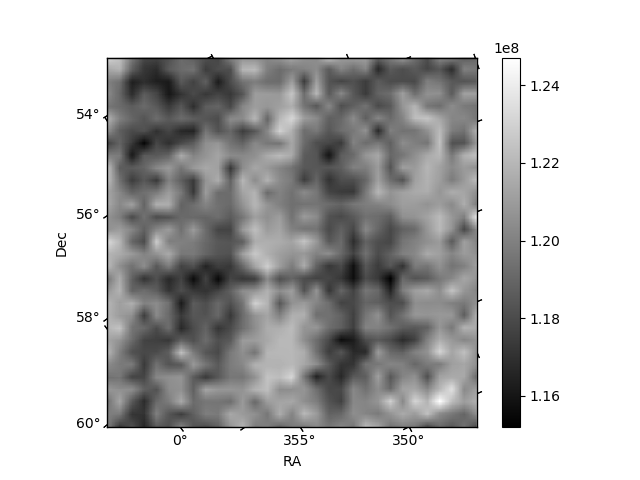
Histogram calculated using DETX and DETY for each event in the final _common_clean file
| Quadrant A | 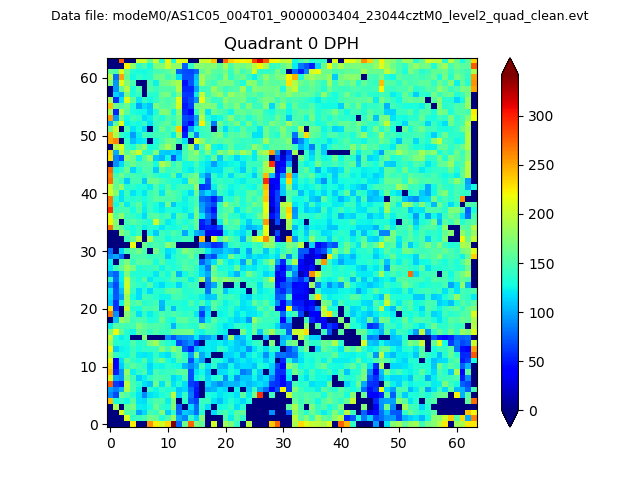 |
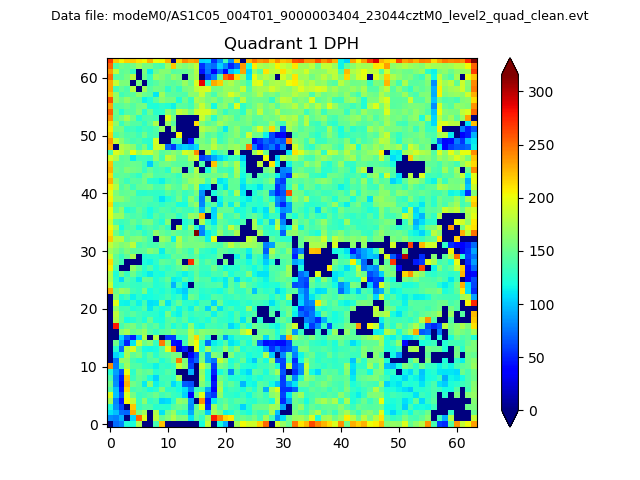 |
Quadrant B |
|---|---|---|---|
| Quadrant D | 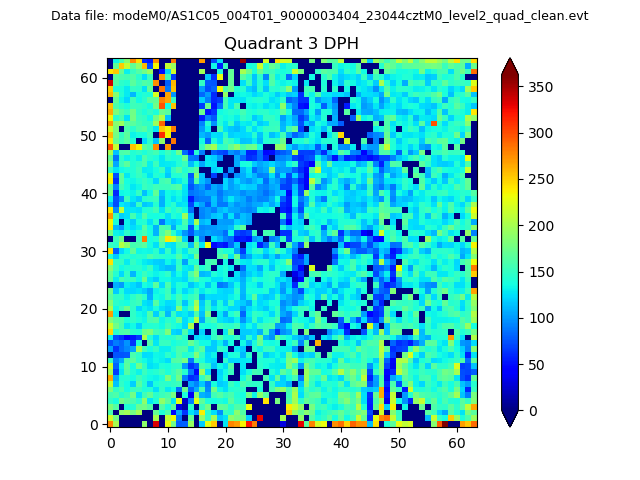 |
 |
Quadrant C |
| Plot type | Count rate plots | Images |
|---|---|---|
| Comparison with Poisson distribution Blue bars denote a histogram of data divided into 1 sec bins. Red curve is a Poisson curve with rate = median count rate of data. |
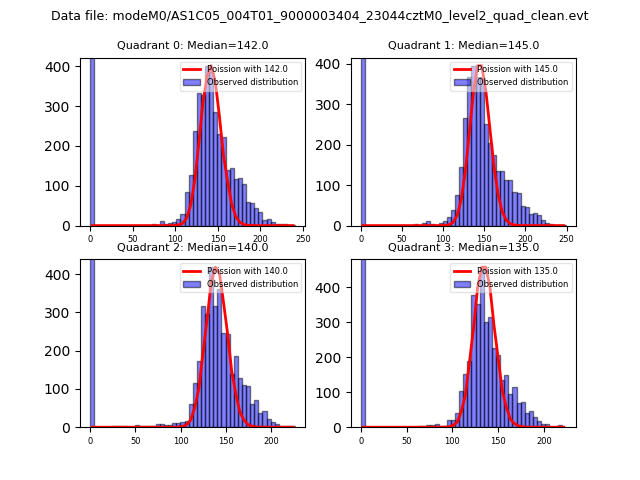 |
 |
| Quadrant-wise count rates Data is divided into 100 sec bins |
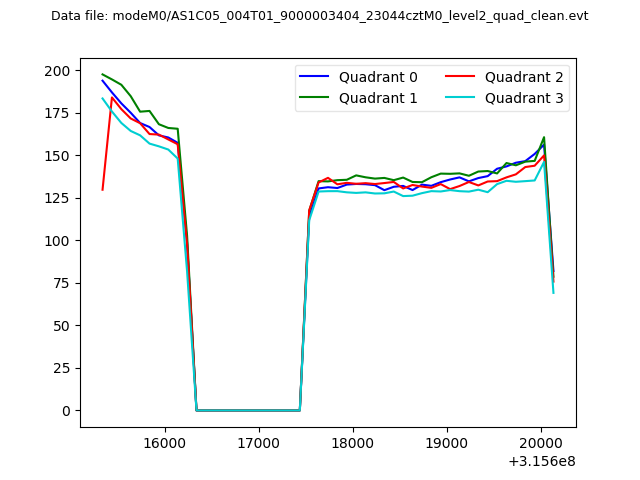 |
|
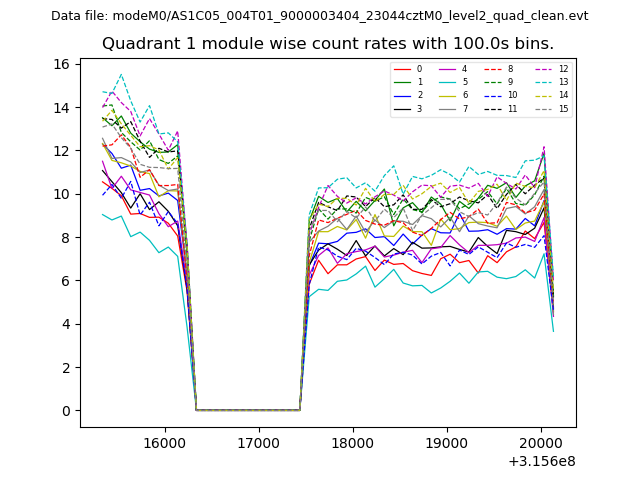
| Module-wise count rates for Quadrant A Data is divided into 100 sec bins |
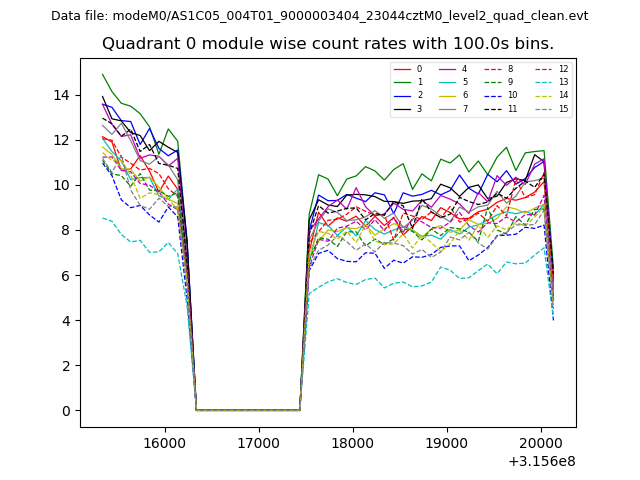 |
 |
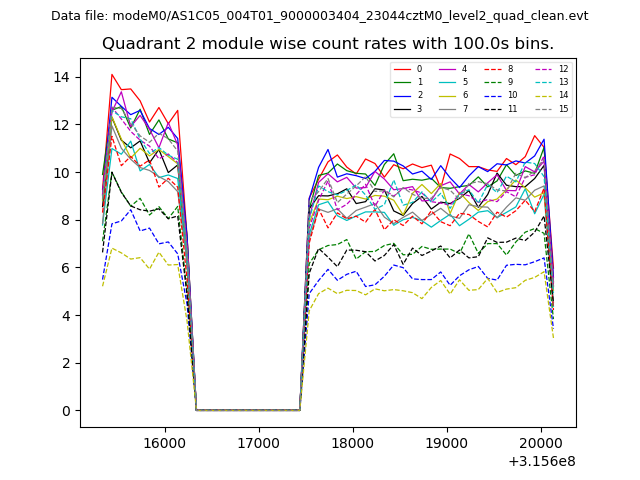
| Module-wise count rates for Quadrant B Data is divided into 100 sec bins |
 |
 |
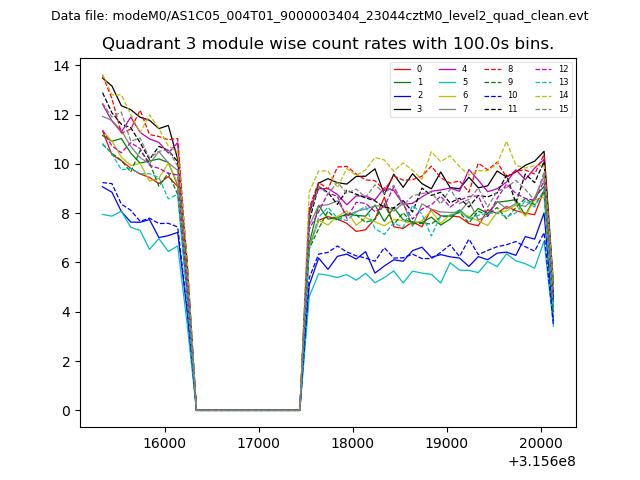
| Module-wise count rates for Quadrant C Data is divided into 100 sec bins |
 |
 |
| Module-wise count rates for Quadrant D Data is divided into 100 sec bins |
 |
 |
| Parameter | Plot |
|---|---|
| CZT HV Monitor | 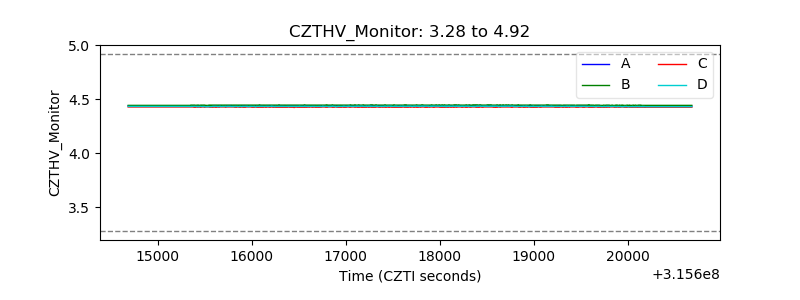 |
| D_VDD | 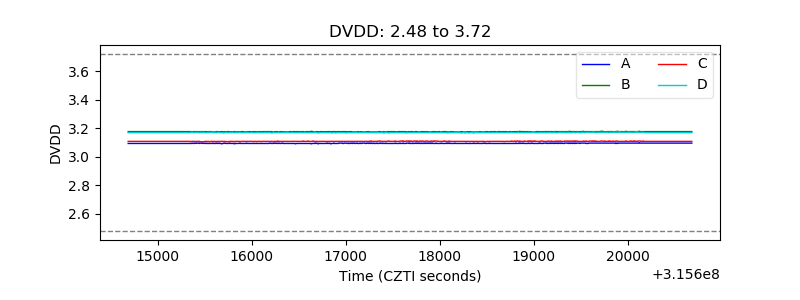 |
| Temperature 1 |  |
| Veto HV Monitor | 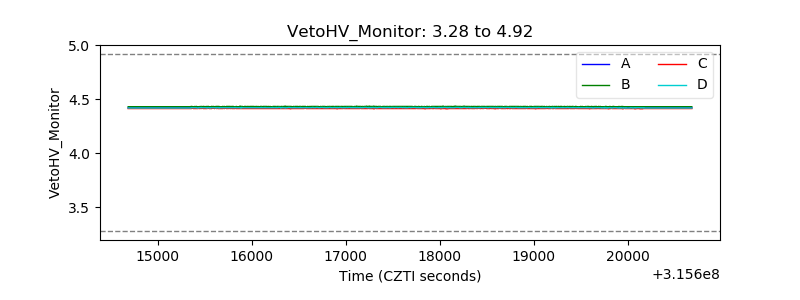 |
| Veto LLD | 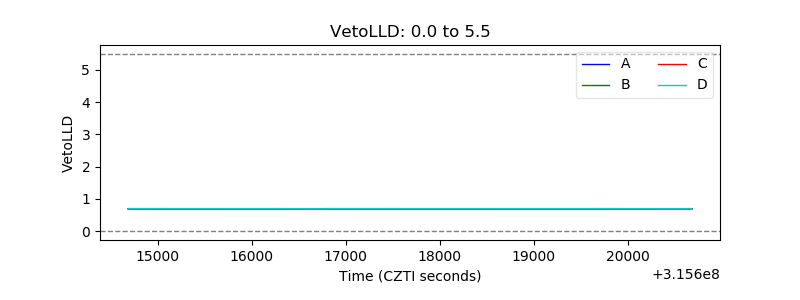 |
| Alpha Counter | 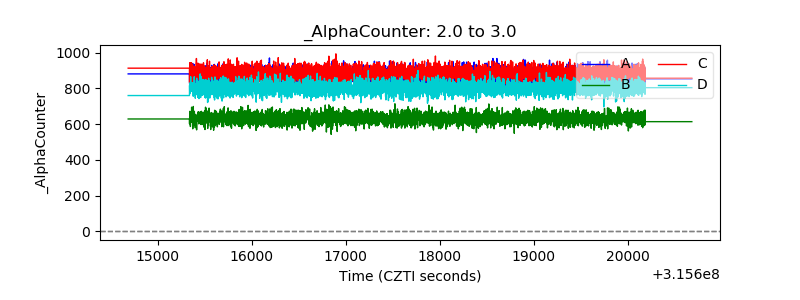 |
| _CPM_Rate | 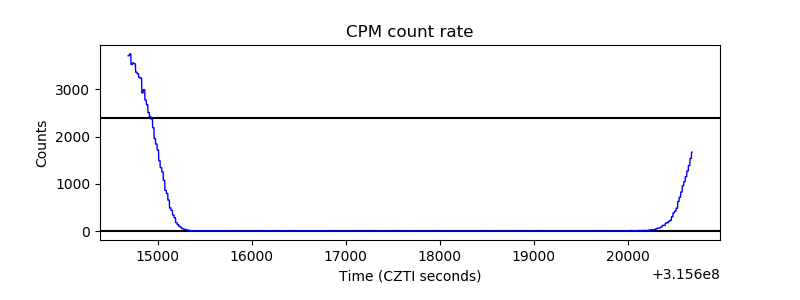 |
| CZT Counter | 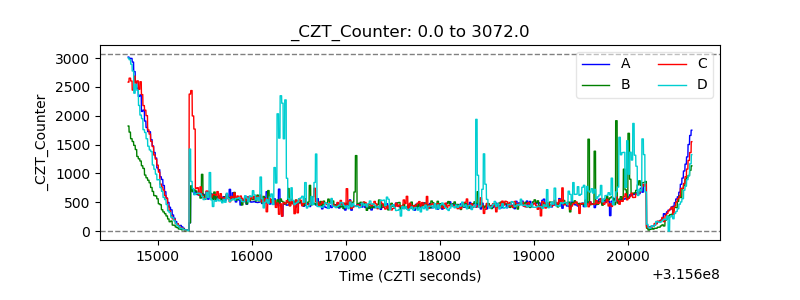 |
| +2.5 Volts monitor |  |
| +5 Volts monitor | 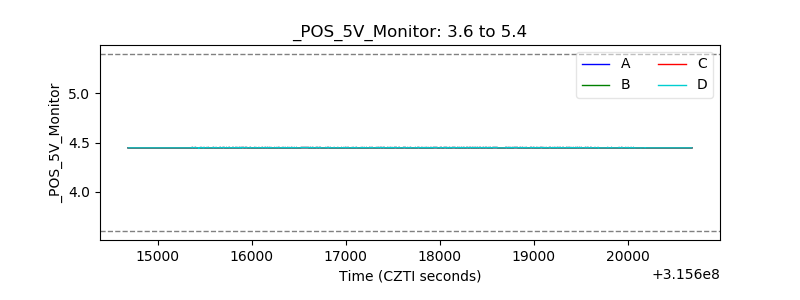 |
| _ROLL_ROT | 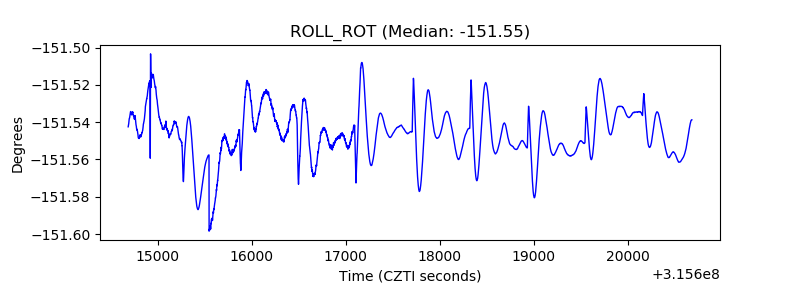 |
| _Roll_DEC | 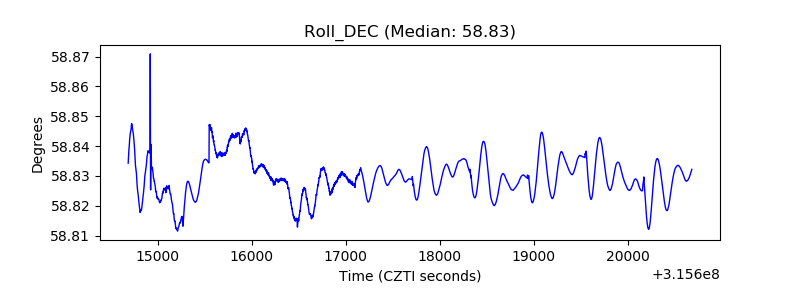 |
| _Roll_RA | 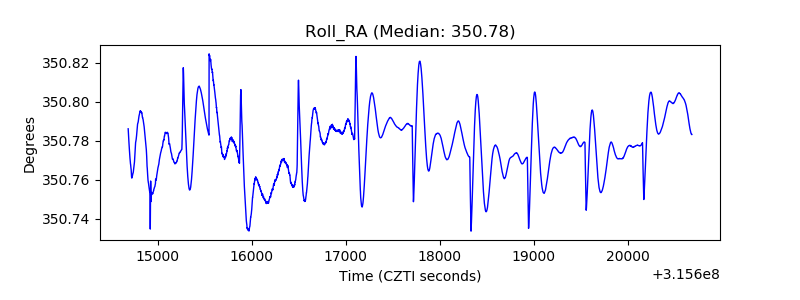 |
| Veto Counter | 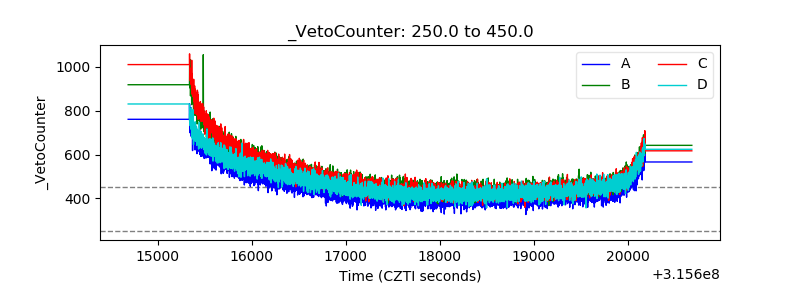 |