| Param | Original file | Final file |
|---|---|---|
| Filename | modeM0/AS1A07_049T01_9000003408cztM0_level2.fits | modeM0/AS1A07_049T01_9000003408cztM0_level2_quad_clean.evt |
| Size (bytes) | 2,062,235,520 | 1,808,991,360 |
| Size | 1.9 GB | 1.7 GB |
| Events in quadrant A | 12,256,018 | 9,881,565 |
| Events in quadrant B | 12,354,748 | 10,908,192 |
| Events in quadrant C | 12,524,934 | 10,407,077 |
| Events in quadrant D | 10,745,912 | 9,028,216 |
| Mode M0 | |||
|---|---|---|---|
| Quadrant | BADHDUFLAG | Total packets | Discarded packets |
| A | 0 | 566529 | 0 |
| B | 0 | 462969 | 0 |
| C | 0 | 465734 | 0 |
| D | 0 | 592512 | 0 |
| Mode M9 | |||
|---|---|---|---|
| Quadrant | BADHDUFLAG | Total packets | Discarded packets |
| A | 0 | 336 | 0 |
| B | 0 | 336 | 0 |
| C | 0 | 336 | 0 |
| D | 0 | 336 | 0 |
| Mode SS | |||
|---|---|---|---|
| Quadrant | BADHDUFLAG | Total packets | Discarded packets |
| A | 0 | 4324 | 0 |
| B | 0 | 4324 | 0 |
| C | 0 | 4324 | 0 |
| D | 0 | 4324 | 0 |
| Quadrant | Total seconds | Saturated seconds | Saturation percentage |
|---|---|---|---|
| A | 212558 | 17781 | 8.365246% |
| B | 212558 | 5255 | 2.472266% |
| C | 212558 | 5340 | 2.512255% |
| D | 212558 | 14852 | 6.987269% |
Noise dominated data is calculated using 1-second bins in cleaned event files. If a bin has >2000 counts, and if more than 50% of those come from <1% of pixels, then it is considered to be noise-dominated and hence unusable.
| Quadrant | # 1 sec bins | Bins with >0 counts | Bins with >2000 counts | High rate bins dominated by noise | Noise dominated (total time) | Noise dominated (detector-on time) | Marked lightcurve |
|---|---|---|---|---|---|---|---|
| A | 245422 | 211803 | 0 | 0 | 0.00% | 0.00% |  |
| B | 245422 | 212461 | 0 | 0 | 0.00% | 0.00% |  |
| C | 245422 | 212539 | 0 | 0 | 0.00% | 0.00% |  |
| D | 245422 | 212488 | 0 | 0 | 0.00% | 0.00% |  |
Top three noisy pixels from each quadrant. If the there are fewer than three noisy pixels in the level2.evt file, extra rows are filled as -1
| Pixel properties | Quadrant properties | ||||||
|---|---|---|---|---|---|---|---|
| Quadrant | DetID | PixID | Counts | Sigma | Mean | Median | Sigma |
| A | 0 | 29 | 11596 | 10.98 | 3188 | 2989 | 783.6 |
| A | 7 | 110 | 9765 | 8.65 | 3188 | 2989 | 783.6 |
| A | 9 | 19 | 9096 | 7.79 | 3188 | 2989 | 783.6 |
| B | 2 | 9 | 9920 | 10.79 | 3269 | 3121 | 629.9 |
| B | 2 | 8 | 8464 | 8.48 | 3269 | 3121 | 629.9 |
| B | 5 | 225 | 8032 | 7.8 | 3269 | 3121 | 629.9 |
| C | 12 | 241 | 8657 | 6.65 | 3316 | 3108 | 833.9 |
| C | 2 | 191 | 8453 | 6.41 | 3316 | 3108 | 833.9 |
| C | 3 | 126 | 8391 | 6.33 | 3316 | 3108 | 833.9 |
| D | 13 | 238 | 7773 | 6.16 | 3073 | 2804 | 807.0 |
| D | 6 | 231 | 7620 | 5.97 | 3073 | 2804 | 807.0 |
| D | 15 | 46 | 7555 | 5.89 | 3073 | 2804 | 807.0 |
Histogram calculated using DETX and DETY for each event in the final _common_clean file
| Quadrant A | 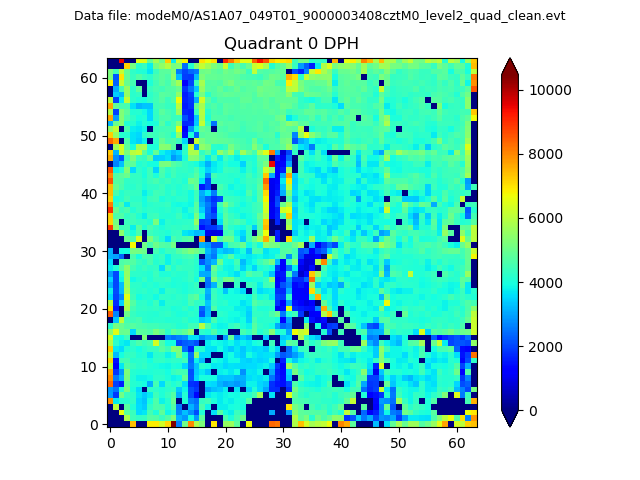 |
 |
Quadrant B |
|---|---|---|---|
| Quadrant D |  |
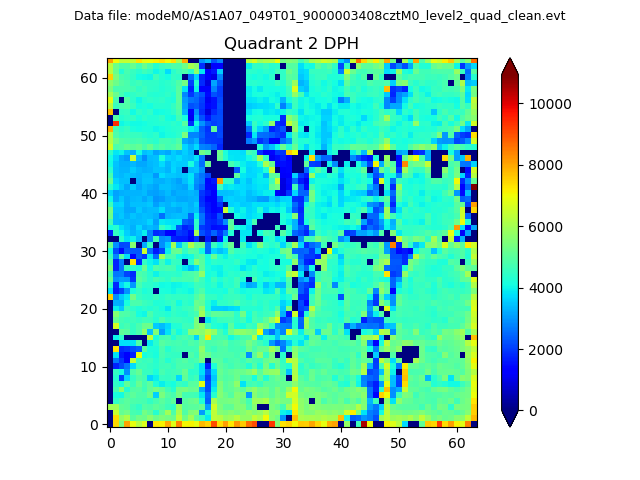 |
Quadrant C |
| Plot type | Count rate plots | Images |
|---|---|---|
| Comparison with Poisson distribution Blue bars denote a histogram of data divided into 1 sec bins. Red curve is a Poisson curve with rate = median count rate of data. |
 |
 |
| Quadrant-wise count rates Data is divided into 100 sec bins |
 |
|
| Module-wise count rates for Quadrant A Data is divided into 100 sec bins |
 |
 |
| Module-wise count rates for Quadrant B Data is divided into 100 sec bins |
 |
 |
| Module-wise count rates for Quadrant C Data is divided into 100 sec bins |
 |
 |
| Module-wise count rates for Quadrant D Data is divided into 100 sec bins |
 |
 |
| Parameter | Plot |
|---|---|
| CZT HV Monitor |  |
| D_VDD | 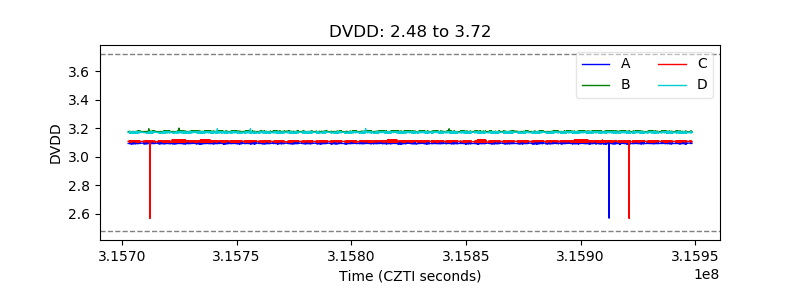 |
| Temperature 1 |  |
| Veto HV Monitor |  |
| Veto LLD |  |
| Alpha Counter |  |
| _CPM_Rate |  |
| CZT Counter |  |
| +2.5 Volts monitor |  |
| +5 Volts monitor |  |
| _ROLL_ROT |  |
| _Roll_DEC |  |
| _Roll_RA | 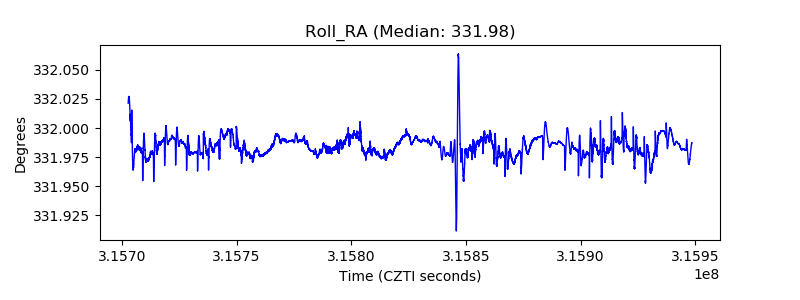 |
| Veto Counter |  |