| Param | Original file | Final file |
|---|---|---|
| Filename | modeM0/AS1A07_049T01_9000003408_23058cztM0_level2.evt | modeM0/AS1A07_049T01_9000003408_23058cztM0_level2_quad_clean.evt |
| Size (bytes) | 132,451,200 | 7,770,240 |
| Size | 126.3 MB | 7.4 MB |
| Events in quadrant A | 835,385 | 31,411 |
| Events in quadrant B | 1,014,804 | 31,126 |
| Events in quadrant C | 912,648 | 29,704 |
| Events in quadrant D | 1,141,942 | 28,955 |
| Mode M0 | |||
|---|---|---|---|
| Quadrant | BADHDUFLAG | Total packets | Discarded packets |
| A | 0 | 3363 | 1 |
| B | 0 | 3928 | 1 |
| C | 0 | 3651 | 1 |
| D | 0 | 4435 | 1 |
| Mode M9 | |||
|---|---|---|---|
| Quadrant | BADHDUFLAG | Total packets | Discarded packets |
| A | 0 | 6 | 0 |
| B | 0 | 6 | 0 |
| C | 0 | 6 | 0 |
| D | 0 | 6 | 0 |
| Mode SS | |||
|---|---|---|---|
| Quadrant | BADHDUFLAG | Total packets | Discarded packets |
| A | 0 | 30 | 0 |
| B | 0 | 30 | 0 |
| C | 0 | 30 | 0 |
| D | 0 | 30 | 0 |
| Quadrant | Total seconds | Saturated seconds | Saturation percentage |
|---|---|---|---|
| A | 1533 | 4 | 0.260926% |
| B | 1533 | 67 | 4.370515% |
| C | 1533 | 36 | 2.348337% |
| D | 1533 | 22 | 1.435095% |
Noise dominated data is calculated using 1-second bins in cleaned event files. If a bin has >2000 counts, and if more than 50% of those come from <1% of pixels, then it is considered to be noise-dominated and hence unusable.
| Quadrant | # 1 sec bins | Bins with >0 counts | Bins with >2000 counts | High rate bins dominated by noise | Noise dominated (total time) | Noise dominated (detector-on time) | Marked lightcurve |
|---|---|---|---|---|---|---|---|
| A | 1533 | 1533 | 0 | 0 | 0.00% | 0.00% | 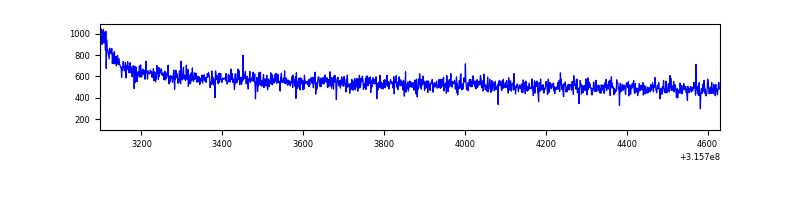 |
| B | 1533 | 1533 | 38 | 38 | 2.48% | 2.48% | 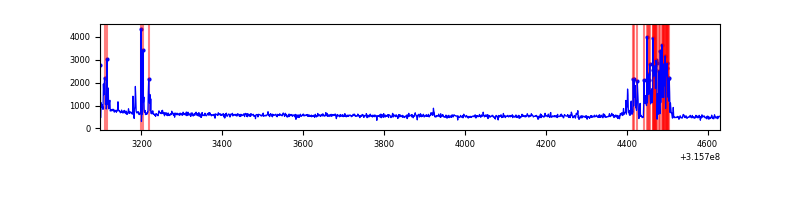 |
| C | 1533 | 1533 | 2 | 2 | 0.13% | 0.13% | 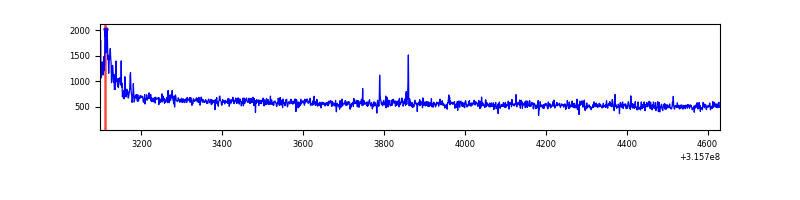 |
| D | 1533 | 1533 | 16 | 16 | 1.04% | 1.04% | 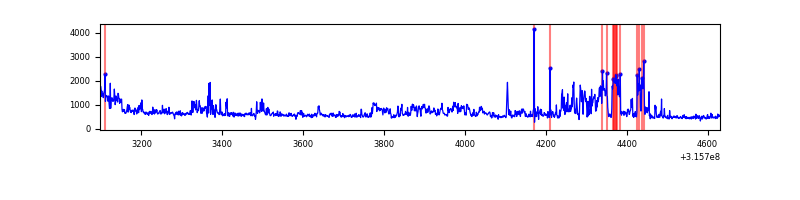 |
Top three noisy pixels from each quadrant. If the there are fewer than three noisy pixels in the level2.evt file, extra rows are filled as -1
| Pixel properties | Quadrant properties | ||||||
|---|---|---|---|---|---|---|---|
| Quadrant | DetID | PixID | Counts | Sigma | Mean | Median | Sigma |
| A | 13 | 254 | 2371 | 48.53 | 216 | 212 | 44.5 |
| A | 0 | 226 | 1899 | 37.92 | 216 | 212 | 44.5 |
| A | 3 | 137 | 1660 | 32.55 | 216 | 212 | 44.5 |
| B | 3 | 64 | 127921 | 2986.82 | 217 | 212 | 42.8 |
| B | 4 | 216 | 26690 | 619.26 | 217 | 212 | 42.8 |
| B | 5 | 172 | 8564 | 195.33 | 217 | 212 | 42.8 |
| C | 14 | 238 | 34865 | 676.43 | 214 | 216 | 51.2 |
| C | 0 | 10 | 30538 | 591.95 | 214 | 216 | 51.2 |
| C | 0 | 207 | 8563 | 162.95 | 214 | 216 | 51.2 |
| D | 1 | 52 | 290189 | 5436.21 | 212 | 207 | 53.3 |
| D | 13 | 153 | 28684 | 533.85 | 212 | 207 | 53.3 |
| D | 9 | 85 | 10822 | 199.0 | 212 | 207 | 53.3 |
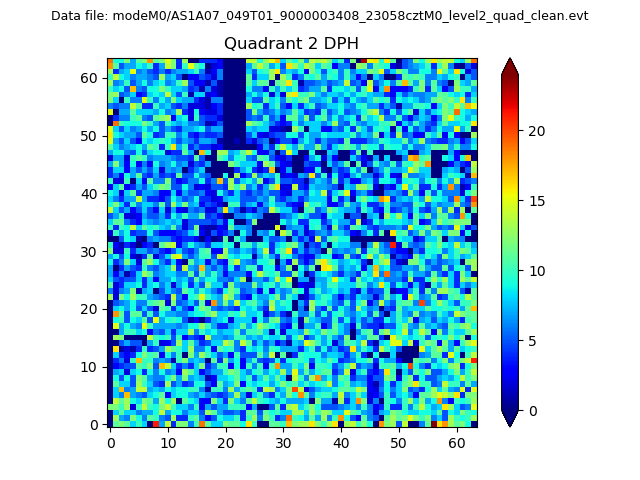
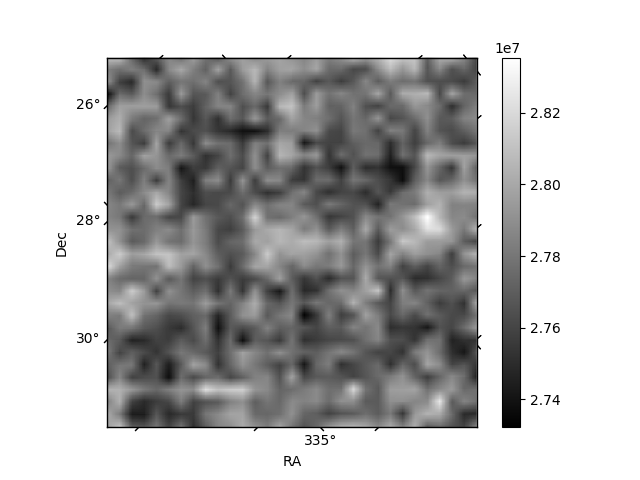
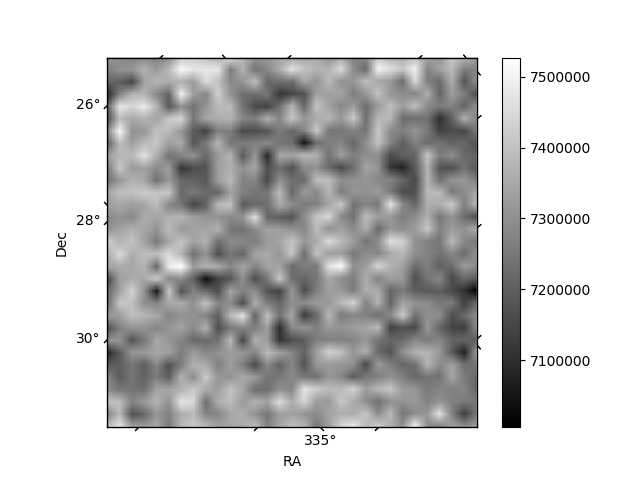
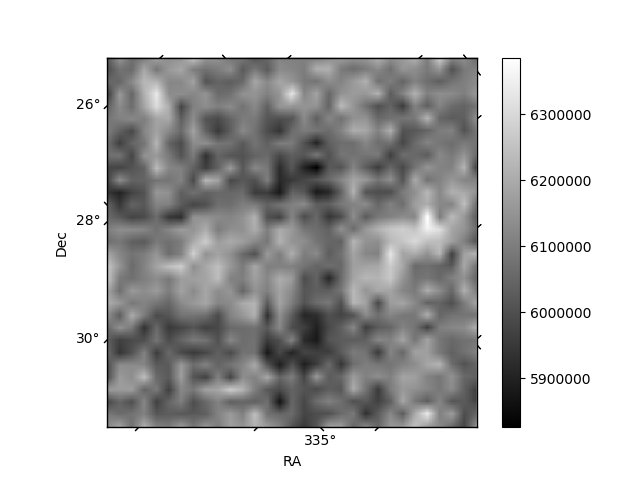
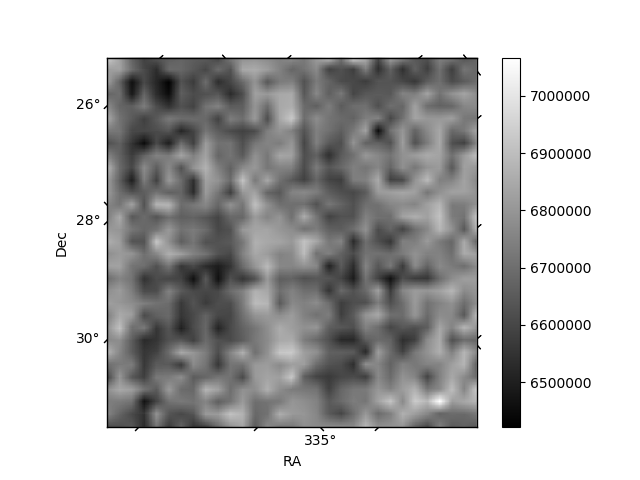
Histogram calculated using DETX and DETY for each event in the final _common_clean file
| Quadrant A | 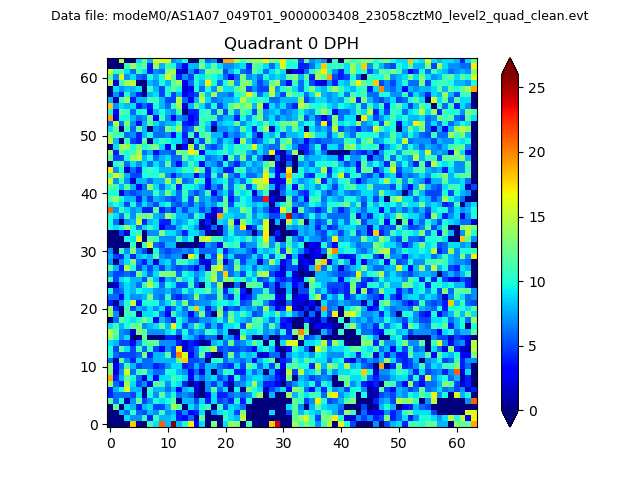 |
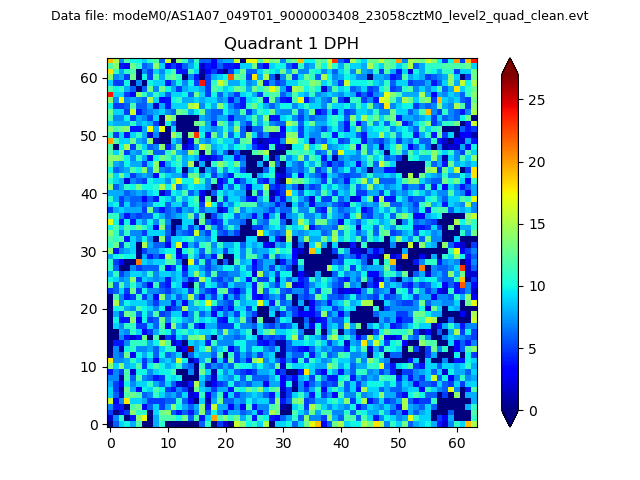 |
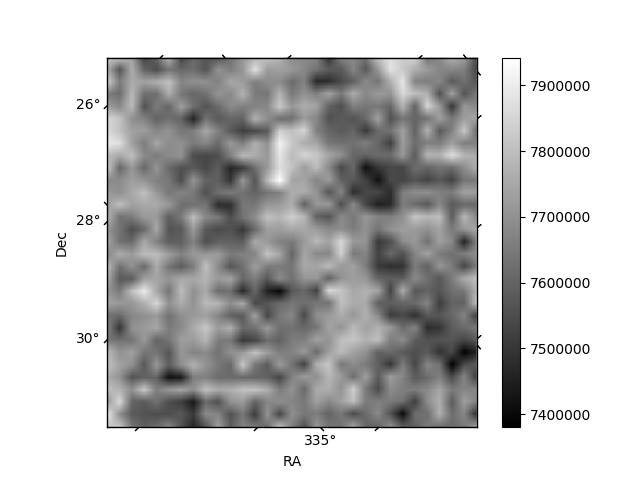
Quadrant B |
|---|---|---|---|
| Quadrant D | 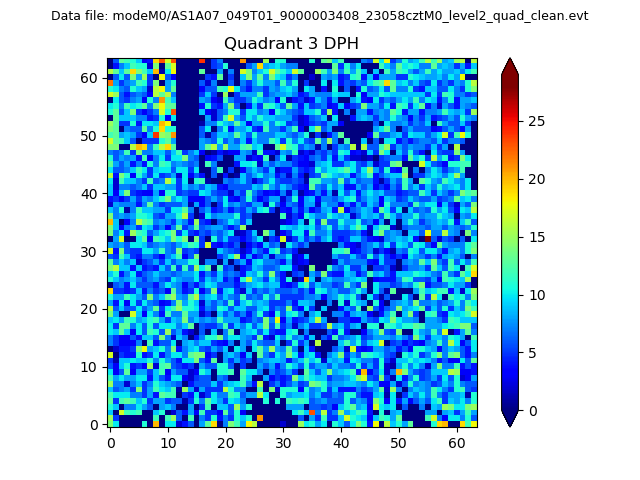 |
 |
Quadrant C |
| Plot type | Count rate plots | Images |
|---|---|---|
| Comparison with Poisson distribution Blue bars denote a histogram of data divided into 1 sec bins. Red curve is a Poisson curve with rate = median count rate of data. |
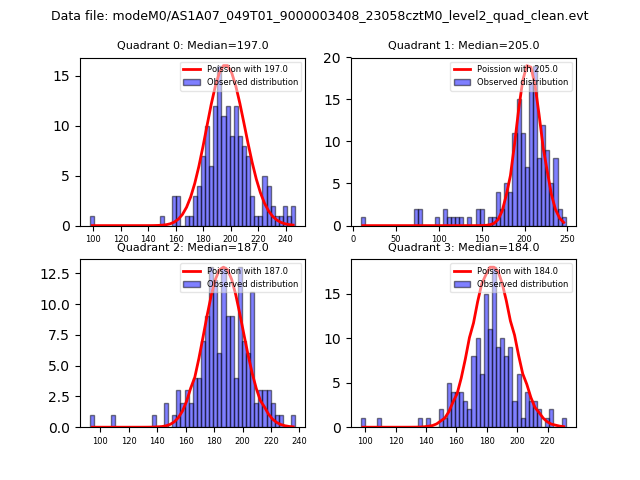 |
 |
| Quadrant-wise count rates Data is divided into 100 sec bins |
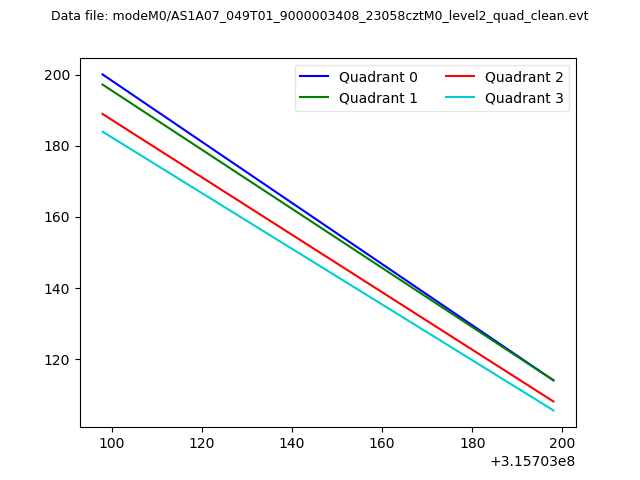 |
|
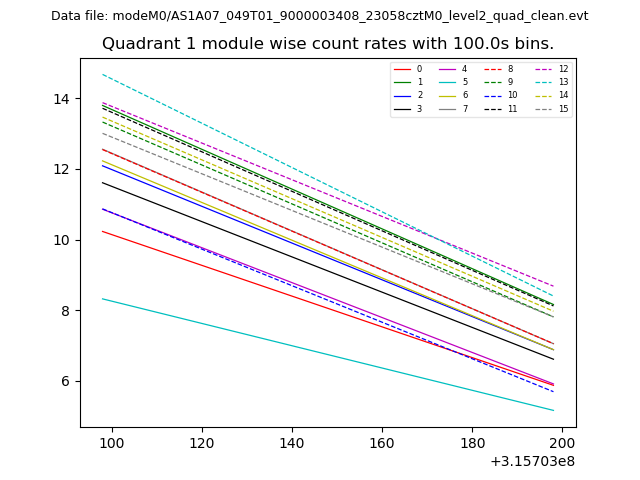
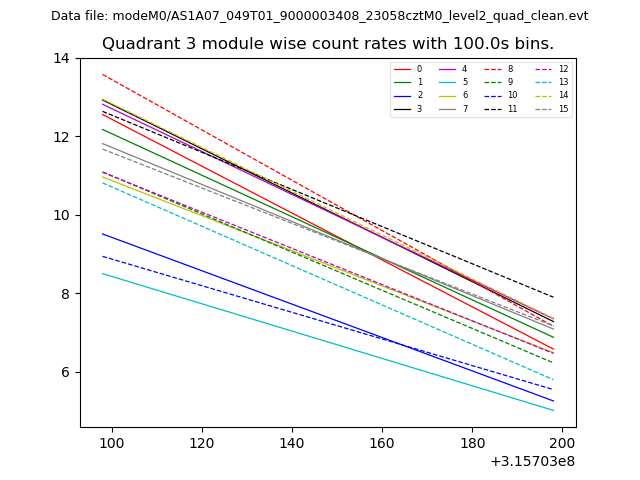
| Module-wise count rates for Quadrant A Data is divided into 100 sec bins |
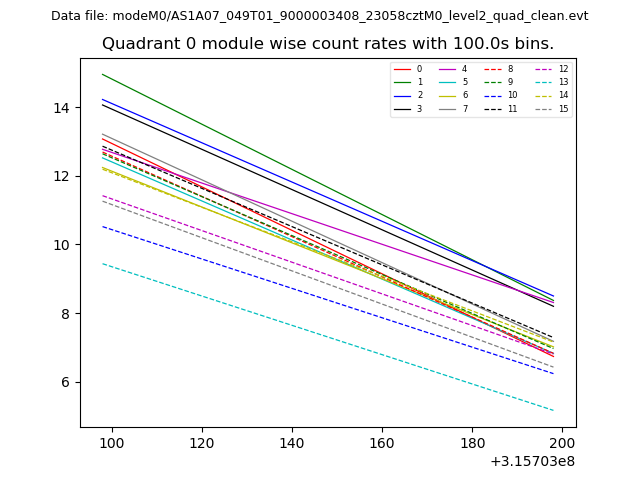 |
 |
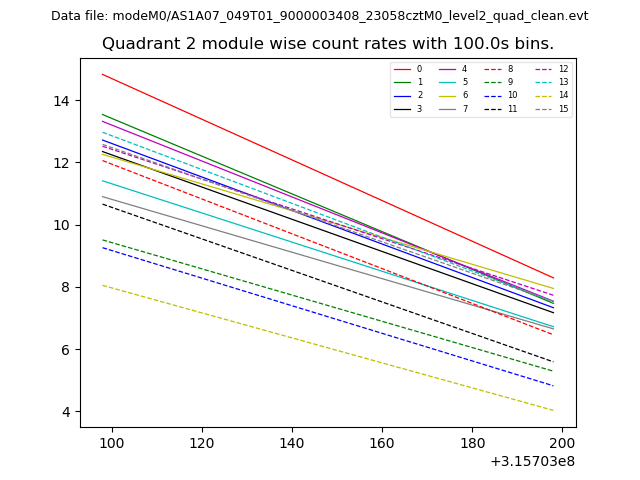
| Module-wise count rates for Quadrant B Data is divided into 100 sec bins |
 |
 |
| Module-wise count rates for Quadrant C Data is divided into 100 sec bins |
 |
 |
| Module-wise count rates for Quadrant D Data is divided into 100 sec bins |
 |
 |
| Parameter | Plot |
|---|---|
| CZT HV Monitor | 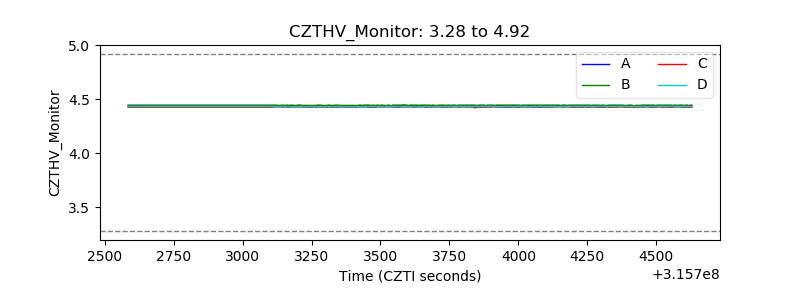 |
| D_VDD | 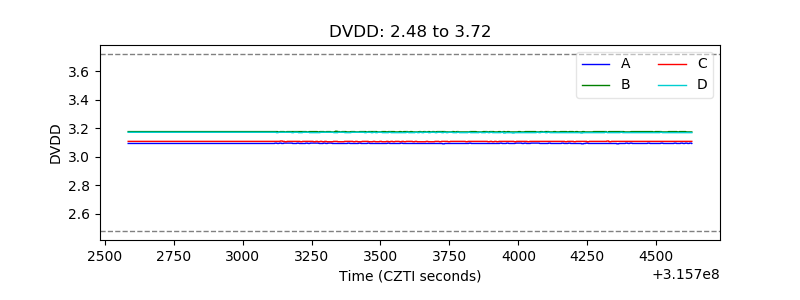 |
| Temperature 1 | 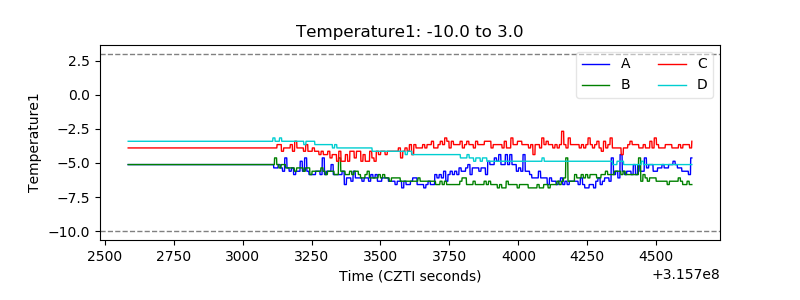 |
| Veto HV Monitor |  |
| Veto LLD | 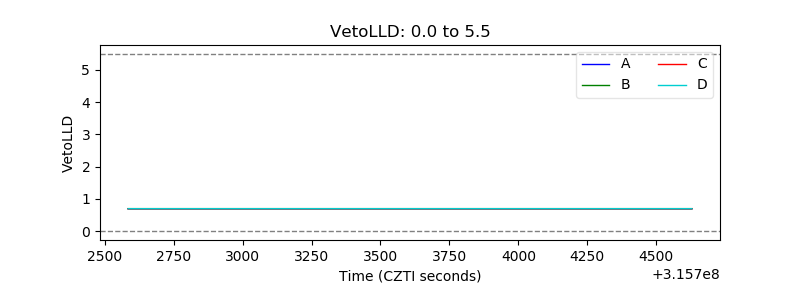 |
| Alpha Counter | 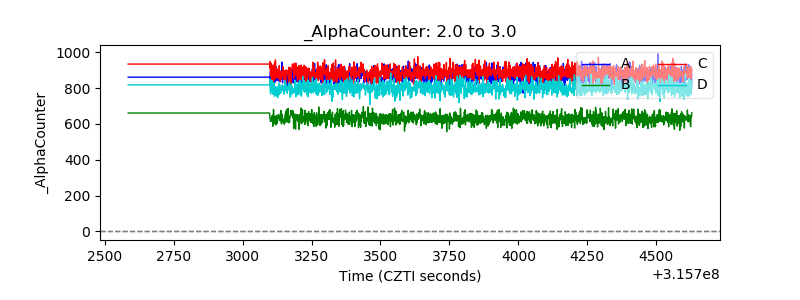 |
| _CPM_Rate | 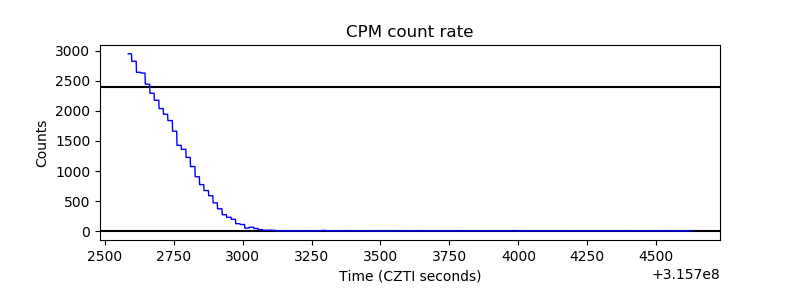 |
| CZT Counter | 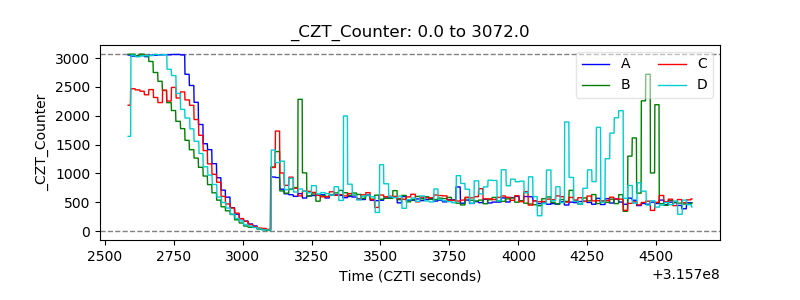 |
| +2.5 Volts monitor |  |
| +5 Volts monitor |  |
| _ROLL_ROT | 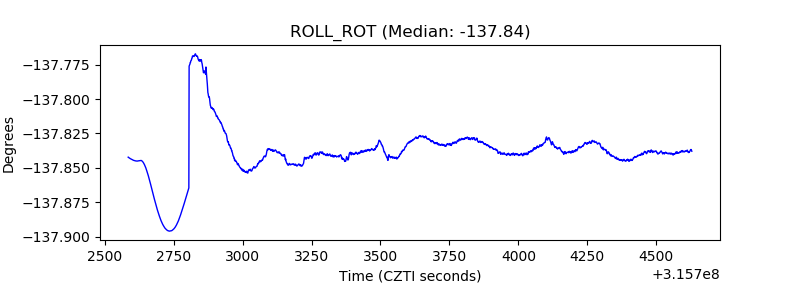 |
| _Roll_DEC | 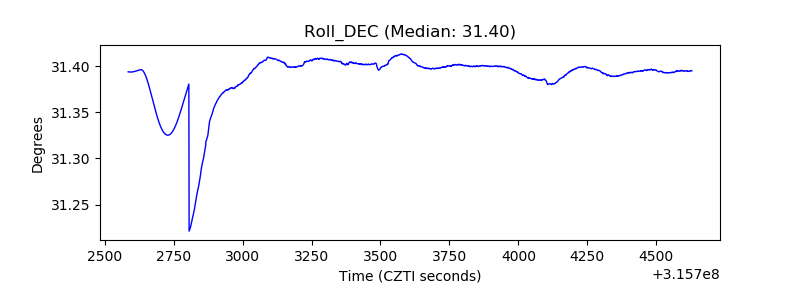 |
| _Roll_RA | 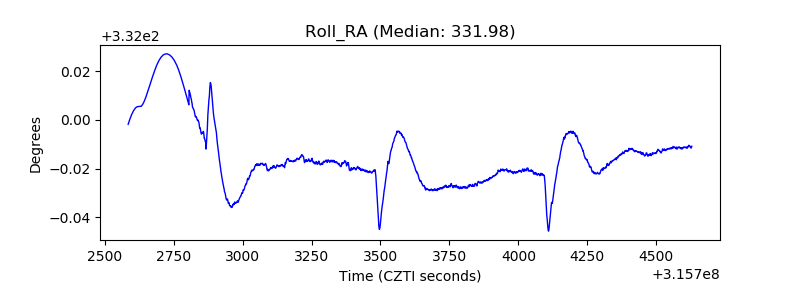 |
| Veto Counter | 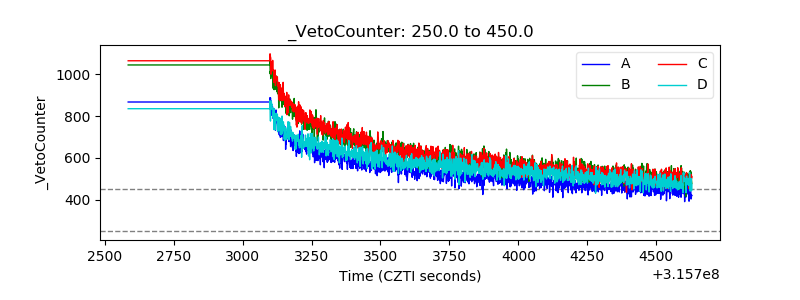 |