| Param | Original file | Final file |
|---|---|---|
| Filename | modeM0/AS1A07_049T01_9000003408_23060cztM0_level2.evt | modeM0/AS1A07_049T01_9000003408_23060cztM0_level2_quad_clean.evt |
| Size (bytes) | 488,986,560 | 70,980,480 |
| Size | 466.3 MB | 67.7 MB |
| Events in quadrant A | 2,986,228 | 441,294 |
| Events in quadrant B | 4,848,014 | 435,406 |
| Events in quadrant C | 3,098,577 | 433,275 |
| Events in quadrant D | 3,463,514 | 414,969 |
| Mode M0 | |||
|---|---|---|---|
| Quadrant | BADHDUFLAG | Total packets | Discarded packets |
| A | 0 | 12575 | 1 |
| B | 0 | 18216 | 1 |
| C | 0 | 12815 | 1 |
| D | 0 | 14239 | 1 |
| Mode M9 | |||
|---|---|---|---|
| Quadrant | BADHDUFLAG | Total packets | Discarded packets |
| A | 0 | 11 | 0 |
| B | 0 | 11 | 0 |
| C | 0 | 11 | 0 |
| D | 0 | 11 | 0 |
| Mode SS | |||
|---|---|---|---|
| Quadrant | BADHDUFLAG | Total packets | Discarded packets |
| A | 0 | 124 | 0 |
| B | 0 | 124 | 0 |
| C | 0 | 124 | 0 |
| D | 0 | 124 | 0 |
| Quadrant | Total seconds | Saturated seconds | Saturation percentage |
|---|---|---|---|
| A | 6071 | 53 | 0.873003% |
| B | 6072 | 728 | 11.989460% |
| C | 6072 | 107 | 1.762187% |
| D | 6072 | 126 | 2.075099% |
Noise dominated data is calculated using 1-second bins in cleaned event files. If a bin has >2000 counts, and if more than 50% of those come from <1% of pixels, then it is considered to be noise-dominated and hence unusable.
| Quadrant | # 1 sec bins | Bins with >0 counts | Bins with >2000 counts | High rate bins dominated by noise | Noise dominated (total time) | Noise dominated (detector-on time) | Marked lightcurve |
|---|---|---|---|---|---|---|---|
| A | 7196 | 6072 | 0 | 0 | 0.00% | 0.00% | 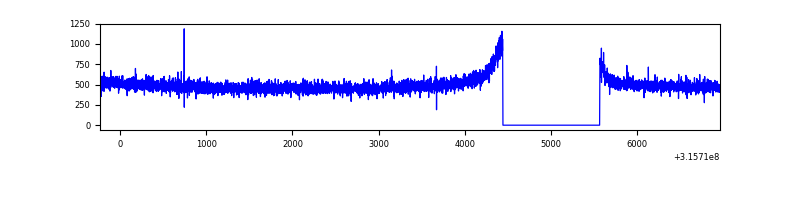 |
| B | 7197 | 6073 | 485 | 485 | 6.74% | 7.99% | 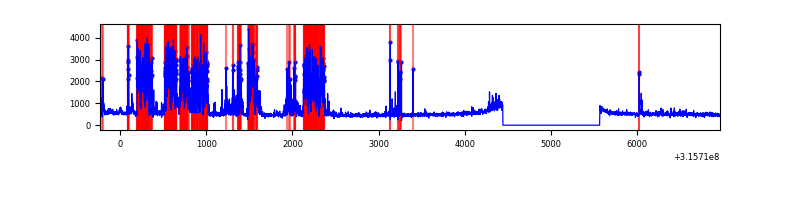 |
| C | 7197 | 6073 | 4 | 4 | 0.06% | 0.07% | 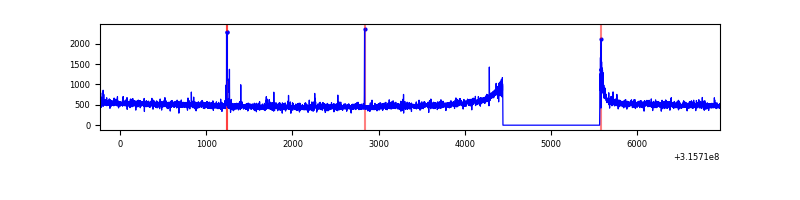 |
| D | 7197 | 6073 | 81 | 81 | 1.13% | 1.33% | 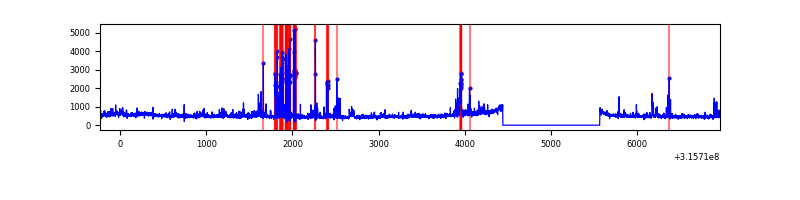 |
Top three noisy pixels from each quadrant. If the there are fewer than three noisy pixels in the level2.evt file, extra rows are filled as -1
| Pixel properties | Quadrant properties | ||||||
|---|---|---|---|---|---|---|---|
| Quadrant | DetID | PixID | Counts | Sigma | Mean | Median | Sigma |
| A | 13 | 254 | 9194 | 54.4 | 774 | 759 | 155.0 |
| A | 3 | 137 | 6718 | 38.44 | 774 | 759 | 155.0 |
| A | 0 | 226 | 6561 | 37.42 | 774 | 759 | 155.0 |
| B | 3 | 64 | 1853483 | 13041.39 | 744 | 726 | 142.1 |
| B | 0 | 189 | 39525 | 273.1 | 744 | 726 | 142.1 |
| B | 4 | 216 | 27412 | 187.84 | 744 | 726 | 142.1 |
| C | 14 | 238 | 119050 | 681.43 | 745 | 753 | 173.6 |
| C | 0 | 10 | 29394 | 164.98 | 745 | 753 | 173.6 |
| C | 10 | 22 | 18925 | 104.68 | 745 | 753 | 173.6 |
| D | 1 | 52 | 521279 | 2862.44 | 747 | 725 | 181.9 |
| D | 13 | 153 | 58701 | 318.8 | 747 | 725 | 181.9 |
| D | 13 | 174 | 35010 | 188.53 | 747 | 725 | 181.9 |
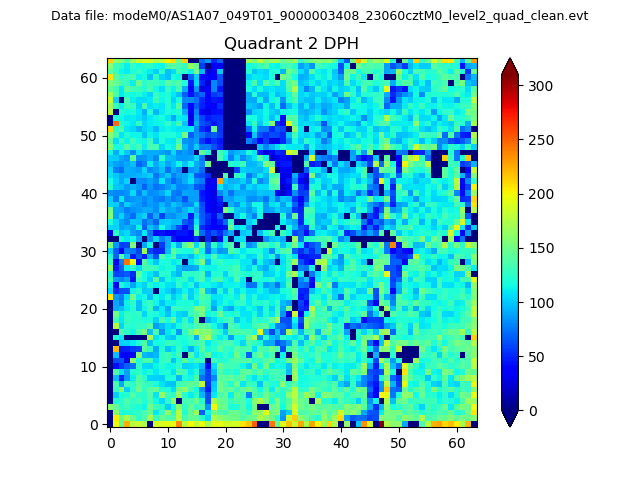
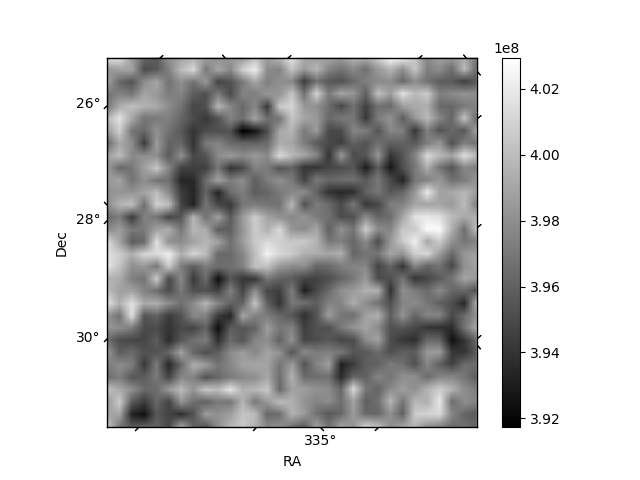
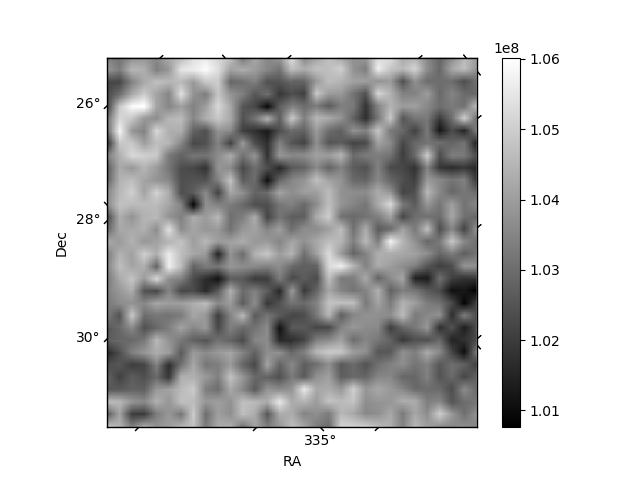
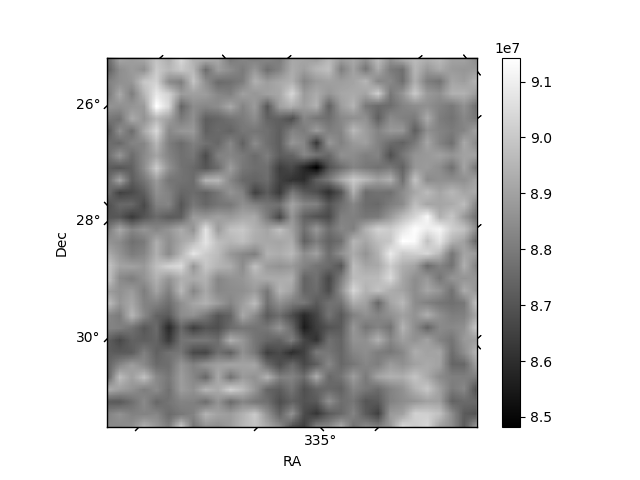
Histogram calculated using DETX and DETY for each event in the final _common_clean file
| Quadrant A | 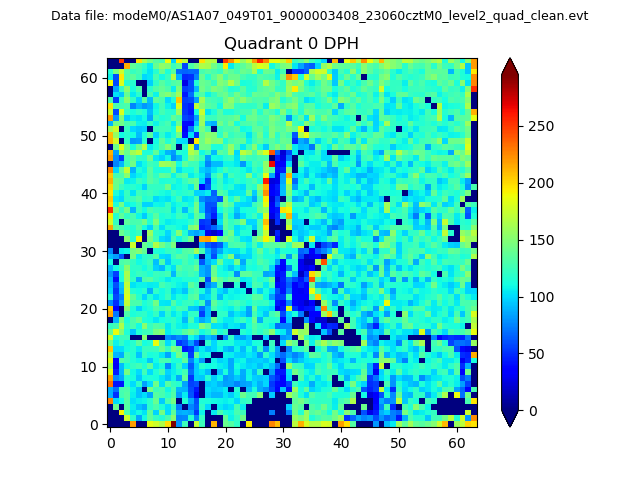 |
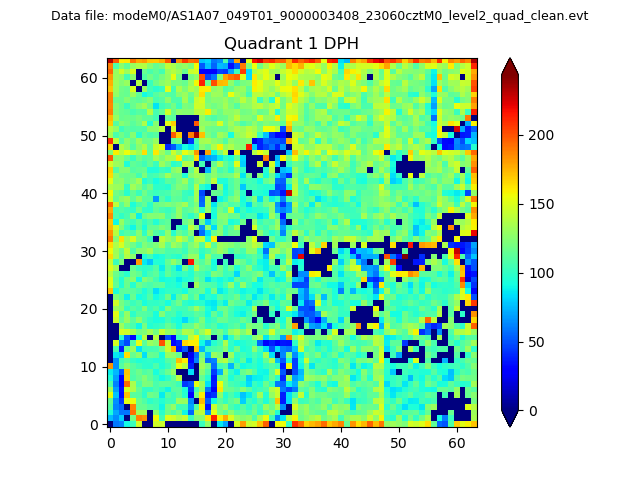 |
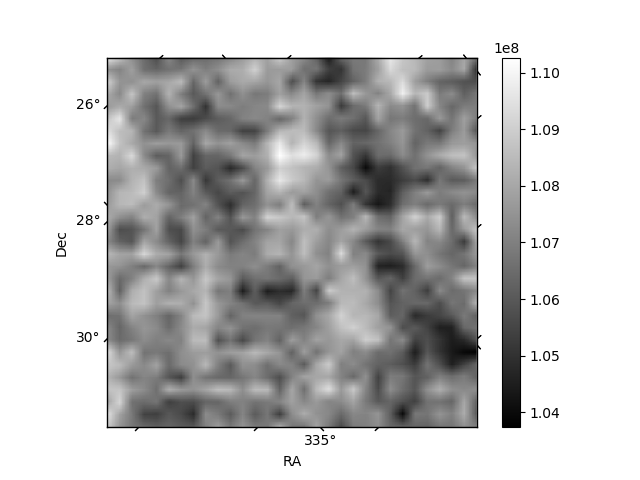
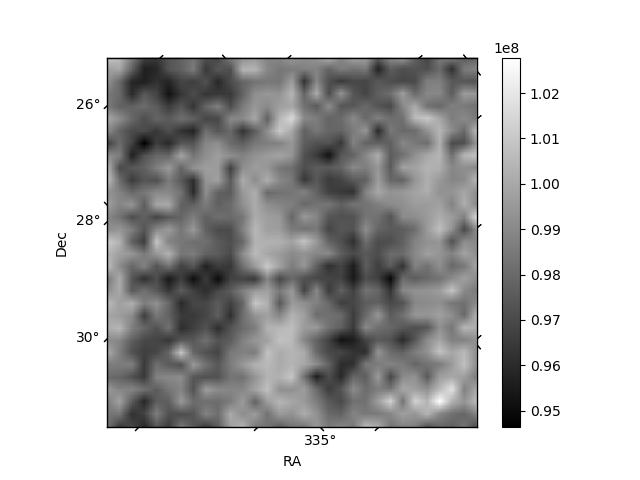
Quadrant B |
|---|---|---|---|
| Quadrant D | 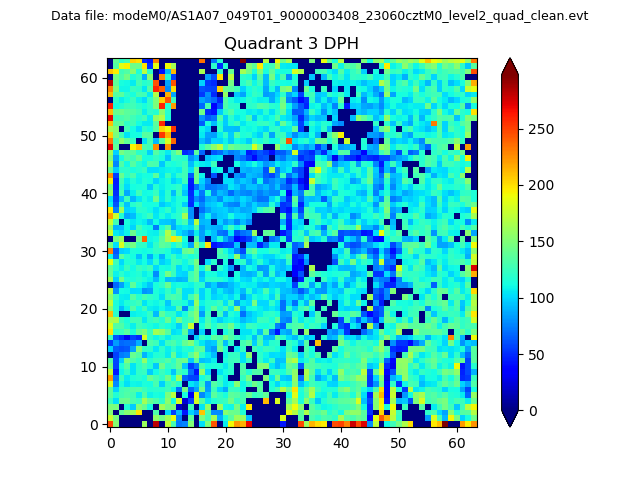 |
 |
Quadrant C |
| Plot type | Count rate plots | Images |
|---|---|---|
| Comparison with Poisson distribution Blue bars denote a histogram of data divided into 1 sec bins. Red curve is a Poisson curve with rate = median count rate of data. |
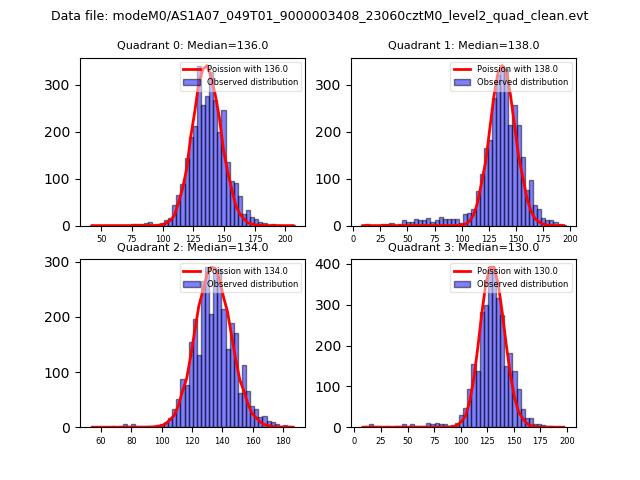 |
 |
| Quadrant-wise count rates Data is divided into 100 sec bins |
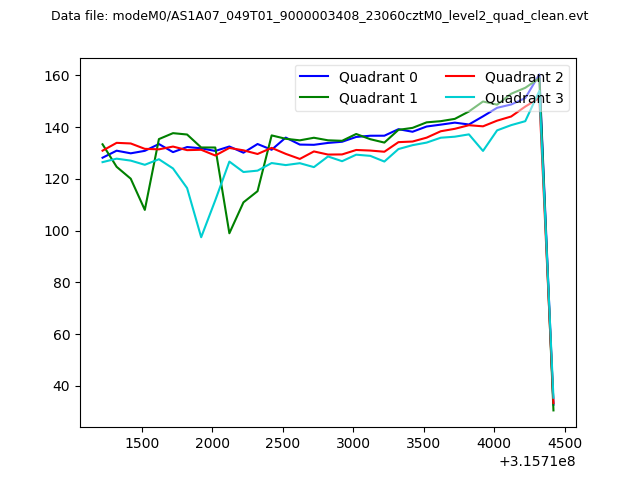 |
|
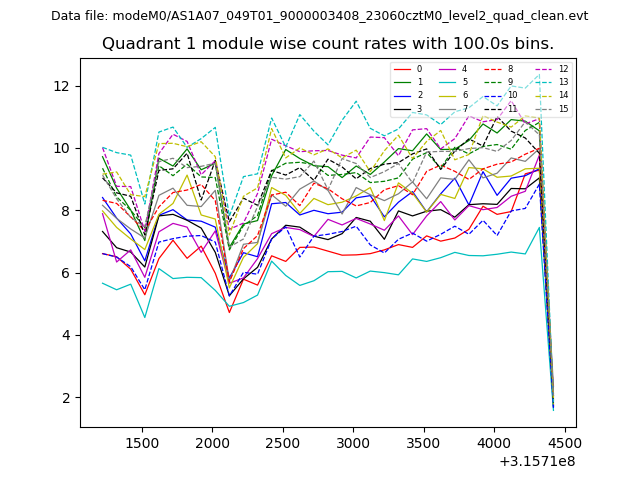
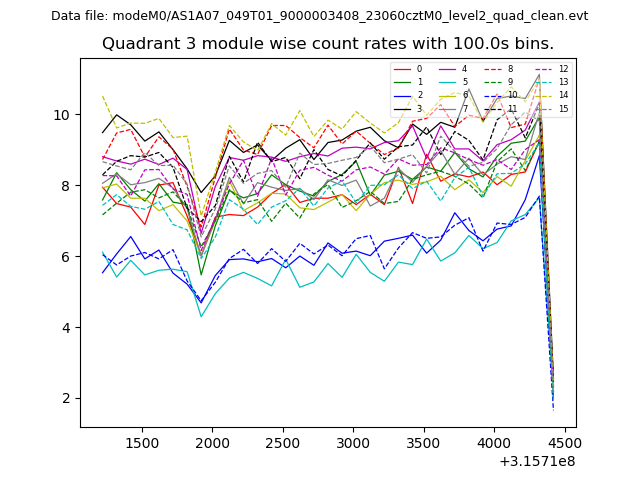
| Module-wise count rates for Quadrant A Data is divided into 100 sec bins |
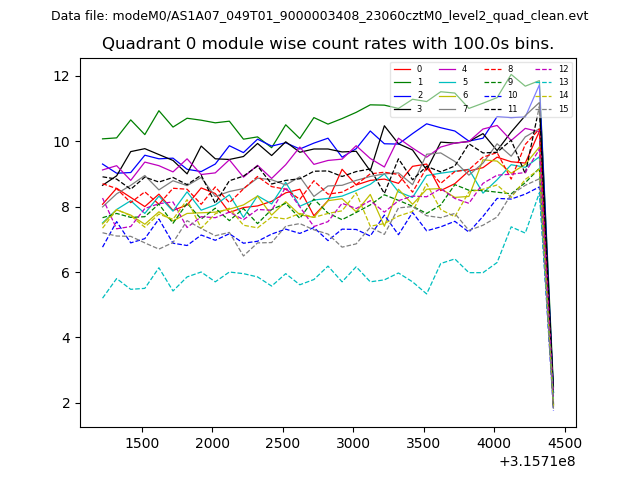 |
 |
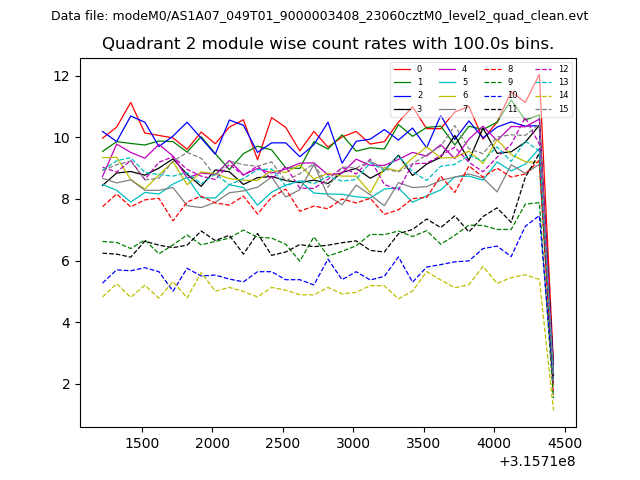
| Module-wise count rates for Quadrant B Data is divided into 100 sec bins |
 |
 |
| Module-wise count rates for Quadrant C Data is divided into 100 sec bins |
 |
 |
| Module-wise count rates for Quadrant D Data is divided into 100 sec bins |
 |
 |
| Parameter | Plot |
|---|---|
| CZT HV Monitor | 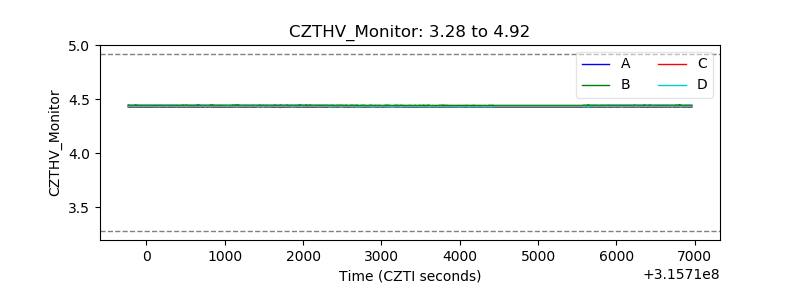 |
| D_VDD | 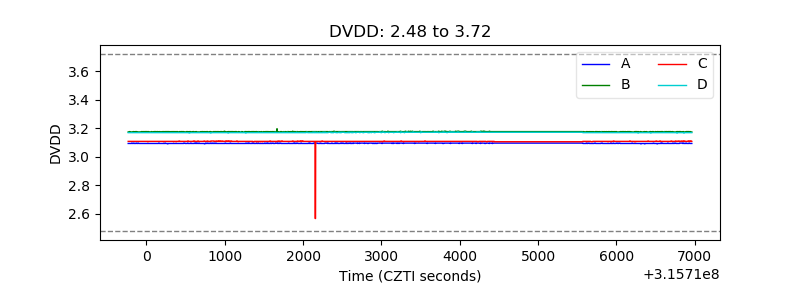 |
| Temperature 1 | 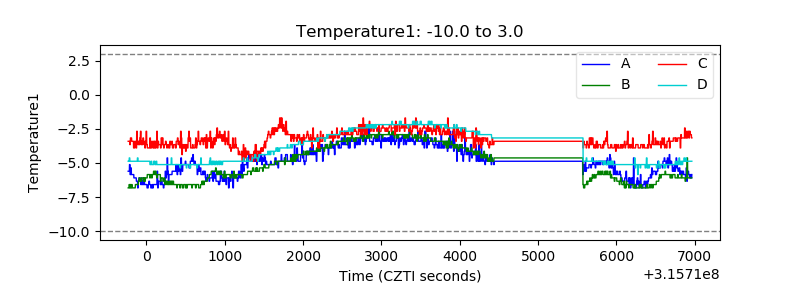 |
| Veto HV Monitor | 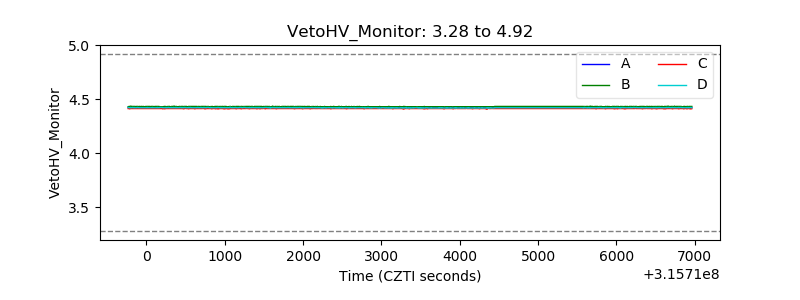 |
| Veto LLD | 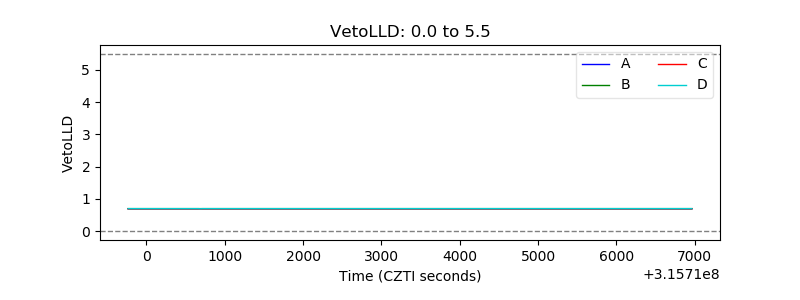 |
| Alpha Counter | 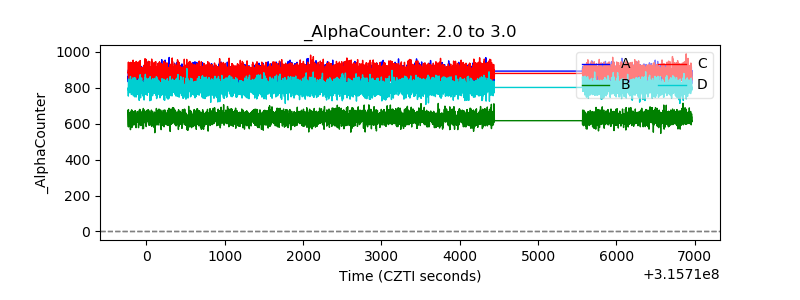 |
| _CPM_Rate | 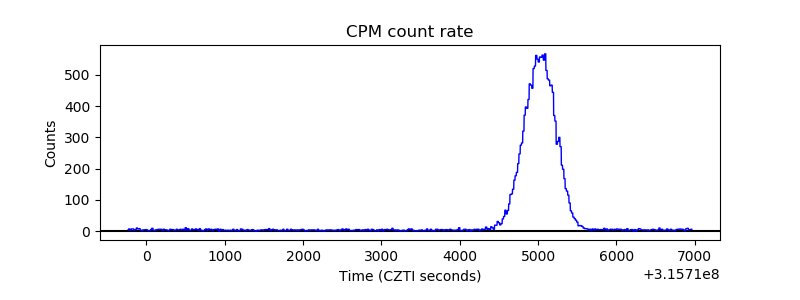 |
| CZT Counter | 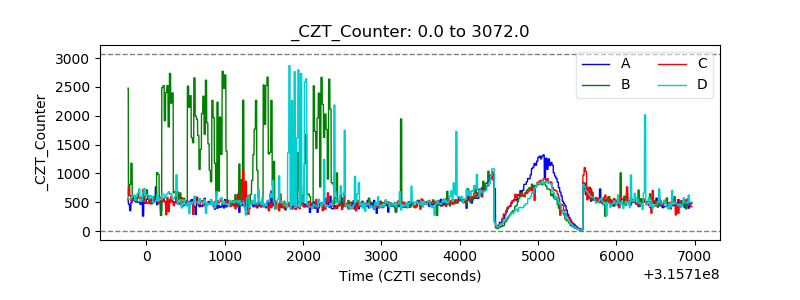 |
| +2.5 Volts monitor |  |
| +5 Volts monitor | 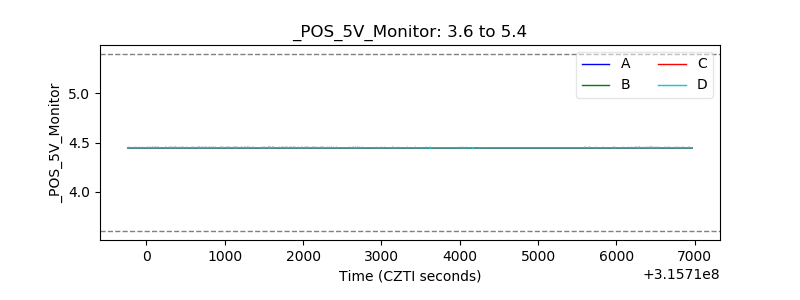 |
| _ROLL_ROT | 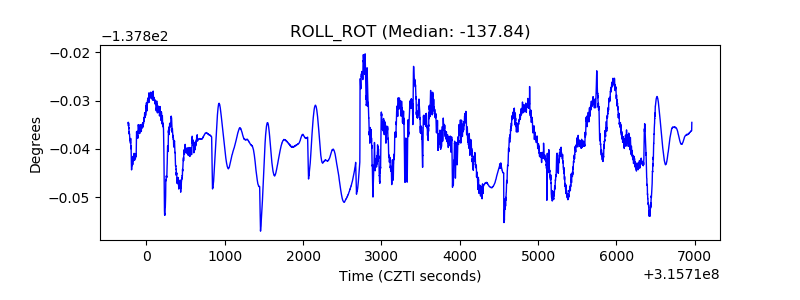 |
| _Roll_DEC | 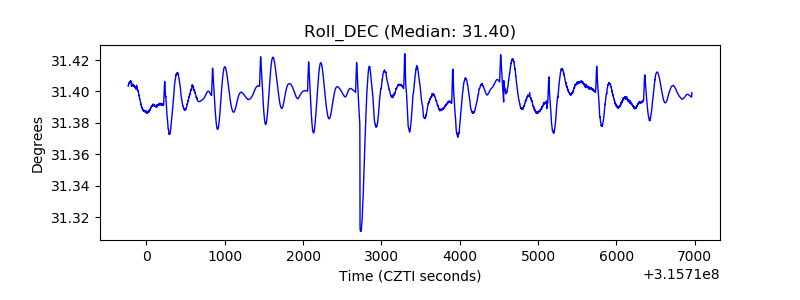 |
| _Roll_RA | 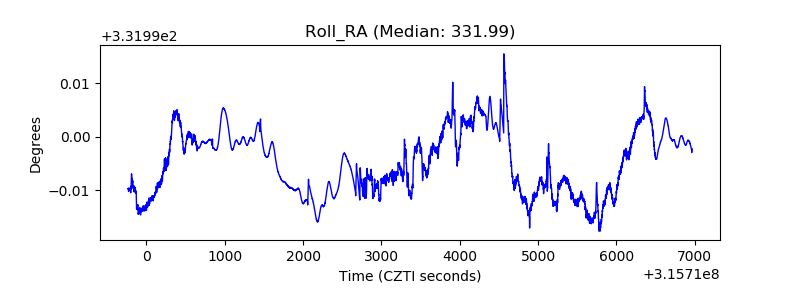 |
| Veto Counter | 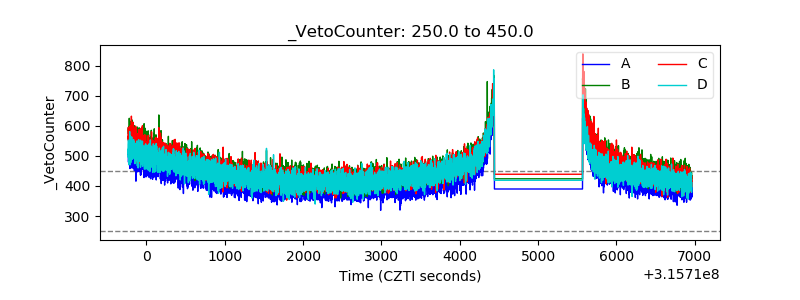 |