| Param | Original file | Final file |
|---|---|---|
| Filename | modeM0/AS1A07_049T01_9000003408_23062cztM0_level2.evt | modeM0/AS1A07_049T01_9000003408_23062cztM0_level2_quad_clean.evt |
| Size (bytes) | 548,550,720 | 90,936,000 |
| Size | 523.1 MB | 86.7 MB |
| Events in quadrant A | 3,621,821 | 560,834 |
| Events in quadrant B | 3,914,191 | 572,943 |
| Events in quadrant C | 3,763,871 | 551,633 |
| Events in quadrant D | 4,793,994 | 536,645 |
| Mode M0 | |||
|---|---|---|---|
| Quadrant | BADHDUFLAG | Total packets | Discarded packets |
| A | 0 | 15817 | 2 |
| B | 0 | 16613 | 2 |
| C | 0 | 16028 | 3 |
| D | 0 | 19458 | 2 |
| Mode M9 | |||
|---|---|---|---|
| Quadrant | BADHDUFLAG | Total packets | Discarded packets |
| A | 0 | 3 | 0 |
| B | 0 | 4 | 0 |
| C | 0 | 4 | 0 |
| D | 0 | 4 | 0 |
| Mode SS | |||
|---|---|---|---|
| Quadrant | BADHDUFLAG | Total packets | Discarded packets |
| A | 0 | 154 | 0 |
| B | 0 | 154 | 0 |
| C | 0 | 154 | 0 |
| D | 0 | 154 | 0 |
| Quadrant | Total seconds | Saturated seconds | Saturation percentage |
|---|---|---|---|
| A | 7647 | 206 | 2.693867% |
| B | 7647 | 326 | 4.263110% |
| C | 7646 | 221 | 2.890400% |
| D | 7646 | 209 | 2.733455% |
Noise dominated data is calculated using 1-second bins in cleaned event files. If a bin has >2000 counts, and if more than 50% of those come from <1% of pixels, then it is considered to be noise-dominated and hence unusable.
| Quadrant | # 1 sec bins | Bins with >0 counts | Bins with >2000 counts | High rate bins dominated by noise | Noise dominated (total time) | Noise dominated (detector-on time) | Marked lightcurve |
|---|---|---|---|---|---|---|---|
| A | 7777 | 7649 | 0 | 0 | 0.00% | 0.00% | 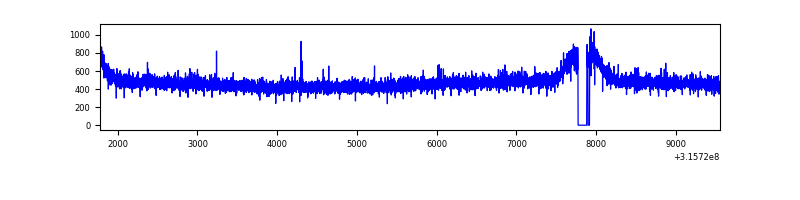 |
| B | 7777 | 7649 | 26 | 26 | 0.33% | 0.34% | 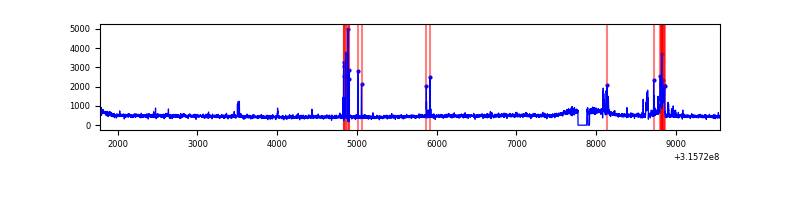 |
| C | 7776 | 7648 | 1 | 1 | 0.01% | 0.01% | 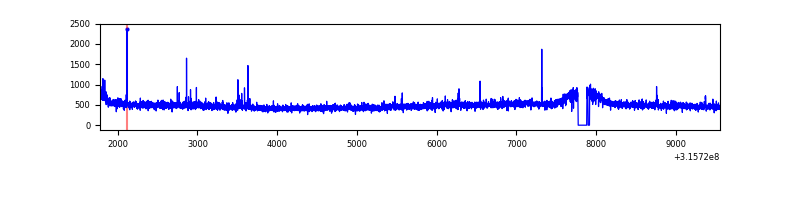 |
| D | 7776 | 7648 | 36 | 36 | 0.46% | 0.47% | 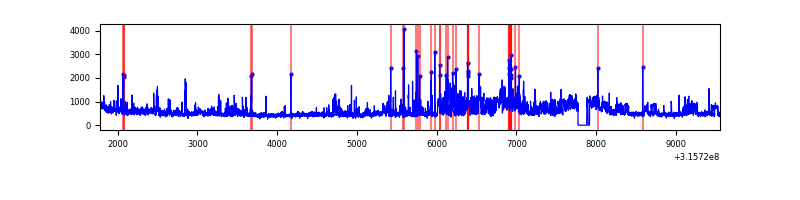 |
Top three noisy pixels from each quadrant. If the there are fewer than three noisy pixels in the level2.evt file, extra rows are filled as -1
| Pixel properties | Quadrant properties | ||||||
|---|---|---|---|---|---|---|---|
| Quadrant | DetID | PixID | Counts | Sigma | Mean | Median | Sigma |
| A | 13 | 254 | 10459 | 50.29 | 937 | 917 | 189.7 |
| A | 3 | 137 | 8928 | 42.22 | 937 | 917 | 189.7 |
| A | 0 | 226 | 7934 | 36.98 | 937 | 917 | 189.7 |
| B | 3 | 64 | 158330 | 864.28 | 934 | 906 | 182.1 |
| B | 4 | 216 | 46140 | 248.34 | 934 | 906 | 182.1 |
| B | 4 | 173 | 44176 | 237.56 | 934 | 906 | 182.1 |
| C | 14 | 238 | 143340 | 670.17 | 906 | 911 | 212.5 |
| C | 0 | 207 | 46804 | 215.94 | 906 | 911 | 212.5 |
| C | 8 | 128 | 14486 | 63.87 | 906 | 911 | 212.5 |
| D | 1 | 52 | 996640 | 4413.11 | 917 | 889 | 225.6 |
| D | 1 | 239 | 121429 | 534.23 | 917 | 889 | 225.6 |
| D | 13 | 174 | 104474 | 459.08 | 917 | 889 | 225.6 |
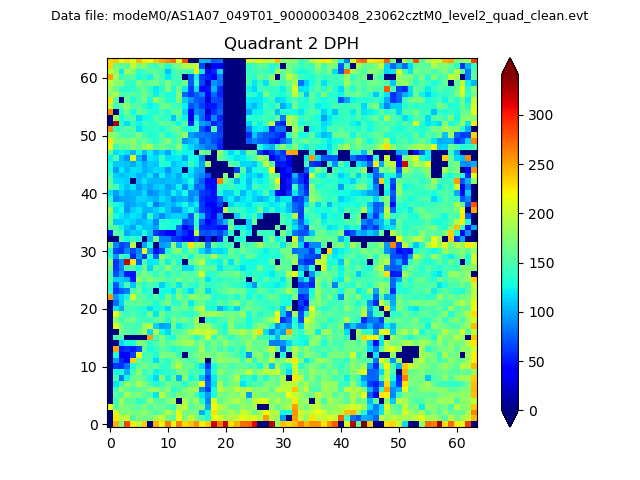
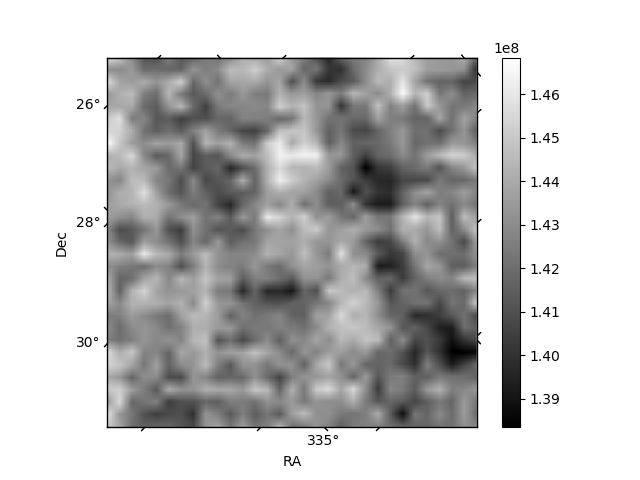
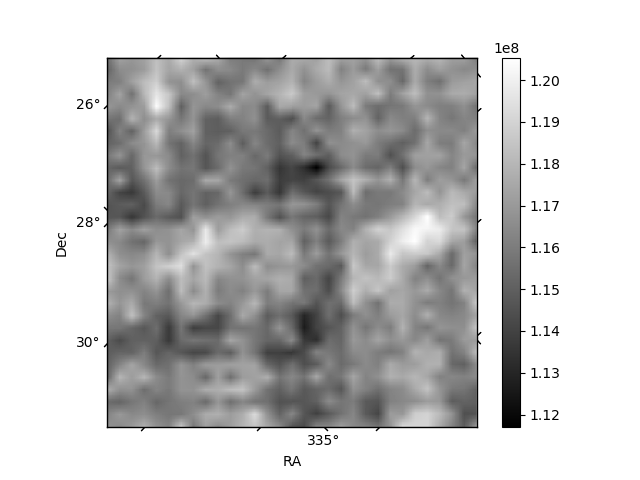
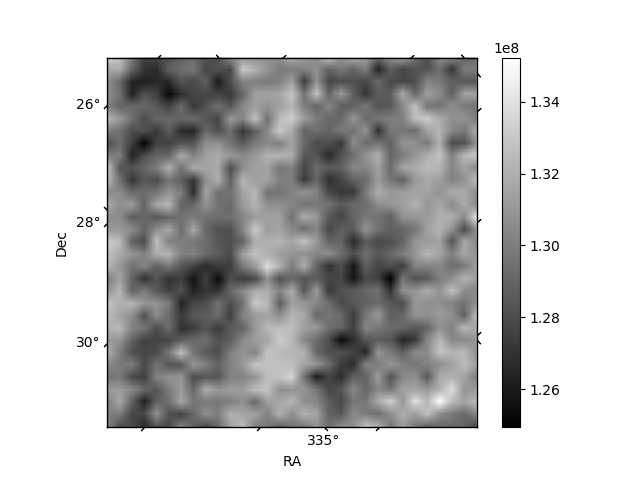
Histogram calculated using DETX and DETY for each event in the final _common_clean file
| Quadrant A | 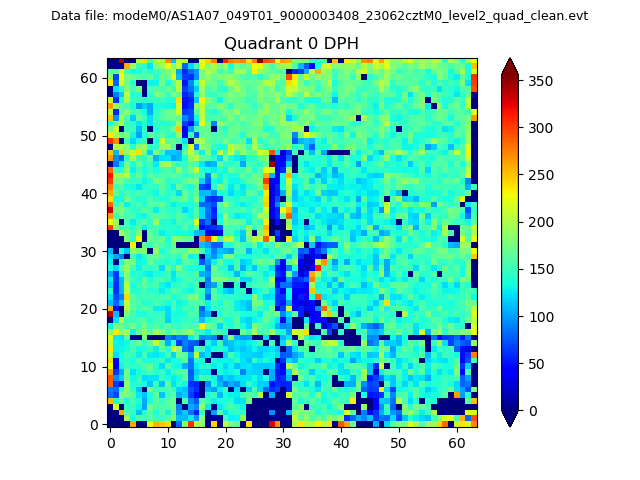 |
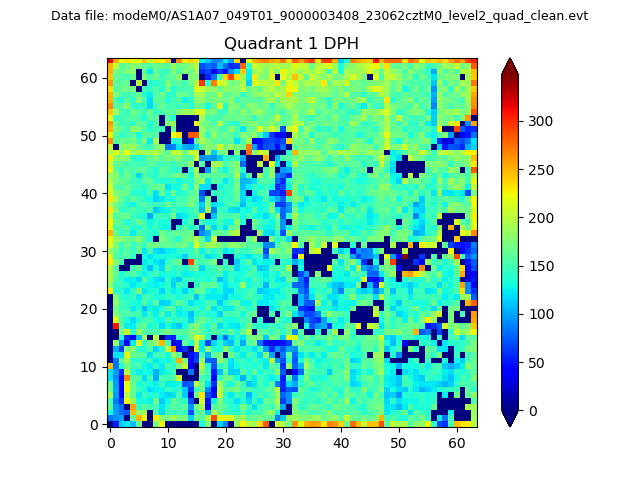 |
Quadrant B |
|---|---|---|---|
| Quadrant D | 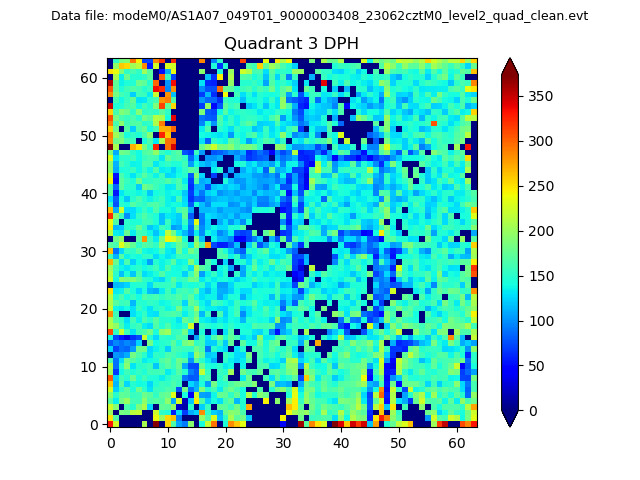 |
 |
Quadrant C |
| Plot type | Count rate plots | Images |
|---|---|---|
| Comparison with Poisson distribution Blue bars denote a histogram of data divided into 1 sec bins. Red curve is a Poisson curve with rate = median count rate of data. |
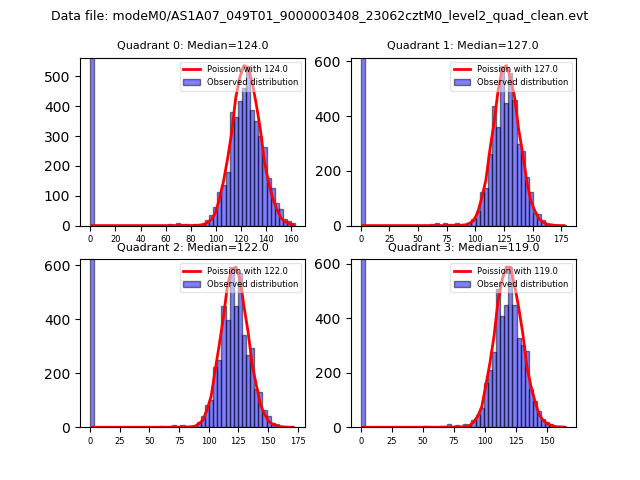 |
 |
| Quadrant-wise count rates Data is divided into 100 sec bins |
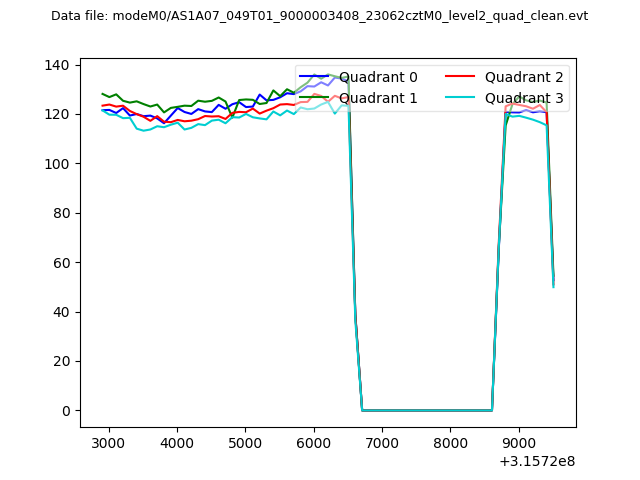 |
|
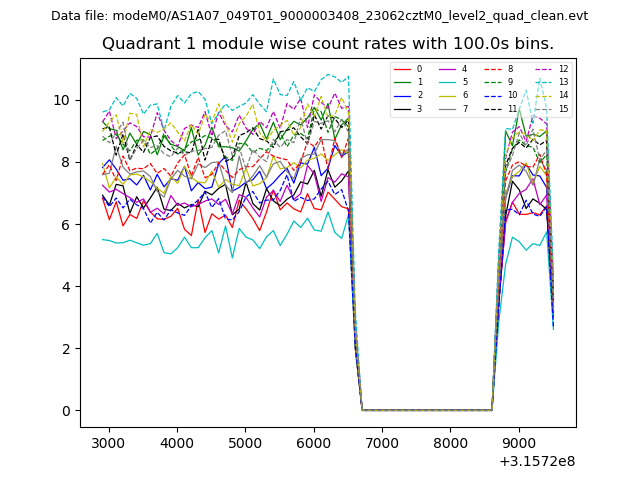
| Module-wise count rates for Quadrant A Data is divided into 100 sec bins |
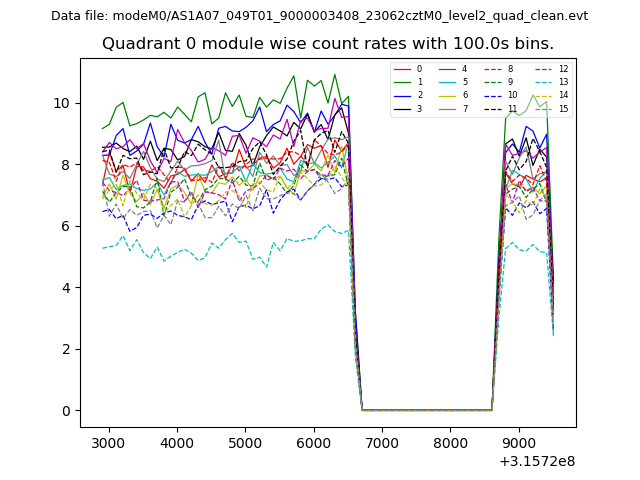 |
 |
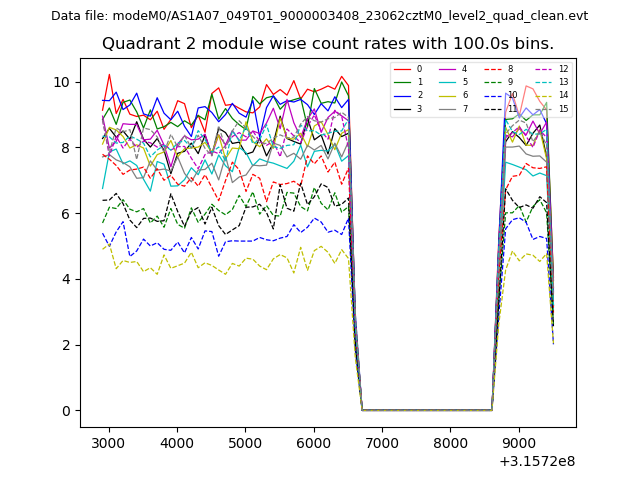
| Module-wise count rates for Quadrant B Data is divided into 100 sec bins |
 |
 |
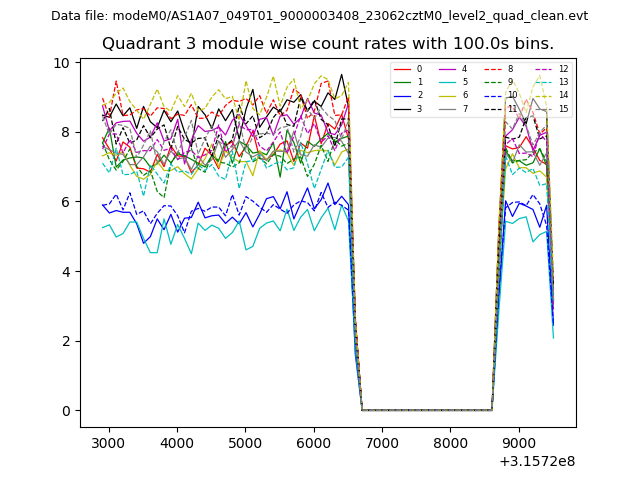
| Module-wise count rates for Quadrant C Data is divided into 100 sec bins |
 |
 |
| Module-wise count rates for Quadrant D Data is divided into 100 sec bins |
 |
 |
| Parameter | Plot |
|---|---|
| CZT HV Monitor | 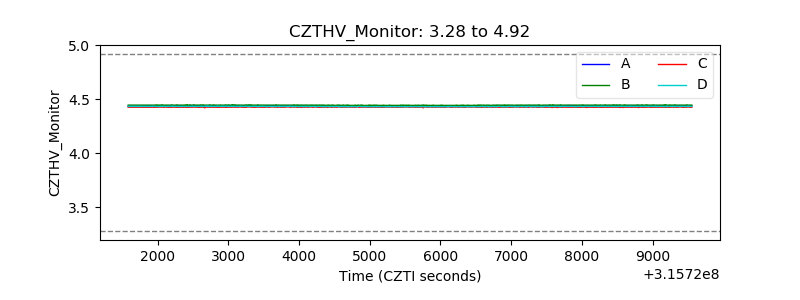 |
| D_VDD | 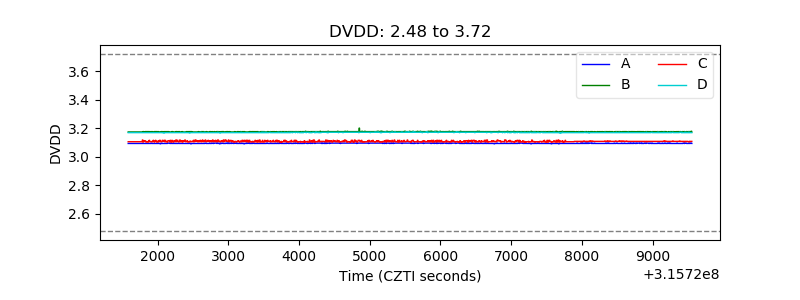 |
| Temperature 1 | 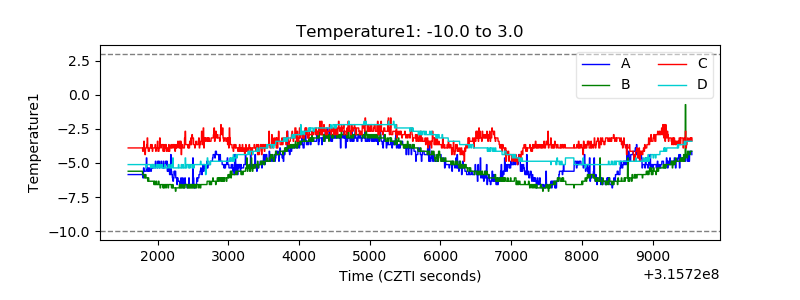 |
| Veto HV Monitor | 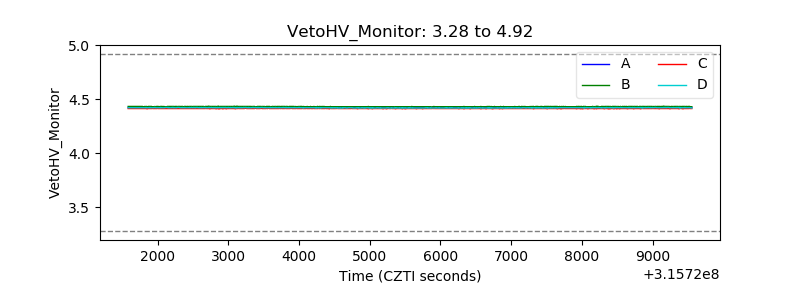 |
| Veto LLD | 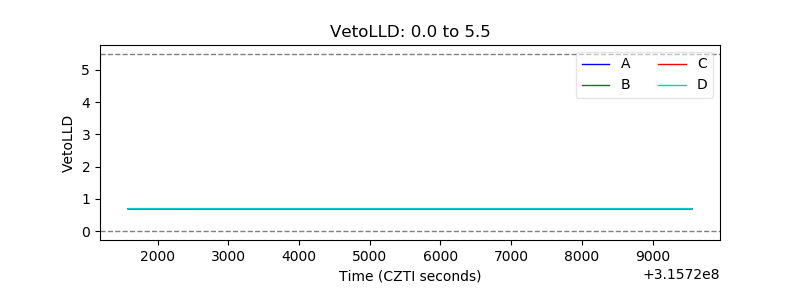 |
| Alpha Counter | 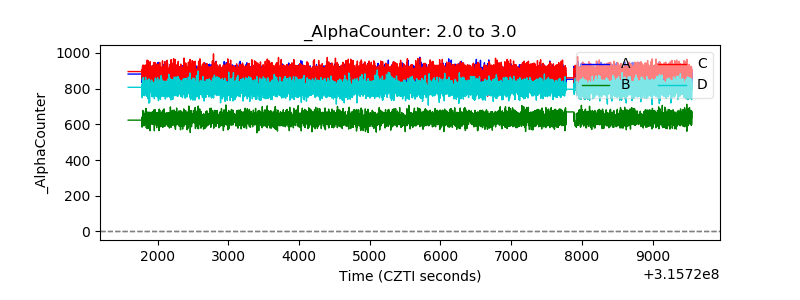 |
| _CPM_Rate | 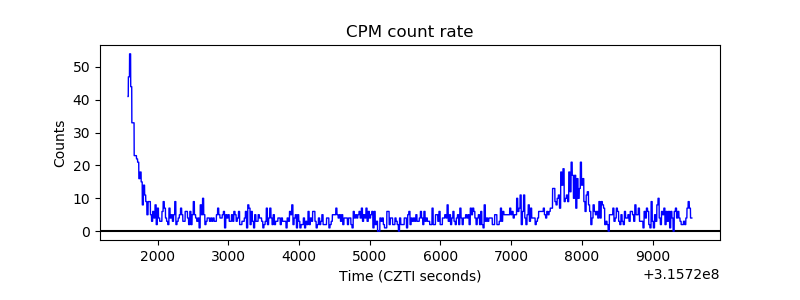 |
| CZT Counter | 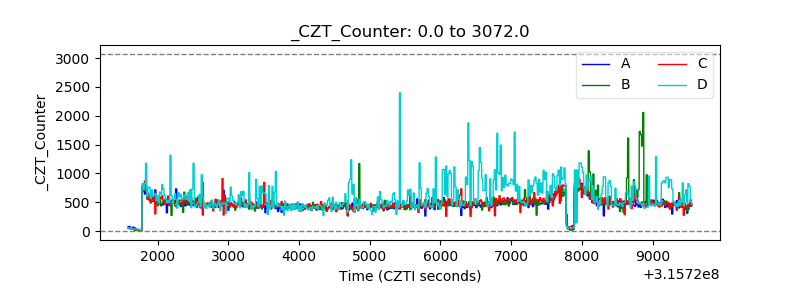 |
| +2.5 Volts monitor | 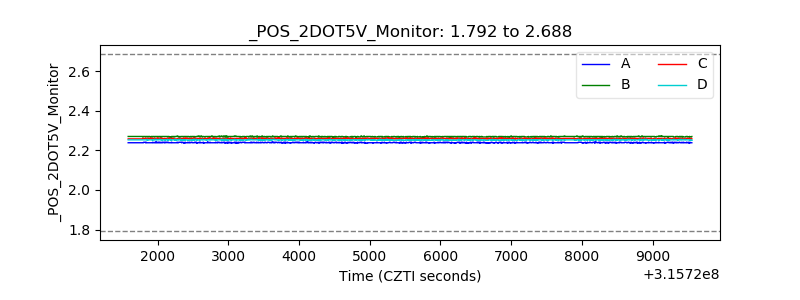 |
| +5 Volts monitor | 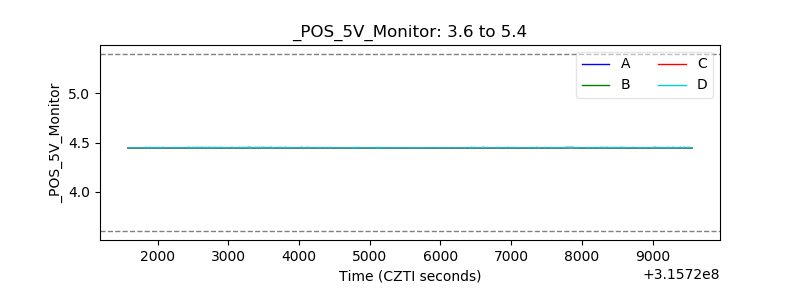 |
| _ROLL_ROT | 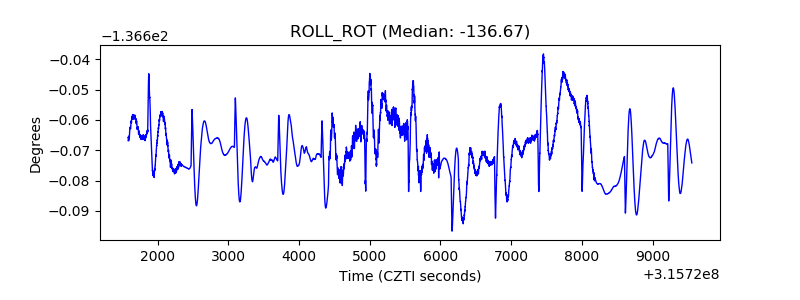 |
| _Roll_DEC |  |
| _Roll_RA | 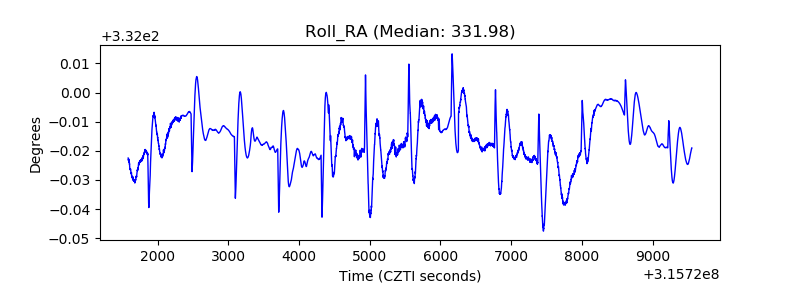 |
| Veto Counter |  |