| Param | Original file | Final file |
|---|---|---|
| Filename | modeM0/AS1A07_049T01_9000003408_23063cztM0_level2.evt | modeM0/AS1A07_049T01_9000003408_23063cztM0_level2_quad_clean.evt |
| Size (bytes) | 502,125,120 | 97,073,280 |
| Size | 478.9 MB | 92.6 MB |
| Events in quadrant A | 3,437,941 | 616,281 |
| Events in quadrant B | 3,738,694 | 626,716 |
| Events in quadrant C | 3,548,680 | 603,577 |
| Events in quadrant D | 3,991,958 | 591,639 |
| Mode M0 | |||
|---|---|---|---|
| Quadrant | BADHDUFLAG | Total packets | Discarded packets |
| A | 0 | 14976 | 1 |
| B | 0 | 15838 | 1 |
| C | 0 | 15226 | 1 |
| D | 0 | 16461 | 1 |
| Mode SS | |||
|---|---|---|---|
| Quadrant | BADHDUFLAG | Total packets | Discarded packets |
| A | 0 | 144 | 0 |
| B | 0 | 144 | 0 |
| C | 0 | 144 | 0 |
| D | 0 | 144 | 0 |
| Quadrant | Total seconds | Saturated seconds | Saturation percentage |
|---|---|---|---|
| A | 7203 | 221 | 3.068166% |
| B | 7204 | 353 | 4.900056% |
| C | 7204 | 255 | 3.539700% |
| D | 7204 | 137 | 1.901721% |
Noise dominated data is calculated using 1-second bins in cleaned event files. If a bin has >2000 counts, and if more than 50% of those come from <1% of pixels, then it is considered to be noise-dominated and hence unusable.
| Quadrant | # 1 sec bins | Bins with >0 counts | Bins with >2000 counts | High rate bins dominated by noise | Noise dominated (total time) | Noise dominated (detector-on time) | Marked lightcurve |
|---|---|---|---|---|---|---|---|
| A | 7218 | 7204 | 0 | 0 | 0.00% | 0.00% | 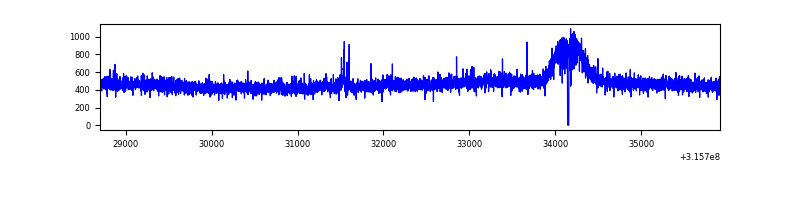 |
| B | 7219 | 7205 | 57 | 57 | 0.79% | 0.79% | 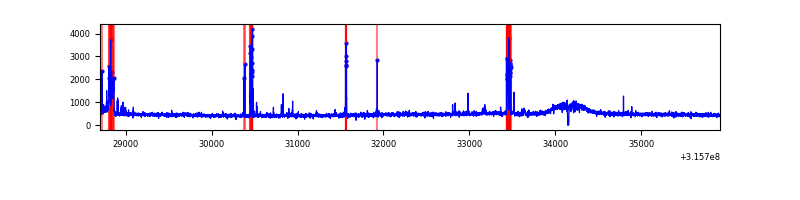 |
| C | 7219 | 7205 | 8 | 8 | 0.11% | 0.11% | 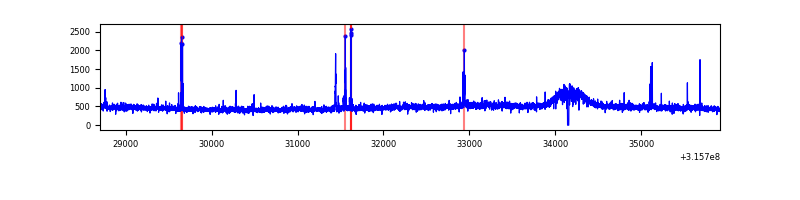 |
| D | 7219 | 7205 | 3 | 3 | 0.04% | 0.04% | 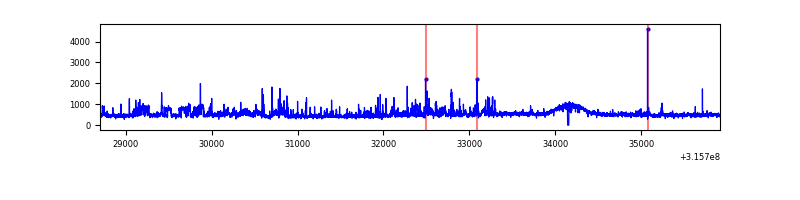 |
Top three noisy pixels from each quadrant. If the there are fewer than three noisy pixels in the level2.evt file, extra rows are filled as -1
| Pixel properties | Quadrant properties | ||||||
|---|---|---|---|---|---|---|---|
| Quadrant | DetID | PixID | Counts | Sigma | Mean | Median | Sigma |
| A | 6 | 16 | 30653 | 165.41 | 883 | 860 | 180.1 |
| A | 13 | 254 | 10467 | 53.34 | 883 | 860 | 180.1 |
| A | 3 | 137 | 8383 | 41.77 | 883 | 860 | 180.1 |
| B | 3 | 64 | 183527 | 1074.15 | 874 | 851 | 170.1 |
| B | 4 | 216 | 60791 | 352.45 | 874 | 851 | 170.1 |
| B | 4 | 173 | 39060 | 224.67 | 874 | 851 | 170.1 |
| C | 14 | 238 | 132925 | 657.97 | 847 | 852 | 200.7 |
| C | 10 | 22 | 65821 | 323.67 | 847 | 852 | 200.7 |
| C | 0 | 207 | 31015 | 150.27 | 847 | 852 | 200.7 |
| D | 1 | 52 | 454619 | 2122.83 | 865 | 838 | 213.8 |
| D | 13 | 174 | 81715 | 378.35 | 865 | 838 | 213.8 |
| D | 2 | 136 | 48118 | 221.18 | 865 | 838 | 213.8 |
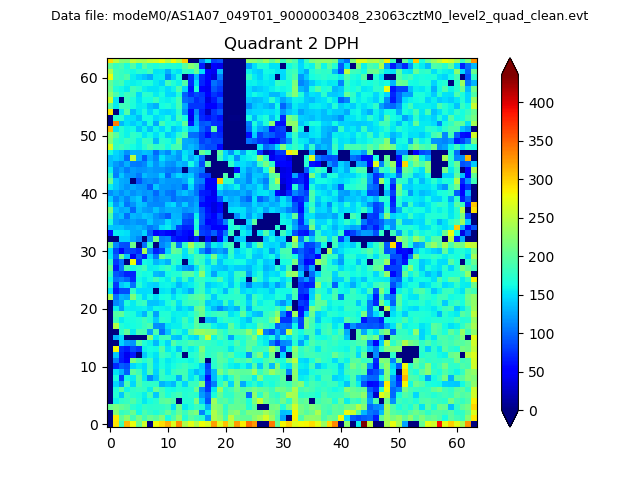
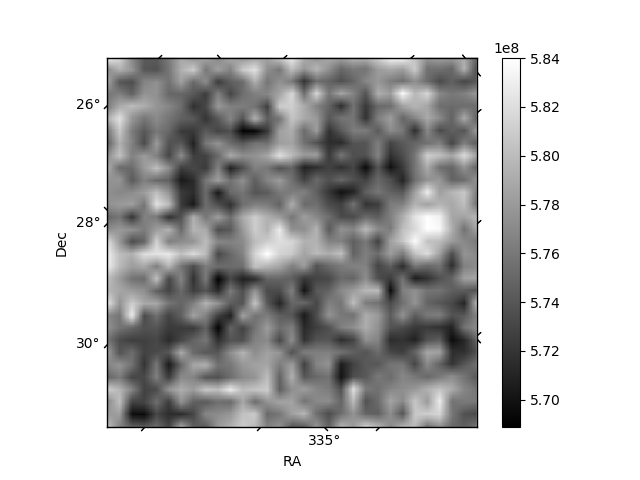
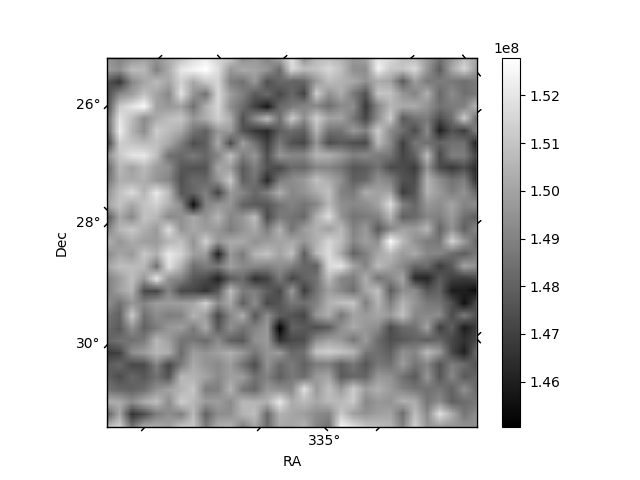
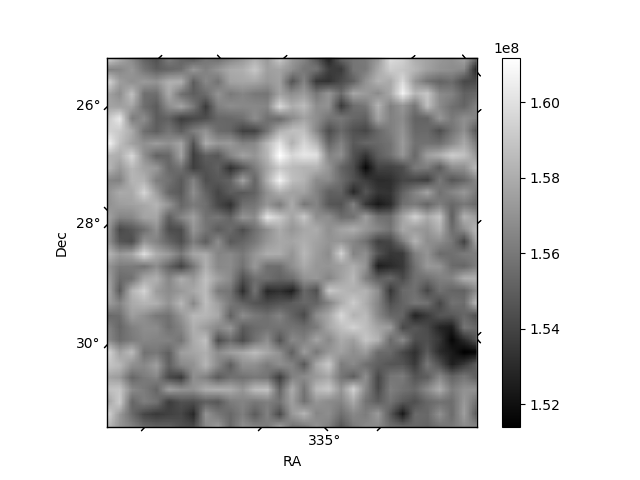
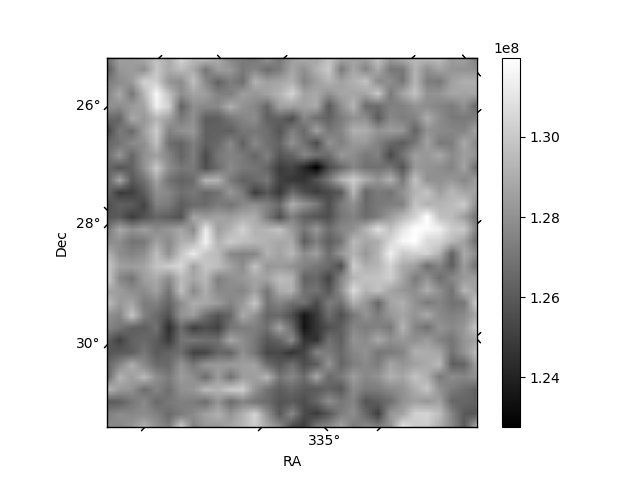
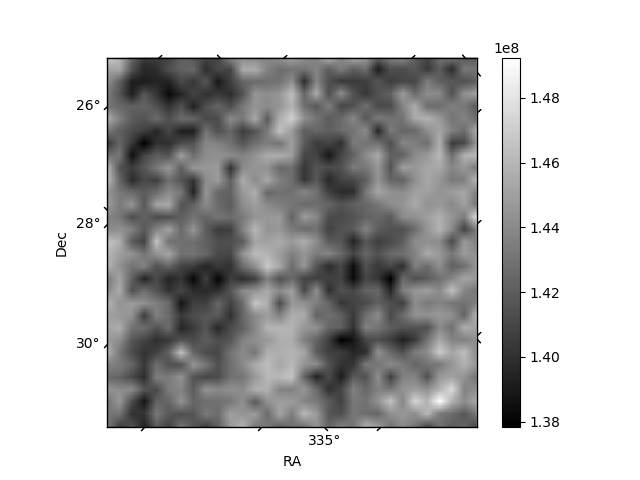
Histogram calculated using DETX and DETY for each event in the final _common_clean file
| Quadrant A | 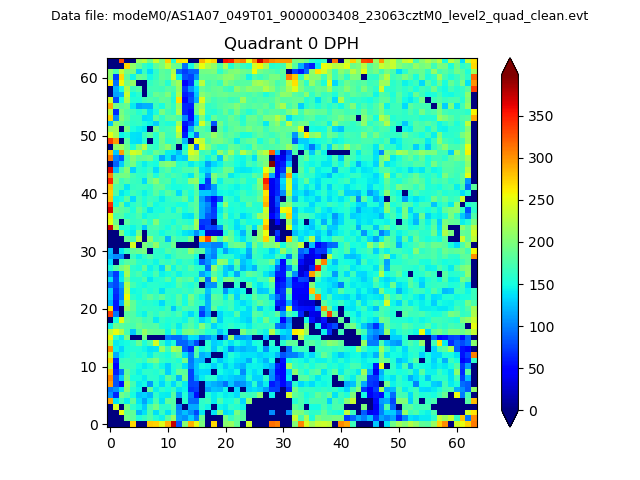 |
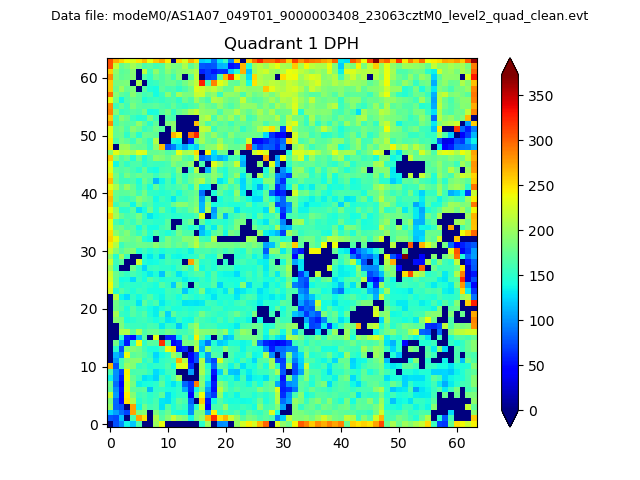 |
Quadrant B |
|---|---|---|---|
| Quadrant D | 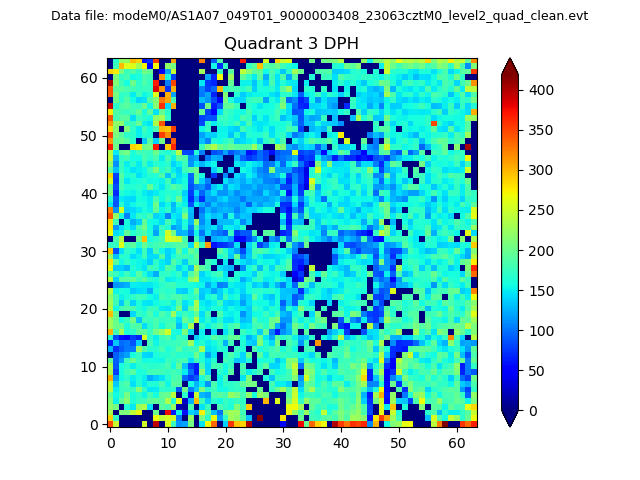 |
 |
Quadrant C |
| Plot type | Count rate plots | Images |
|---|---|---|
| Comparison with Poisson distribution Blue bars denote a histogram of data divided into 1 sec bins. Red curve is a Poisson curve with rate = median count rate of data. |
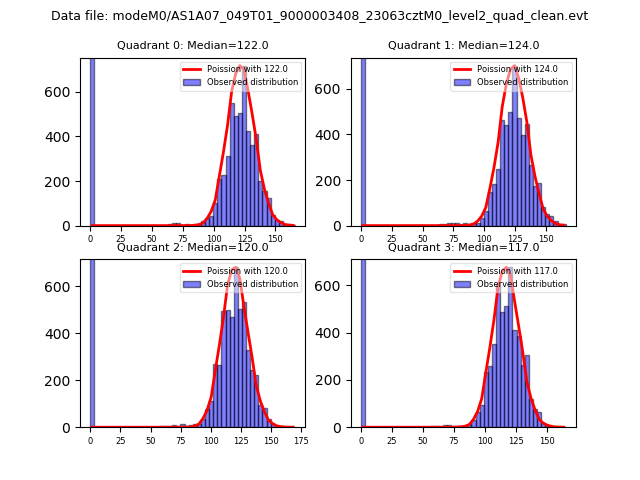 |
 |
| Quadrant-wise count rates Data is divided into 100 sec bins |
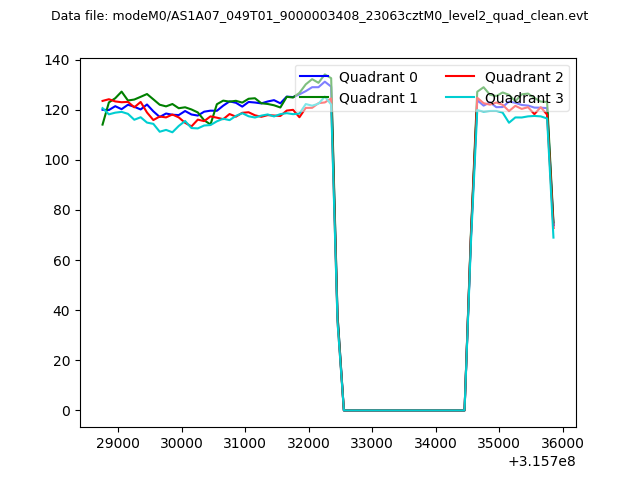 |
|
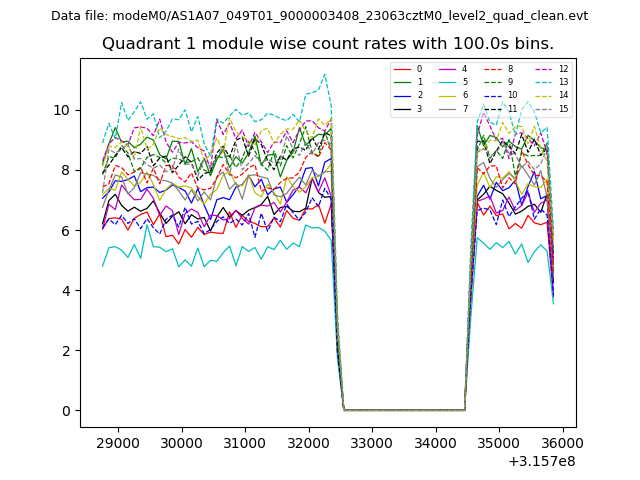
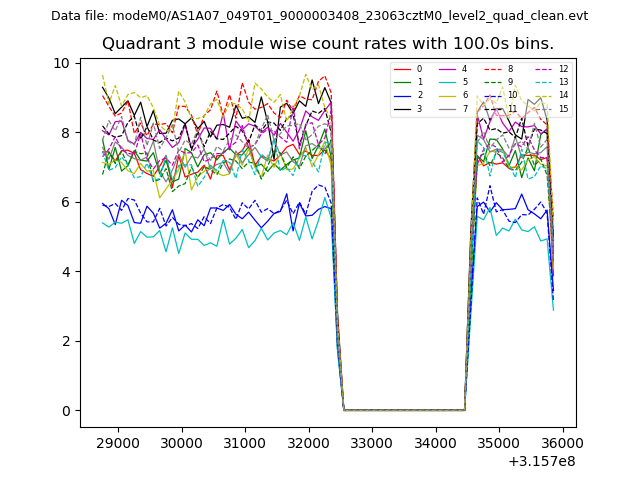
| Module-wise count rates for Quadrant A Data is divided into 100 sec bins |
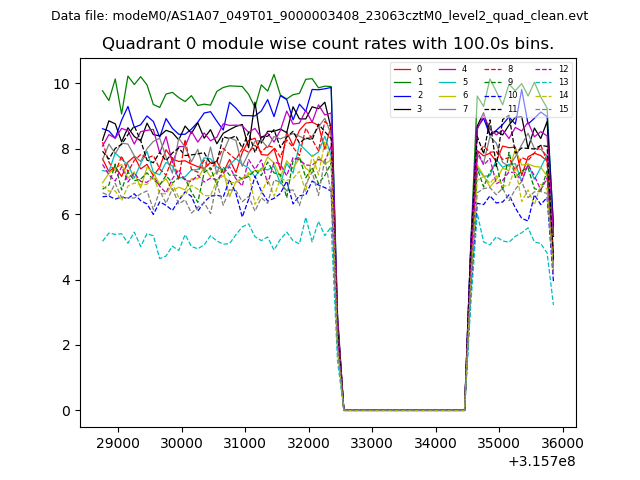 |
 |
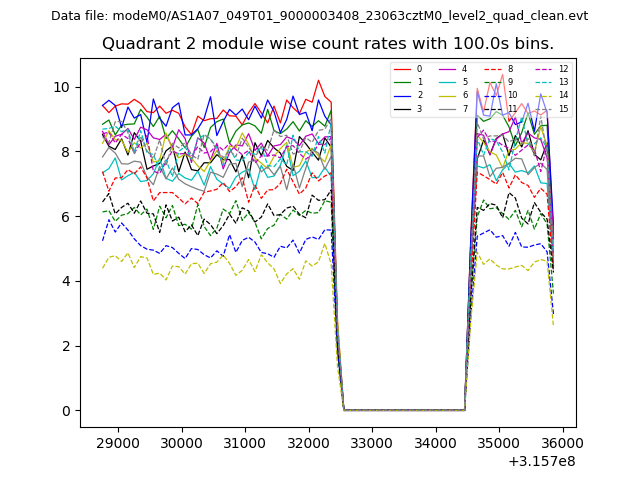
| Module-wise count rates for Quadrant B Data is divided into 100 sec bins |
 |
 |
| Module-wise count rates for Quadrant C Data is divided into 100 sec bins |
 |
 |
| Module-wise count rates for Quadrant D Data is divided into 100 sec bins |
 |
 |
| Parameter | Plot |
|---|---|
| CZT HV Monitor | 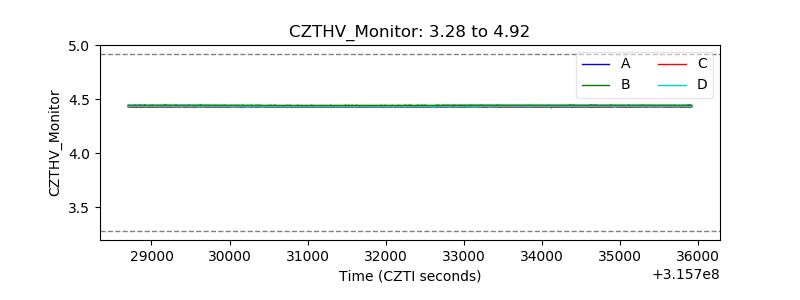 |
| D_VDD | 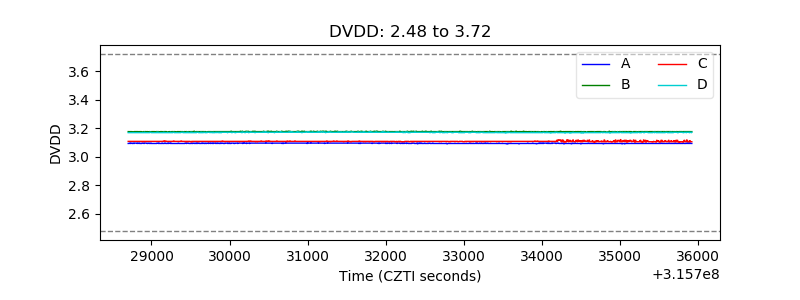 |
| Temperature 1 | 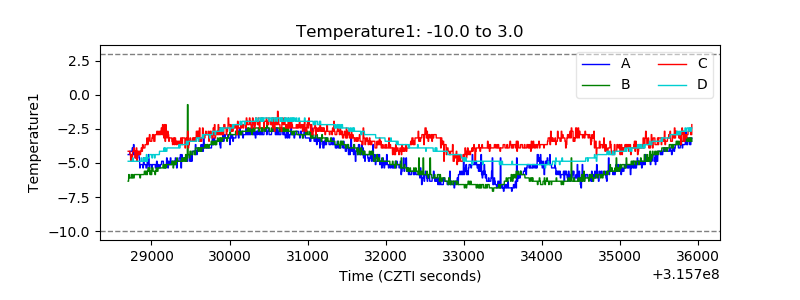 |
| Veto HV Monitor | 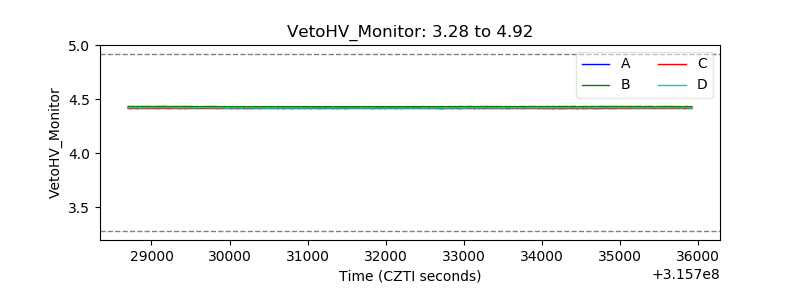 |
| Veto LLD | 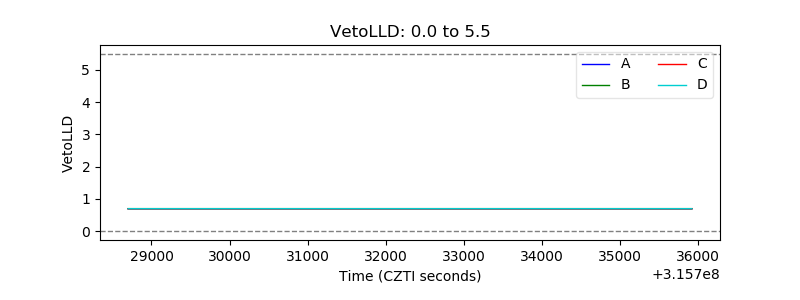 |
| Alpha Counter | 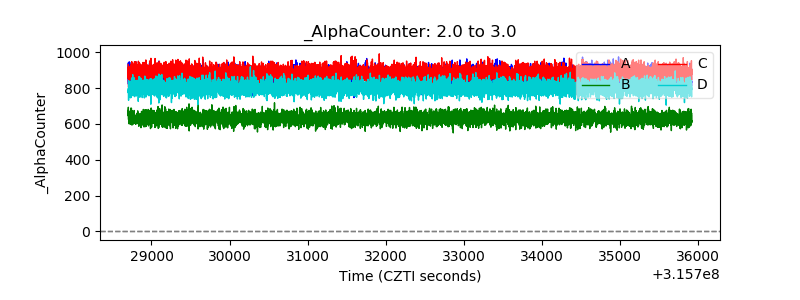 |
| _CPM_Rate | 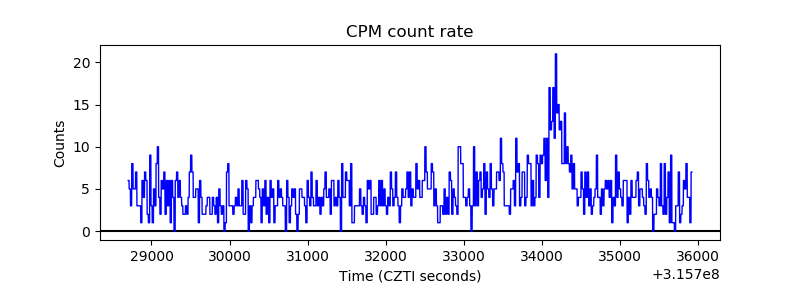 |
| CZT Counter | 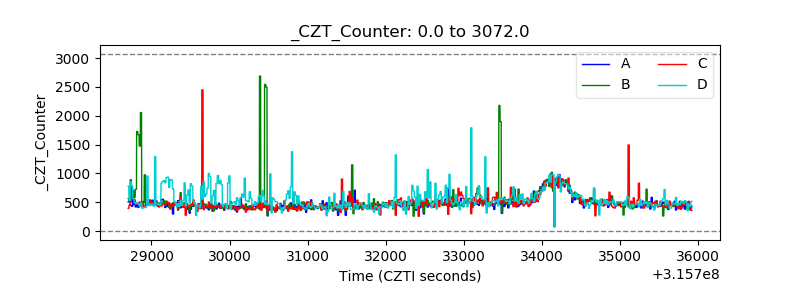 |
| +2.5 Volts monitor |  |
| +5 Volts monitor |  |
| _ROLL_ROT | 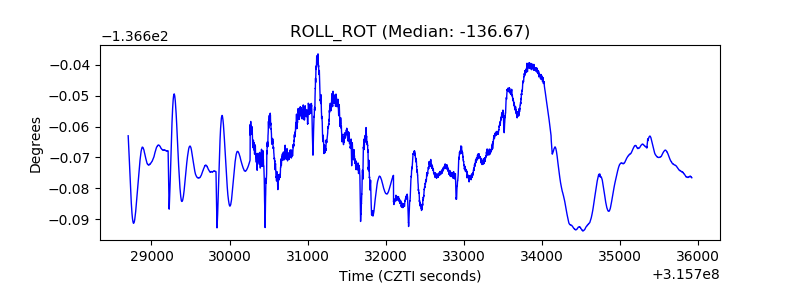 |
| _Roll_DEC | 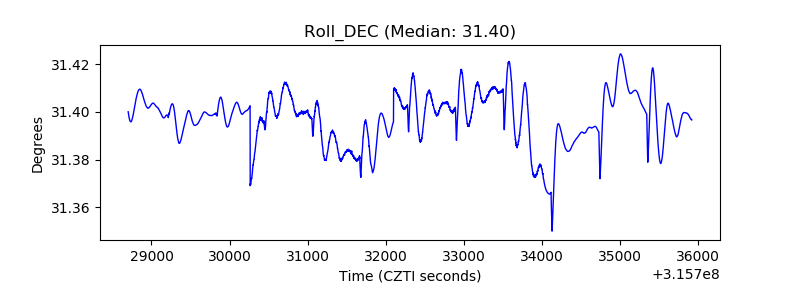 |
| _Roll_RA | 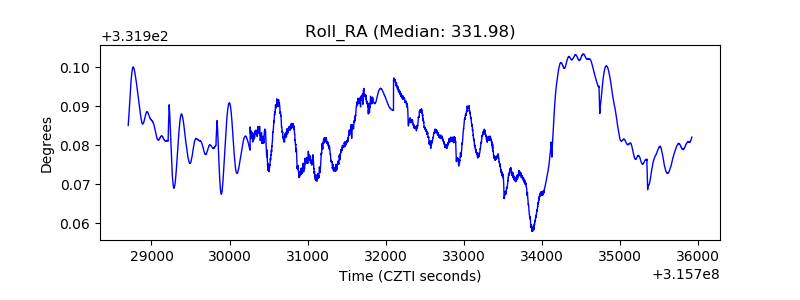 |
| Veto Counter | 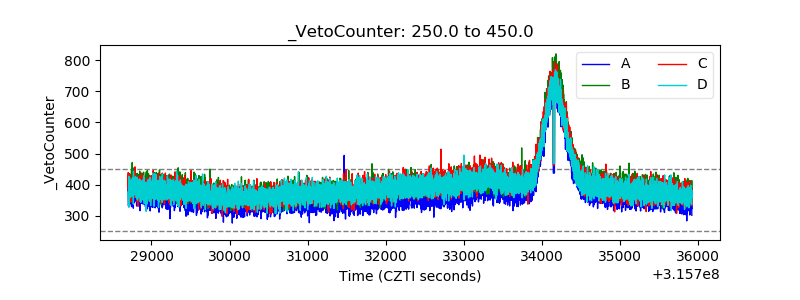 |