| Param | Original file | Final file |
|---|---|---|
| Filename | modeM0/AS1A07_049T01_9000003408_23064cztM0_level2.evt | modeM0/AS1A07_049T01_9000003408_23064cztM0_level2_quad_clean.evt |
| Size (bytes) | 529,369,920 | 102,574,080 |
| Size | 504.8 MB | 97.8 MB |
| Events in quadrant A | 3,502,645 | 656,114 |
| Events in quadrant B | 3,636,062 | 668,414 |
| Events in quadrant C | 3,577,024 | 639,003 |
| Events in quadrant D | 4,806,893 | 620,987 |
| Mode M0 | |||
|---|---|---|---|
| Quadrant | BADHDUFLAG | Total packets | Discarded packets |
| A | 0 | 15393 | 1 |
| B | 0 | 15663 | 1 |
| C | 0 | 15530 | 1 |
| D | 0 | 18966 | 1 |
| Mode M9 | |||
|---|---|---|---|
| Quadrant | BADHDUFLAG | Total packets | Discarded packets |
| A | 0 | 4 | 0 |
| B | 0 | 4 | 0 |
| C | 0 | 4 | 0 |
| D | 0 | 4 | 0 |
| Mode SS | |||
|---|---|---|---|
| Quadrant | BADHDUFLAG | Total packets | Discarded packets |
| A | 0 | 150 | 0 |
| B | 0 | 150 | 0 |
| C | 0 | 150 | 0 |
| D | 0 | 150 | 0 |
| Quadrant | Total seconds | Saturated seconds | Saturation percentage |
|---|---|---|---|
| A | 7509 | 94 | 1.251831% |
| B | 7510 | 137 | 1.824234% |
| C | 7510 | 142 | 1.890812% |
| D | 7510 | 226 | 3.009321% |
Noise dominated data is calculated using 1-second bins in cleaned event files. If a bin has >2000 counts, and if more than 50% of those come from <1% of pixels, then it is considered to be noise-dominated and hence unusable.
| Quadrant | # 1 sec bins | Bins with >0 counts | Bins with >2000 counts | High rate bins dominated by noise | Noise dominated (total time) | Noise dominated (detector-on time) | Marked lightcurve |
|---|---|---|---|---|---|---|---|
| A | 7834 | 7510 | 0 | 0 | 0.00% | 0.00% | 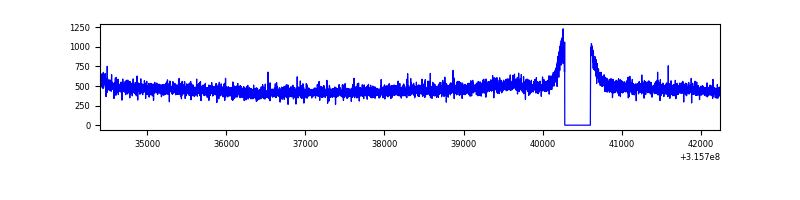 |
| B | 7835 | 7511 | 16 | 16 | 0.20% | 0.21% | 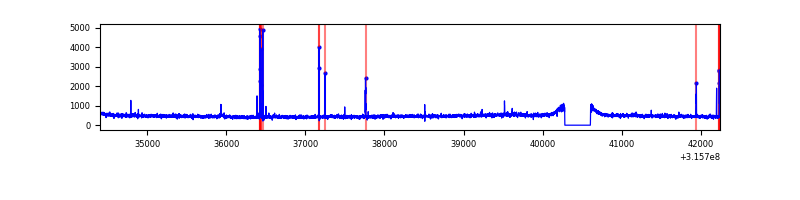 |
| C | 7835 | 7511 | 4 | 4 | 0.05% | 0.05% | 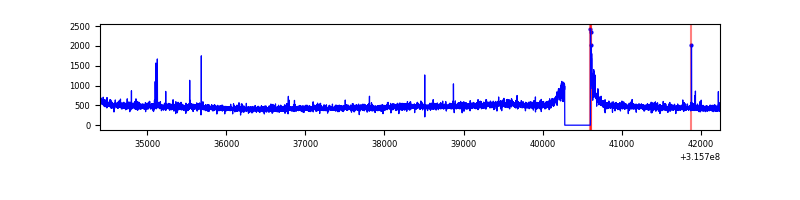 |
| D | 7835 | 7511 | 128 | 128 | 1.63% | 1.70% | 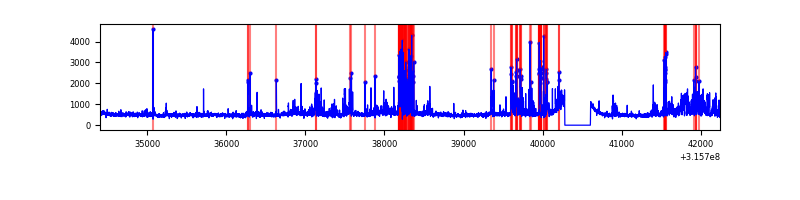 |
Top three noisy pixels from each quadrant. If the there are fewer than three noisy pixels in the level2.evt file, extra rows are filled as -1
| Pixel properties | Quadrant properties | ||||||
|---|---|---|---|---|---|---|---|
| Quadrant | DetID | PixID | Counts | Sigma | Mean | Median | Sigma |
| A | 13 | 254 | 10840 | 54.1 | 906 | 885 | 184.0 |
| A | 3 | 137 | 8373 | 40.69 | 906 | 885 | 184.0 |
| A | 6 | 16 | 8200 | 39.75 | 906 | 885 | 184.0 |
| B | 4 | 216 | 72022 | 407.73 | 899 | 874 | 174.5 |
| B | 12 | 111 | 21720 | 119.46 | 899 | 874 | 174.5 |
| B | 11 | 111 | 19807 | 108.5 | 899 | 874 | 174.5 |
| C | 14 | 238 | 136248 | 661.24 | 864 | 867 | 204.7 |
| C | 10 | 22 | 26383 | 124.62 | 864 | 867 | 204.7 |
| C | 0 | 10 | 16285 | 75.3 | 864 | 867 | 204.7 |
| D | 1 | 52 | 936617 | 4387.11 | 873 | 844 | 213.3 |
| D | 1 | 239 | 386499 | 1808.03 | 873 | 844 | 213.3 |
| D | 13 | 174 | 105675 | 491.47 | 873 | 844 | 213.3 |
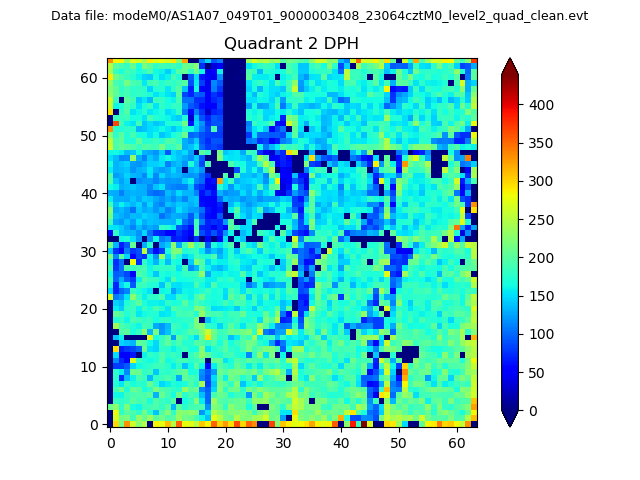
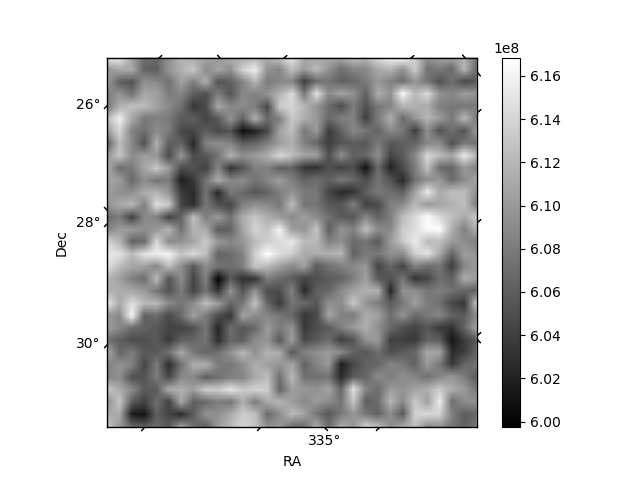
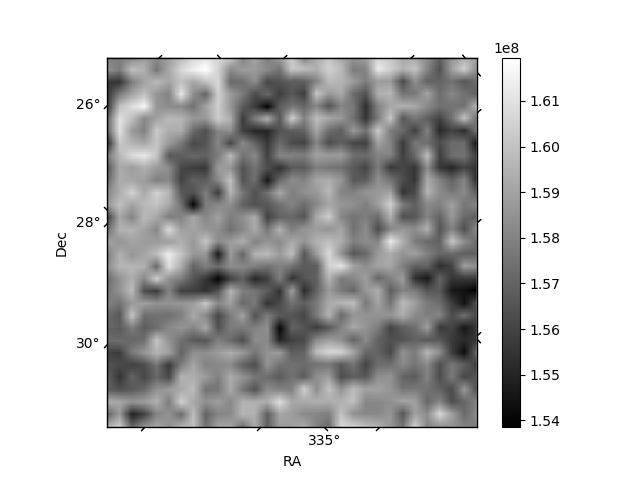
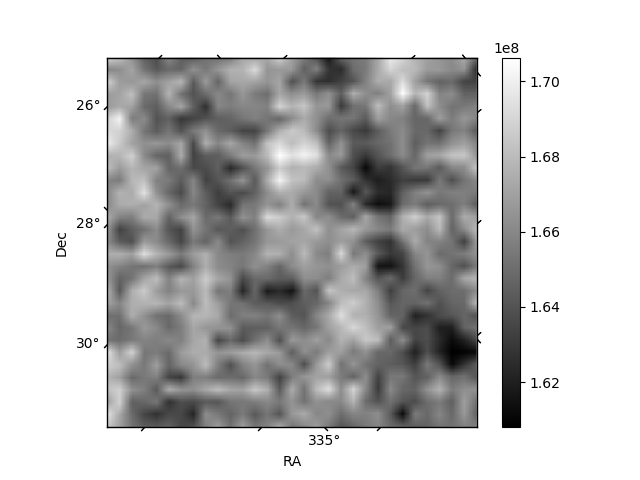
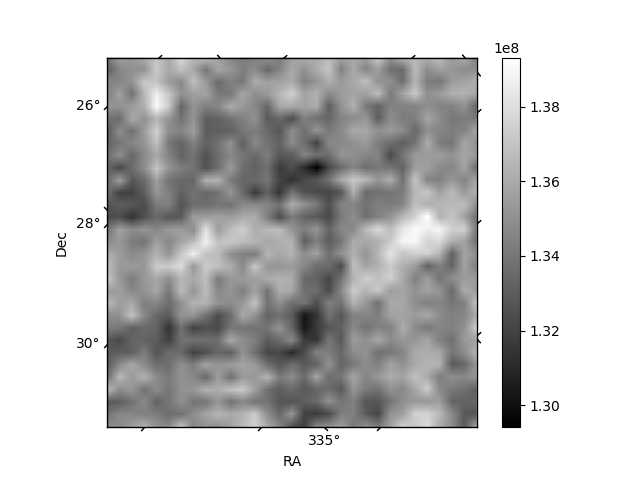
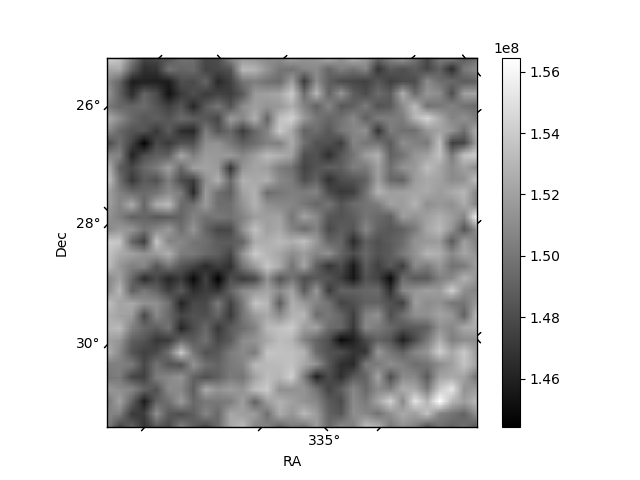
Histogram calculated using DETX and DETY for each event in the final _common_clean file
| Quadrant A | 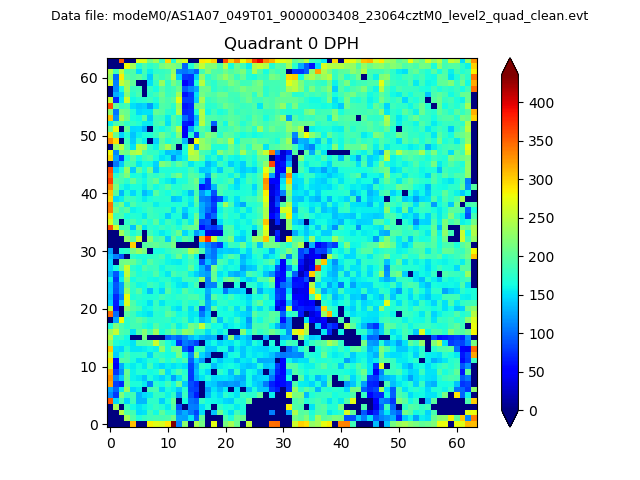 |
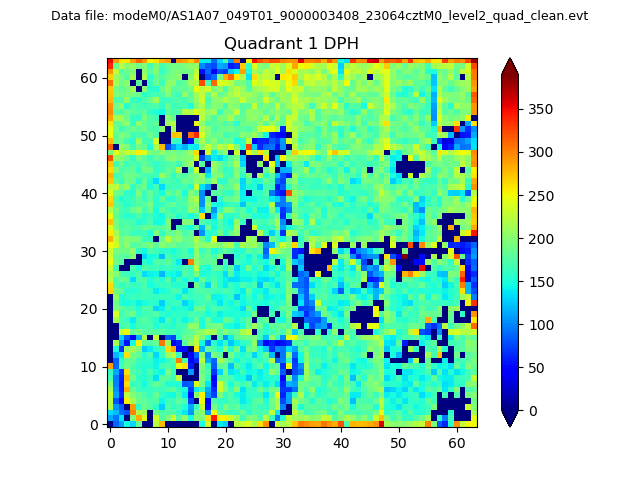 |
Quadrant B |
|---|---|---|---|
| Quadrant D | 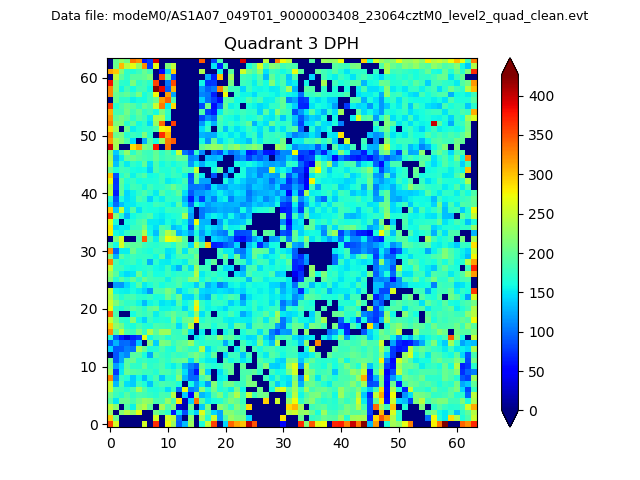 |
 |
Quadrant C |
| Plot type | Count rate plots | Images |
|---|---|---|
| Comparison with Poisson distribution Blue bars denote a histogram of data divided into 1 sec bins. Red curve is a Poisson curve with rate = median count rate of data. |
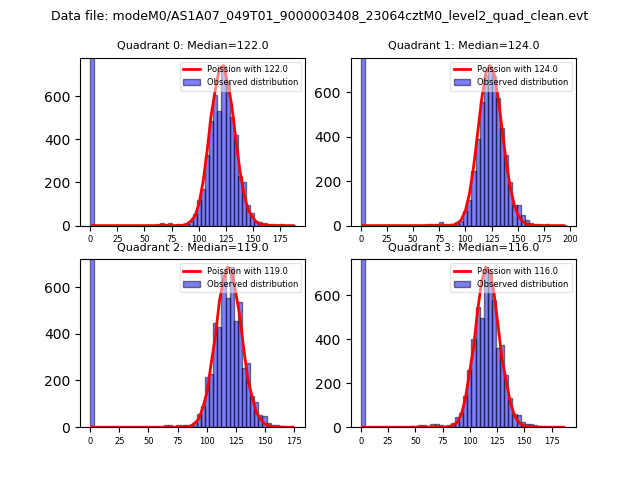 |
 |
| Quadrant-wise count rates Data is divided into 100 sec bins |
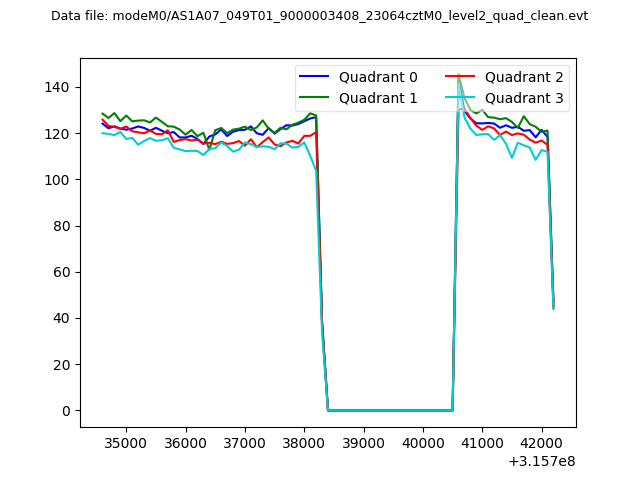 |
|
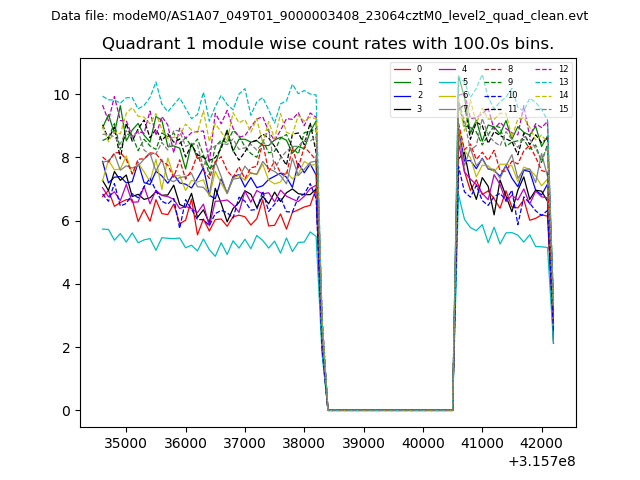
| Module-wise count rates for Quadrant A Data is divided into 100 sec bins |
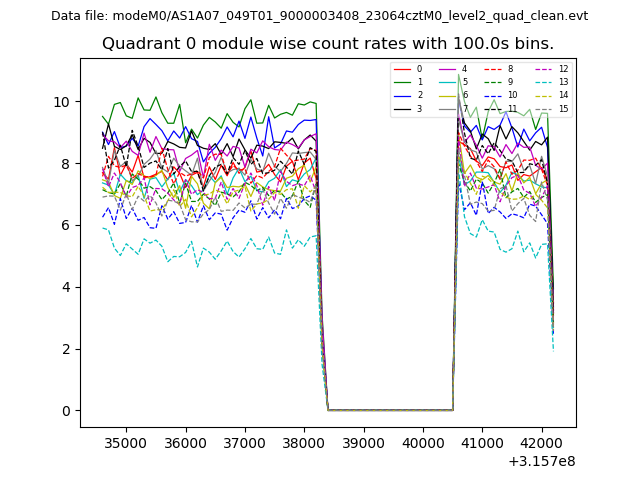 |
 |
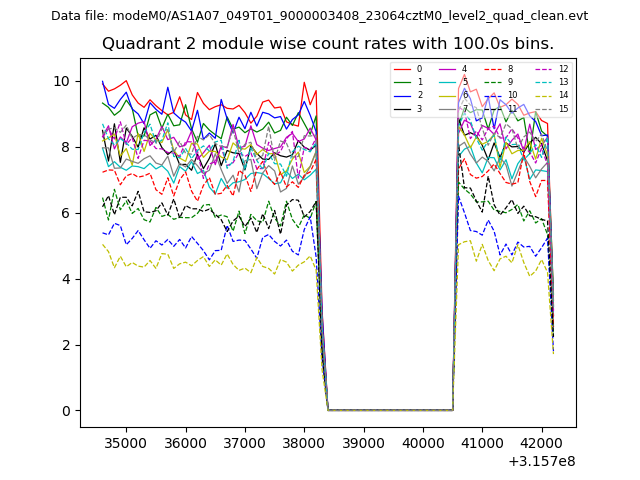
| Module-wise count rates for Quadrant B Data is divided into 100 sec bins |
 |
 |
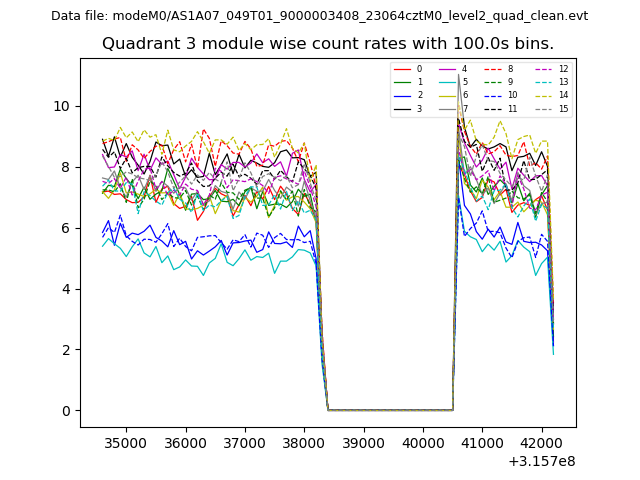
| Module-wise count rates for Quadrant C Data is divided into 100 sec bins |
 |
 |
| Module-wise count rates for Quadrant D Data is divided into 100 sec bins |
 |
 |
| Parameter | Plot |
|---|---|
| CZT HV Monitor | 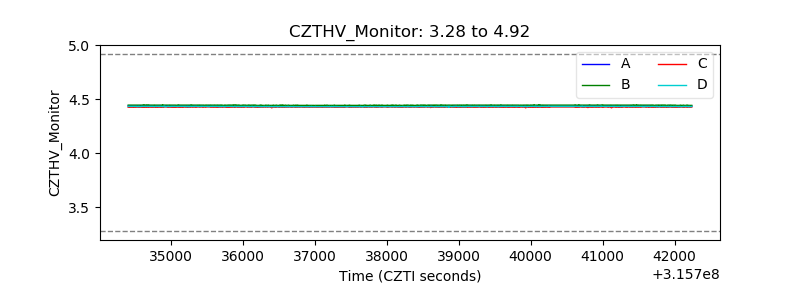 |
| D_VDD | 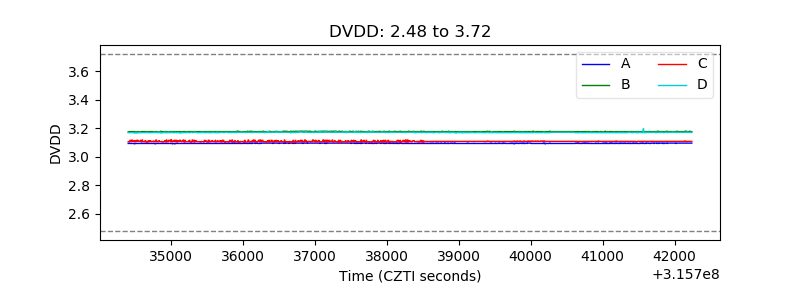 |
| Temperature 1 | 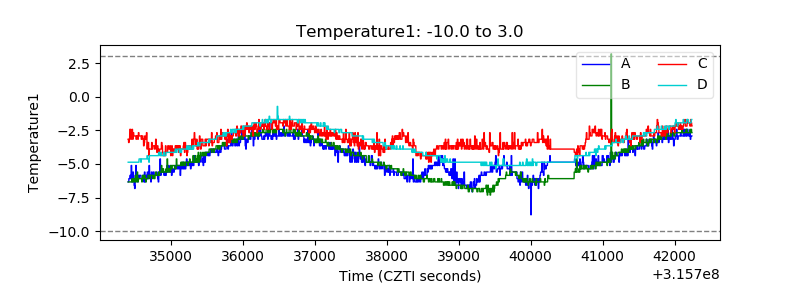 |
| Veto HV Monitor | 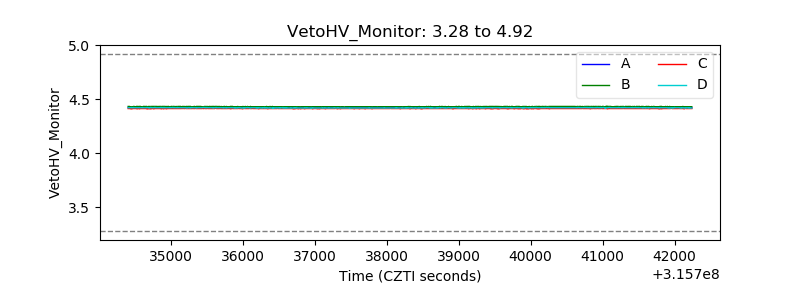 |
| Veto LLD | 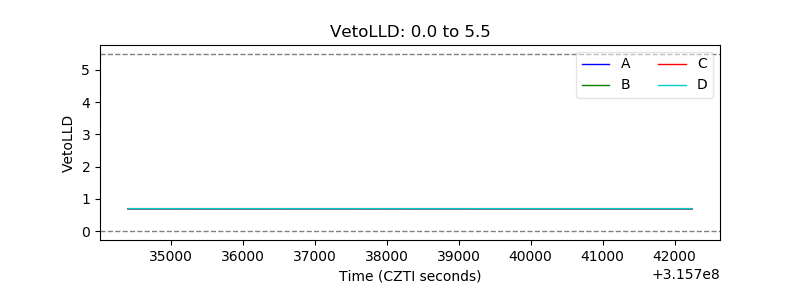 |
| Alpha Counter | 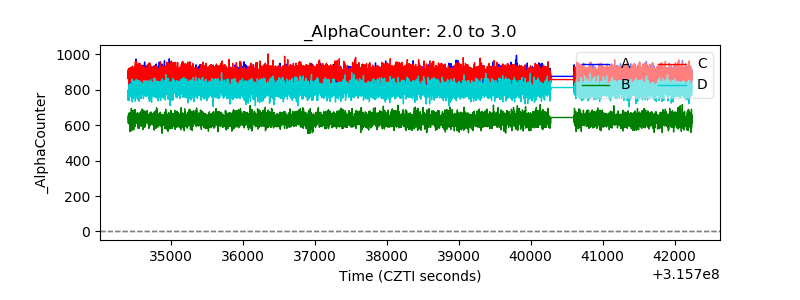 |
| _CPM_Rate | 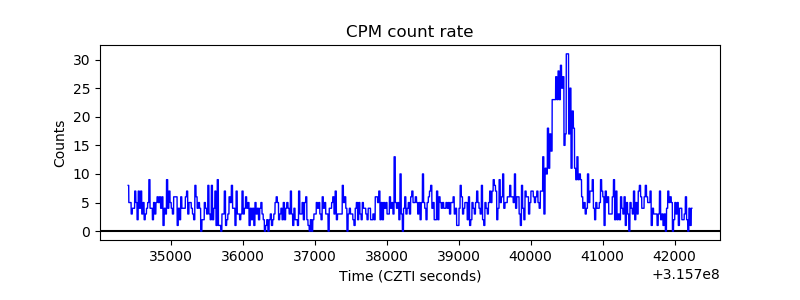 |
| CZT Counter | 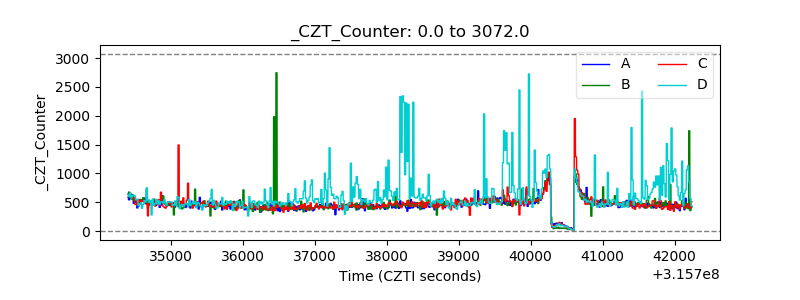 |
| +2.5 Volts monitor |  |
| +5 Volts monitor | 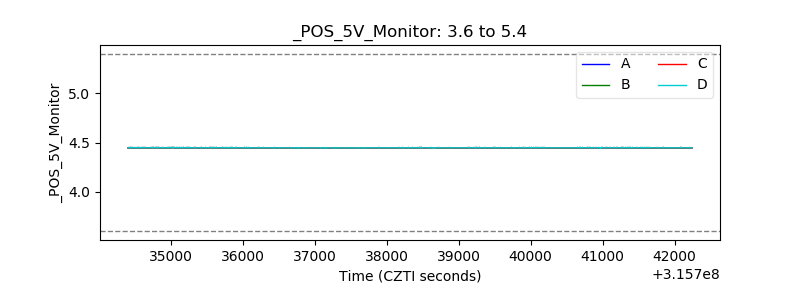 |
| _ROLL_ROT | 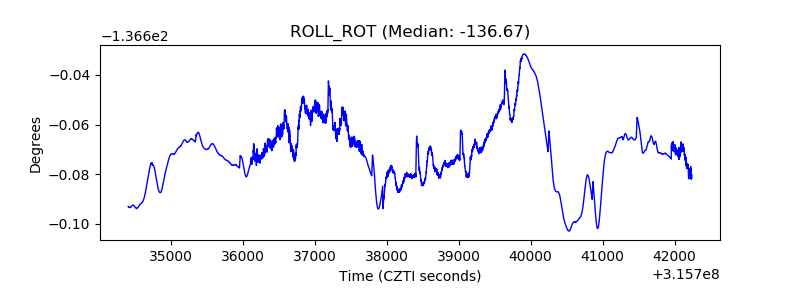 |
| _Roll_DEC | 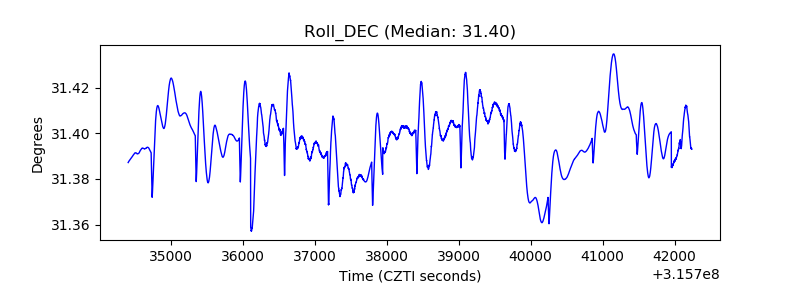 |
| _Roll_RA | 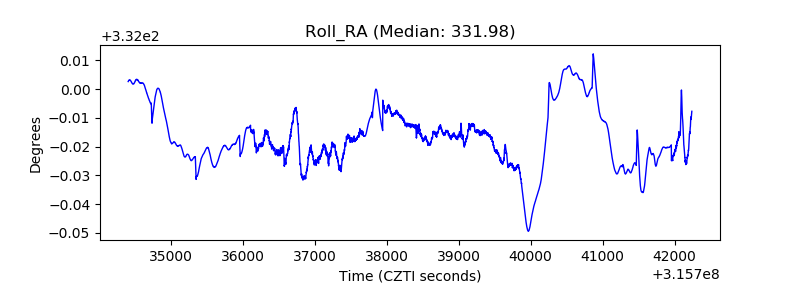 |
| Veto Counter | 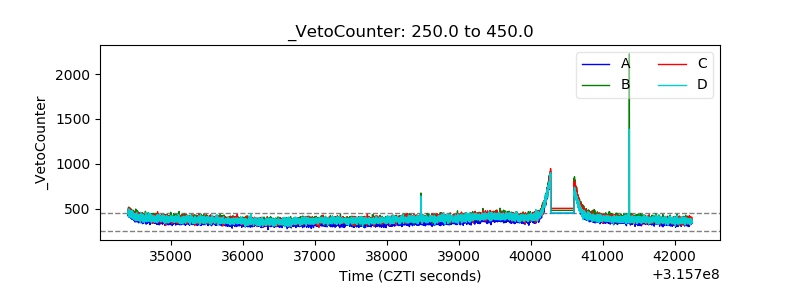 |