| Param | Original file | Final file |
|---|---|---|
| Filename | modeM0/AS1A07_049T01_9000003408_23066cztM0_level2.evt | modeM0/AS1A07_049T01_9000003408_23066cztM0_level2_quad_clean.evt |
| Size (bytes) | 1,012,924,800 | 156,116,160 |
| Size | 966.0 MB | 148.9 MB |
| Events in quadrant A | 5,880,046 | 1,004,336 |
| Events in quadrant B | 6,341,930 | 1,002,761 |
| Events in quadrant C | 5,921,915 | 967,611 |
| Events in quadrant D | 11,696,577 | 897,530 |
| Mode M0 | |||
|---|---|---|---|
| Quadrant | BADHDUFLAG | Total packets | Discarded packets |
| A | 0 | 25762 | 2 |
| B | 0 | 27086 | 2 |
| C | 0 | 25754 | 2 |
| D | 0 | 43114 | 2 |
| Mode M9 | |||
|---|---|---|---|
| Quadrant | BADHDUFLAG | Total packets | Discarded packets |
| A | 0 | 12 | 0 |
| B | 0 | 12 | 0 |
| C | 0 | 12 | 0 |
| D | 0 | 12 | 0 |
| Mode SS | |||
|---|---|---|---|
| Quadrant | BADHDUFLAG | Total packets | Discarded packets |
| A | 0 | 252 | 0 |
| B | 0 | 252 | 0 |
| C | 0 | 252 | 0 |
| D | 0 | 252 | 0 |
| Quadrant | Total seconds | Saturated seconds | Saturation percentage |
|---|---|---|---|
| A | 12368 | 163 | 1.317917% |
| B | 12369 | 289 | 2.336486% |
| C | 12369 | 196 | 1.584607% |
| D | 12369 | 1402 | 11.334789% |
Noise dominated data is calculated using 1-second bins in cleaned event files. If a bin has >2000 counts, and if more than 50% of those come from <1% of pixels, then it is considered to be noise-dominated and hence unusable.
| Quadrant | # 1 sec bins | Bins with >0 counts | Bins with >2000 counts | High rate bins dominated by noise | Noise dominated (total time) | Noise dominated (detector-on time) | Marked lightcurve |
|---|---|---|---|---|---|---|---|
| A | 13628 | 12370 | 32 | 32 | 0.23% | 0.26% | 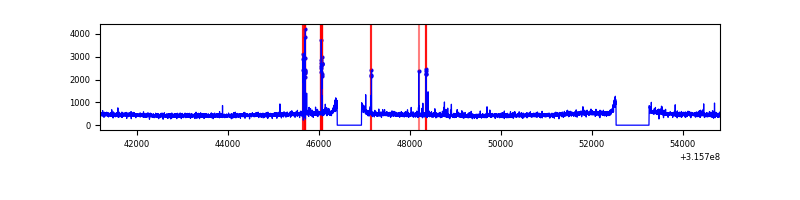 |
| B | 13629 | 12371 | 102 | 102 | 0.75% | 0.82% | 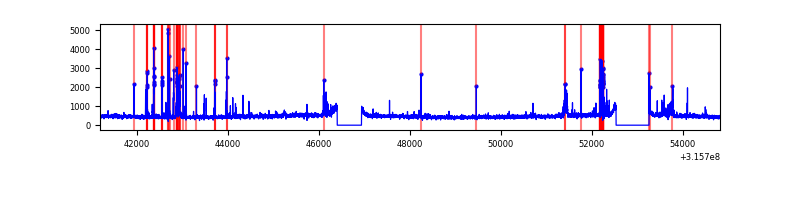 |
| C | 13629 | 12371 | 12 | 12 | 0.09% | 0.10% | 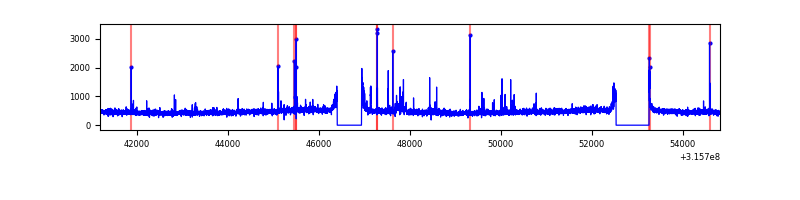 |
| D | 13629 | 12371 | 1253 | 1253 | 9.19% | 10.13% | 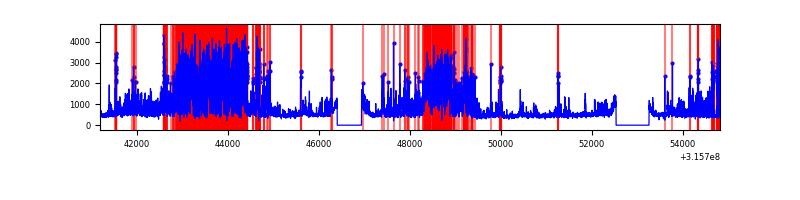 |
Top three noisy pixels from each quadrant. If the there are fewer than three noisy pixels in the level2.evt file, extra rows are filled as -1
| Pixel properties | Quadrant properties | ||||||
|---|---|---|---|---|---|---|---|
| Quadrant | DetID | PixID | Counts | Sigma | Mean | Median | Sigma |
| A | 6 | 16 | 212636 | 714.17 | 1470 | 1434 | 295.7 |
| A | 13 | 254 | 17288 | 53.61 | 1470 | 1434 | 295.7 |
| A | 3 | 137 | 13573 | 41.05 | 1470 | 1434 | 295.7 |
| B | 3 | 64 | 470051 | 1689.62 | 1450 | 1415 | 277.4 |
| B | 4 | 216 | 81846 | 289.99 | 1450 | 1415 | 277.4 |
| B | 4 | 173 | 55644 | 195.52 | 1450 | 1415 | 277.4 |
| C | 14 | 238 | 221596 | 671.45 | 1407 | 1412 | 327.9 |
| C | 0 | 207 | 105618 | 317.78 | 1407 | 1412 | 327.9 |
| C | 0 | 10 | 50632 | 150.1 | 1407 | 1412 | 327.9 |
| D | 1 | 239 | 3902229 | 11470.74 | 1390 | 1349 | 340.1 |
| D | 1 | 52 | 2155192 | 6333.48 | 1390 | 1349 | 340.1 |
| D | 2 | 136 | 149230 | 434.85 | 1390 | 1349 | 340.1 |
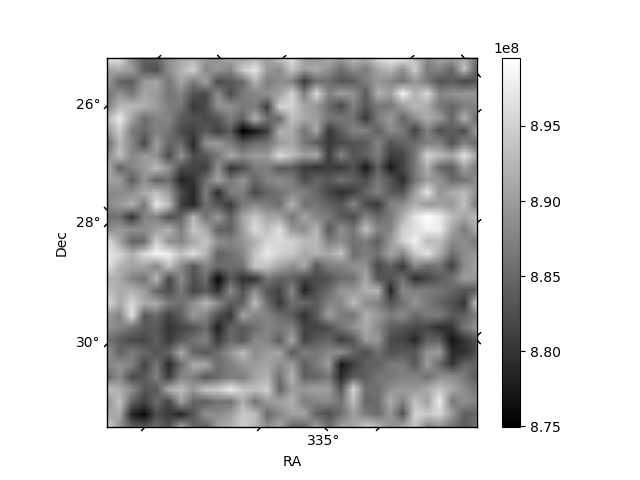
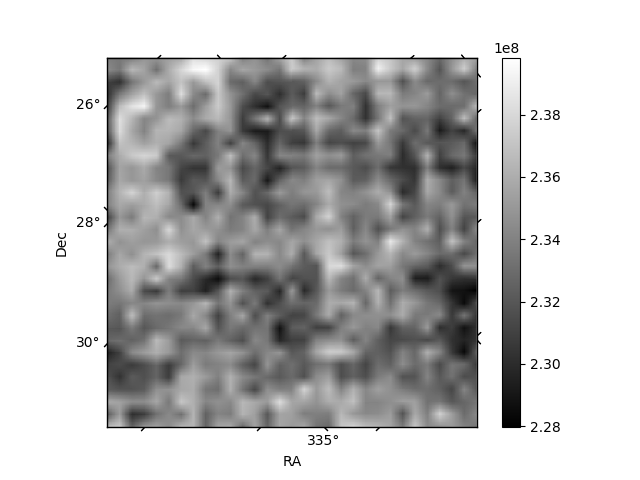
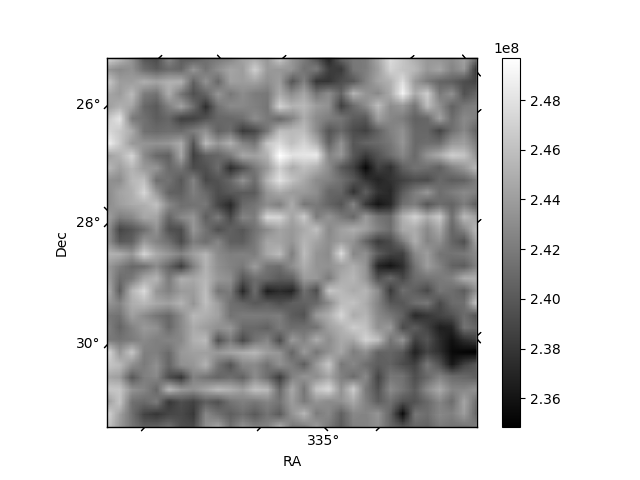
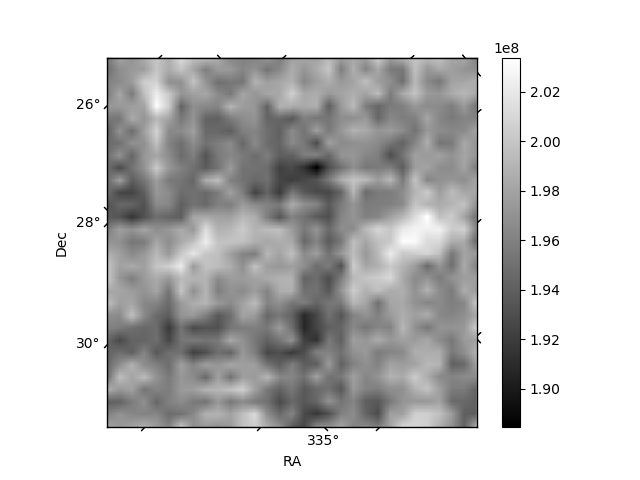
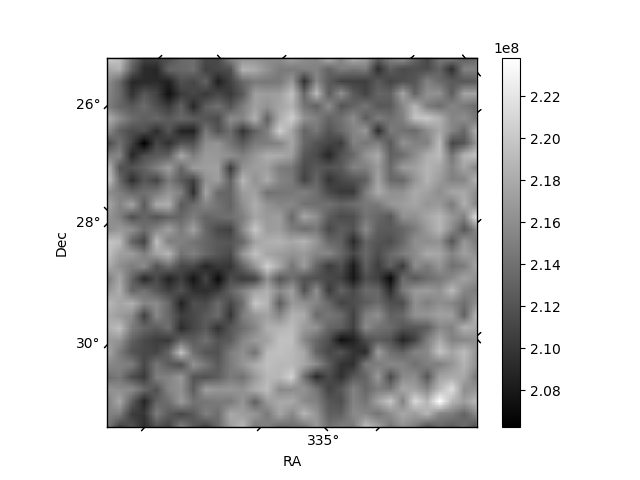
Histogram calculated using DETX and DETY for each event in the final _common_clean file
| Quadrant A | 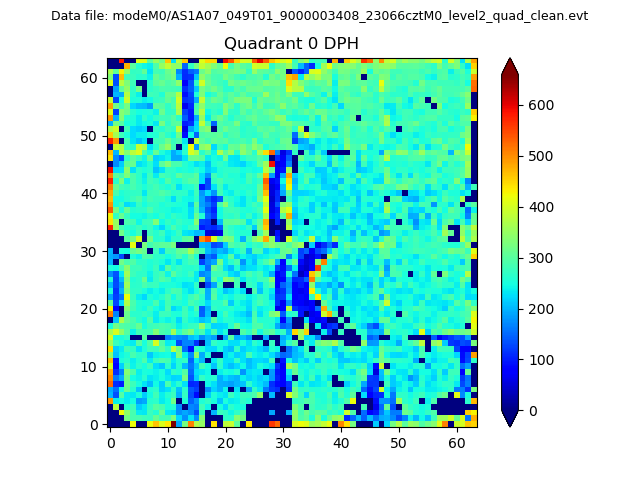 |
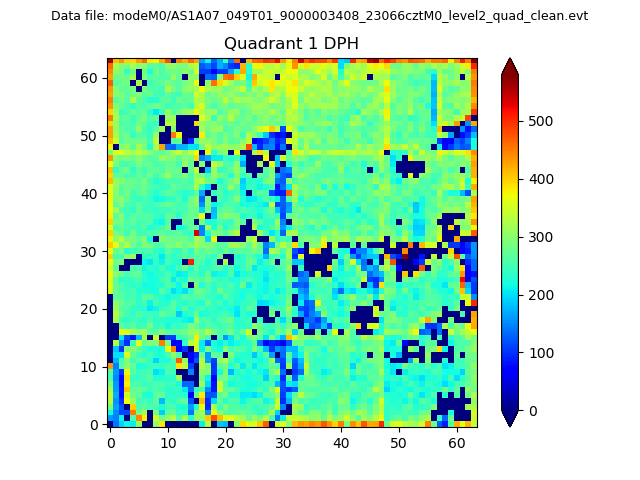 |
Quadrant B |
|---|---|---|---|
| Quadrant D |  |
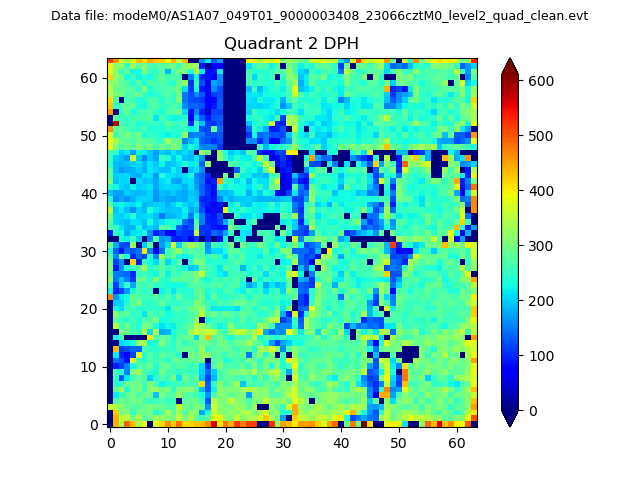 |
Quadrant C |
| Plot type | Count rate plots | Images |
|---|---|---|
| Comparison with Poisson distribution Blue bars denote a histogram of data divided into 1 sec bins. Red curve is a Poisson curve with rate = median count rate of data. |
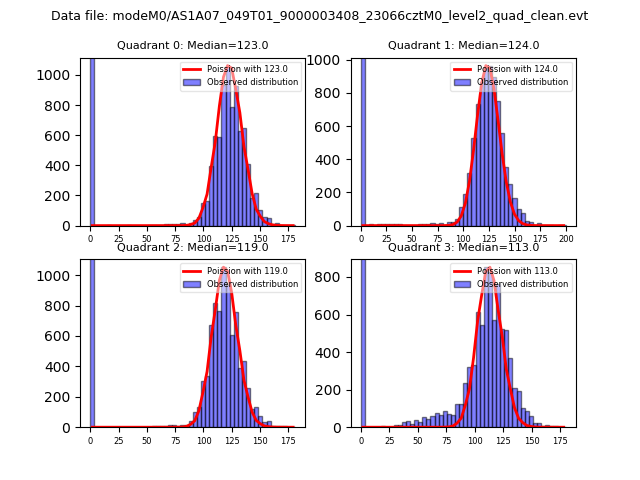 |
 |
| Quadrant-wise count rates Data is divided into 100 sec bins |
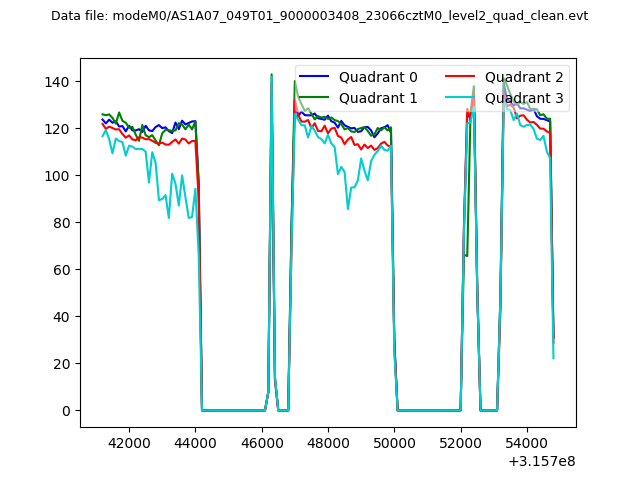 |
|
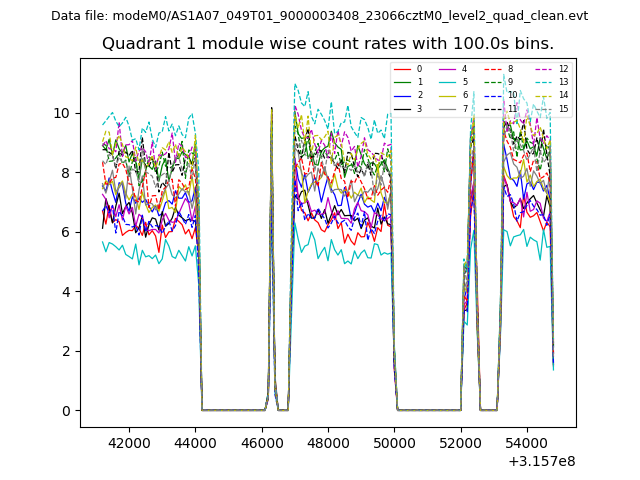
| Module-wise count rates for Quadrant A Data is divided into 100 sec bins |
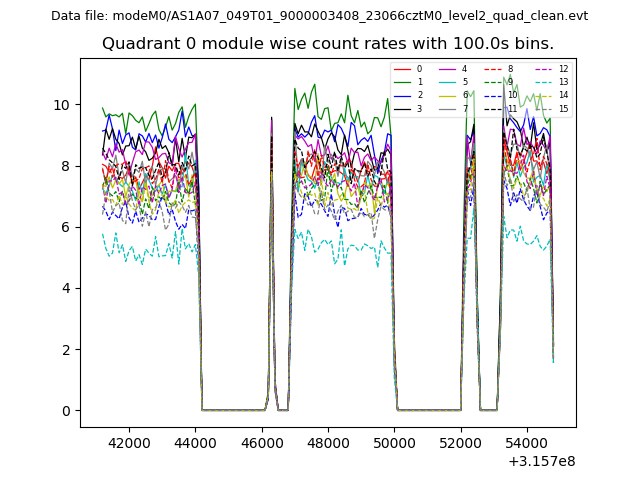 |
 |
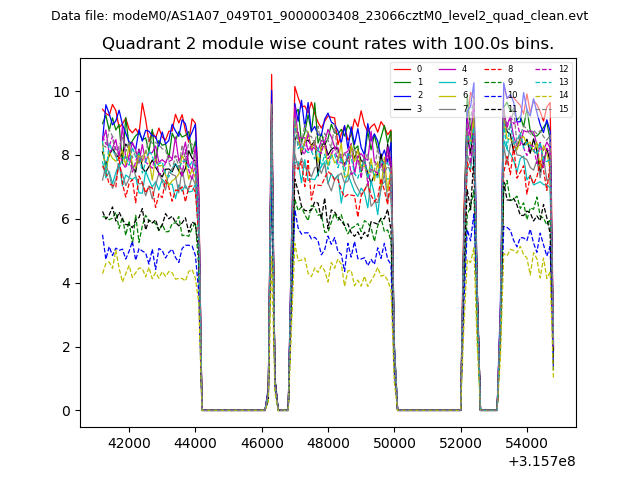
| Module-wise count rates for Quadrant B Data is divided into 100 sec bins |
 |
 |
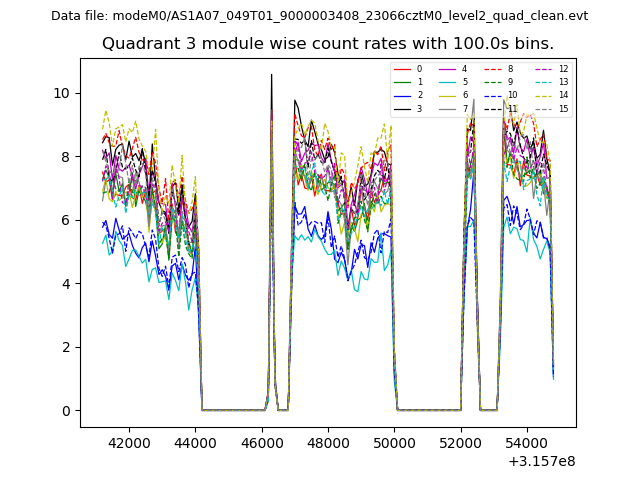
| Module-wise count rates for Quadrant C Data is divided into 100 sec bins |
 |
 |
| Module-wise count rates for Quadrant D Data is divided into 100 sec bins |
 |
 |
| Parameter | Plot |
|---|---|
| CZT HV Monitor | 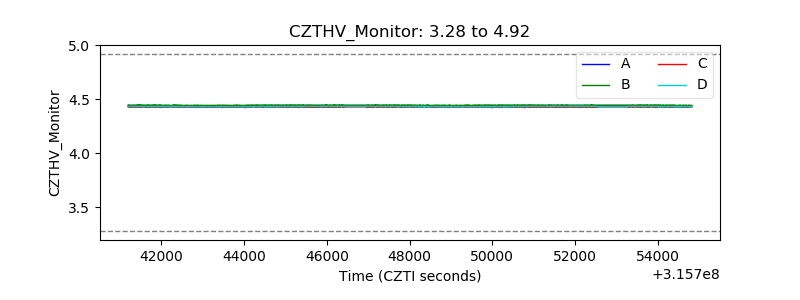 |
| D_VDD | 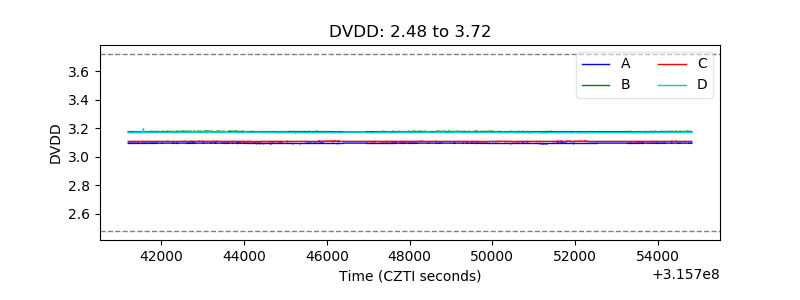 |
| Temperature 1 | 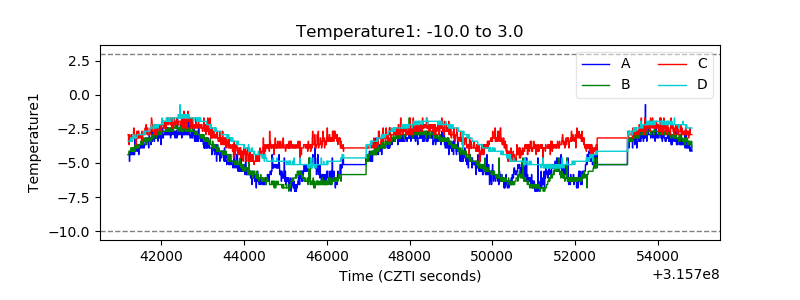 |
| Veto HV Monitor | 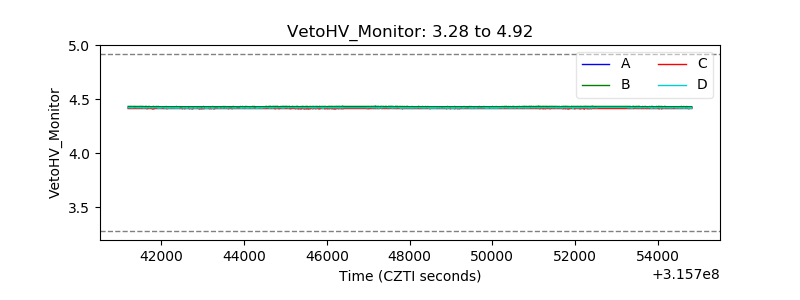 |
| Veto LLD | 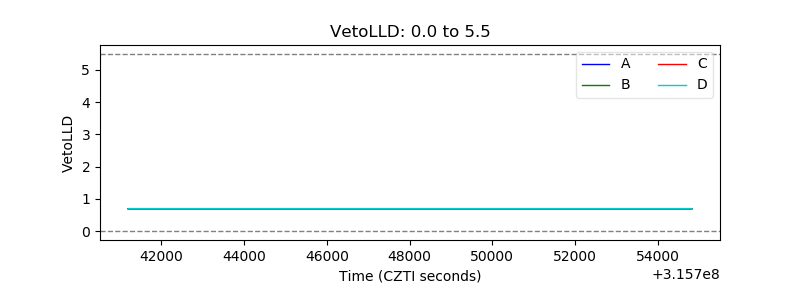 |
| Alpha Counter | 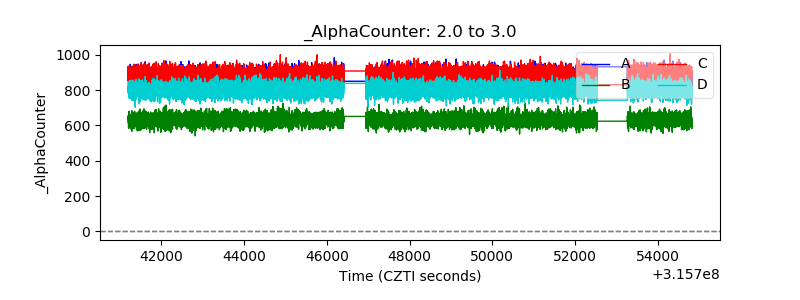 |
| _CPM_Rate | 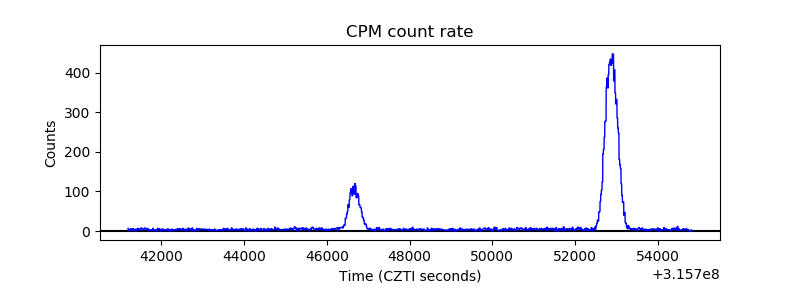 |
| CZT Counter | 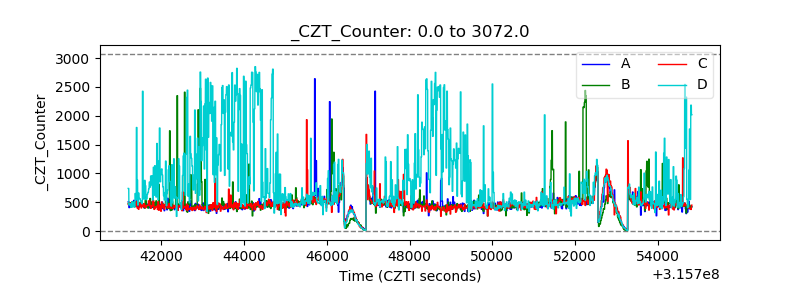 |
| +2.5 Volts monitor |  |
| +5 Volts monitor | 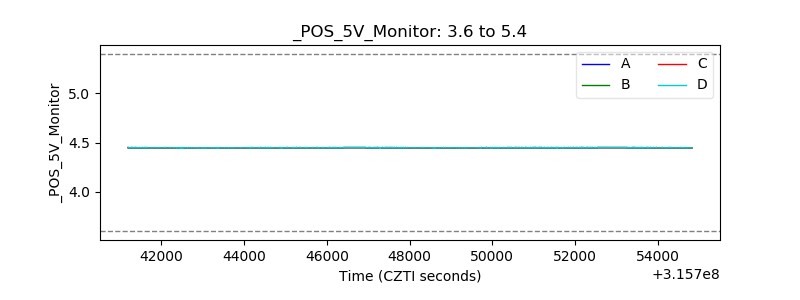 |
| _ROLL_ROT | 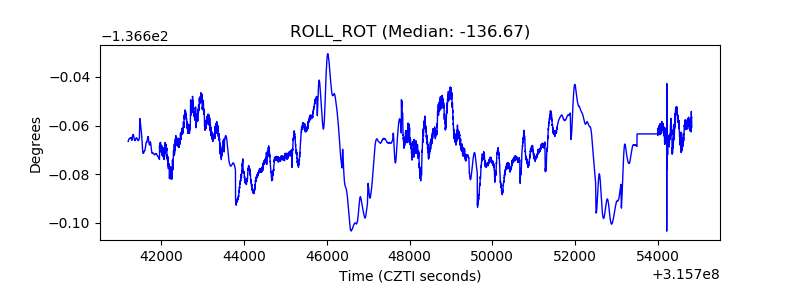 |
| _Roll_DEC | 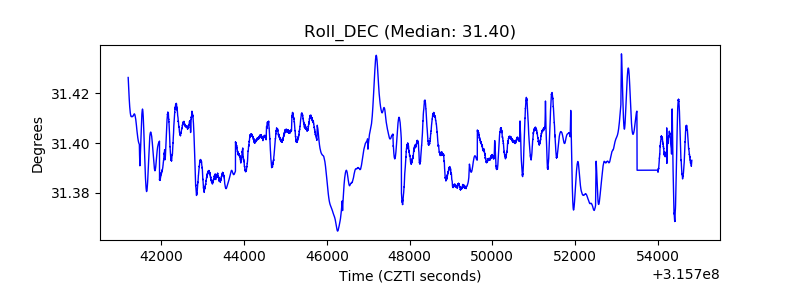 |
| _Roll_RA | 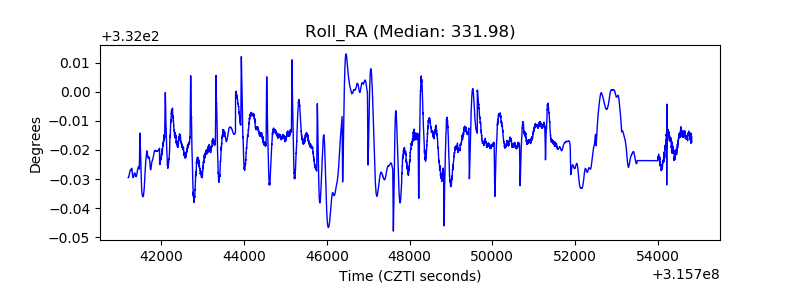 |
| Veto Counter | 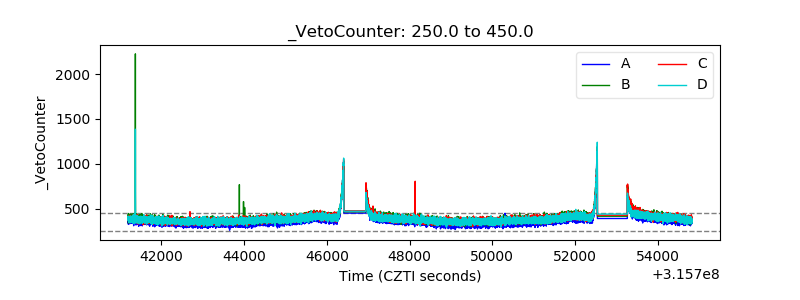 |