| Param | Original file | Final file |
|---|---|---|
| Filename | modeM0/AS1A07_049T01_9000003408_23067cztM0_level2.evt | modeM0/AS1A07_049T01_9000003408_23067cztM0_level2_quad_clean.evt |
| Size (bytes) | 547,473,600 | 83,237,760 |
| Size | 522.1 MB | 79.4 MB |
| Events in quadrant A | 3,148,448 | 546,275 |
| Events in quadrant B | 3,118,554 | 553,684 |
| Events in quadrant C | 3,116,474 | 526,344 |
| Events in quadrant D | 6,765,537 | 449,895 |
| Mode M0 | |||
|---|---|---|---|
| Quadrant | BADHDUFLAG | Total packets | Discarded packets |
| A | 0 | 13516 | 0 |
| B | 0 | 13337 | 0 |
| C | 0 | 13357 | 0 |
| D | 0 | 24495 | 0 |
| Mode M9 | |||
|---|---|---|---|
| Quadrant | BADHDUFLAG | Total packets | Discarded packets |
| A | 0 | 10 | 0 |
| B | 0 | 10 | 0 |
| C | 0 | 10 | 0 |
| D | 0 | 10 | 0 |
| Mode SS | |||
|---|---|---|---|
| Quadrant | BADHDUFLAG | Total packets | Discarded packets |
| A | 0 | 130 | 0 |
| B | 0 | 130 | 0 |
| C | 0 | 130 | 0 |
| D | 0 | 130 | 0 |
| Quadrant | Total seconds | Saturated seconds | Saturation percentage |
|---|---|---|---|
| A | 6358 | 27 | 0.424662% |
| B | 6359 | 50 | 0.786287% |
| C | 6359 | 99 | 1.556849% |
| D | 6359 | 987 | 15.521308% |
Noise dominated data is calculated using 1-second bins in cleaned event files. If a bin has >2000 counts, and if more than 50% of those come from <1% of pixels, then it is considered to be noise-dominated and hence unusable.
| Quadrant | # 1 sec bins | Bins with >0 counts | Bins with >2000 counts | High rate bins dominated by noise | Noise dominated (total time) | Noise dominated (detector-on time) | Marked lightcurve |
|---|---|---|---|---|---|---|---|
| A | 7303 | 6359 | 5 | 5 | 0.07% | 0.08% | 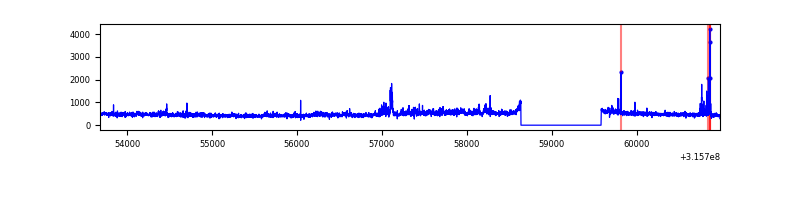 |
| B | 7304 | 6360 | 17 | 17 | 0.23% | 0.27% | 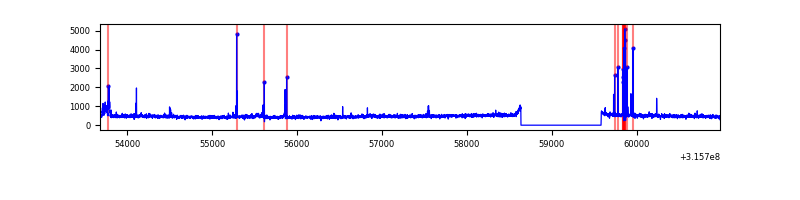 |
| C | 7304 | 6360 | 13 | 13 | 0.18% | 0.20% | 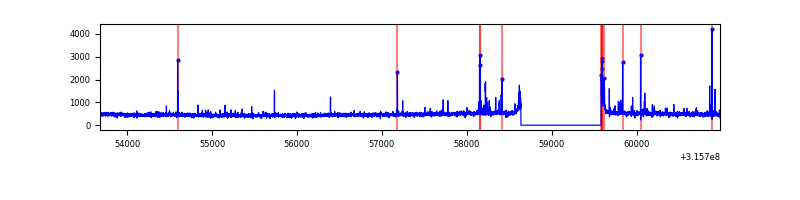 |
| D | 7304 | 6360 | 890 | 890 | 12.19% | 13.99% | 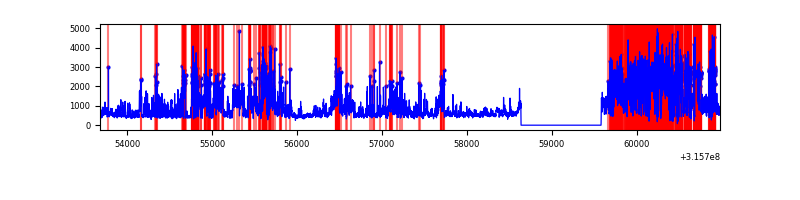 |
Top three noisy pixels from each quadrant. If the there are fewer than three noisy pixels in the level2.evt file, extra rows are filled as -1
| Pixel properties | Quadrant properties | ||||||
|---|---|---|---|---|---|---|---|
| Quadrant | DetID | PixID | Counts | Sigma | Mean | Median | Sigma |
| A | 6 | 16 | 242225 | 1591.45 | 754 | 738 | 151.7 |
| A | 13 | 254 | 9009 | 54.51 | 754 | 738 | 151.7 |
| A | 3 | 137 | 6847 | 40.26 | 754 | 738 | 151.7 |
| B | 3 | 64 | 83233 | 574.98 | 748 | 729 | 143.5 |
| B | 4 | 216 | 67333 | 464.17 | 748 | 729 | 143.5 |
| B | 12 | 111 | 17461 | 116.61 | 748 | 729 | 143.5 |
| C | 0 | 207 | 127578 | 744.64 | 725 | 729 | 170.3 |
| C | 14 | 238 | 115349 | 672.85 | 725 | 729 | 170.3 |
| C | 0 | 10 | 45976 | 265.61 | 725 | 729 | 170.3 |
| D | 1 | 239 | 3696368 | 21729.57 | 685 | 662 | 170.1 |
| D | 1 | 52 | 417981 | 2453.7 | 685 | 662 | 170.1 |
| D | 9 | 85 | 26328 | 150.91 | 685 | 662 | 170.1 |
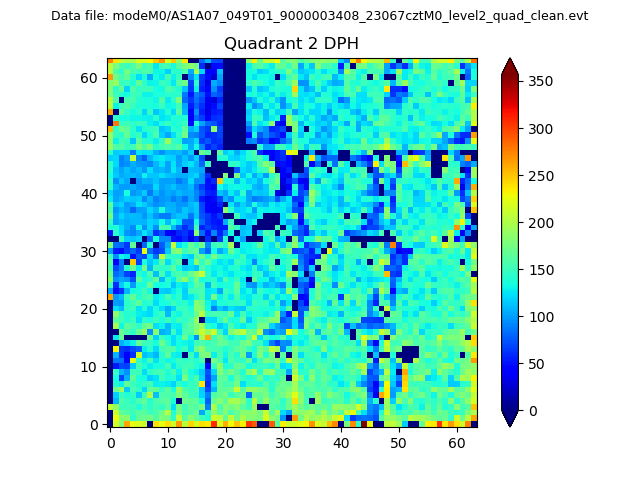
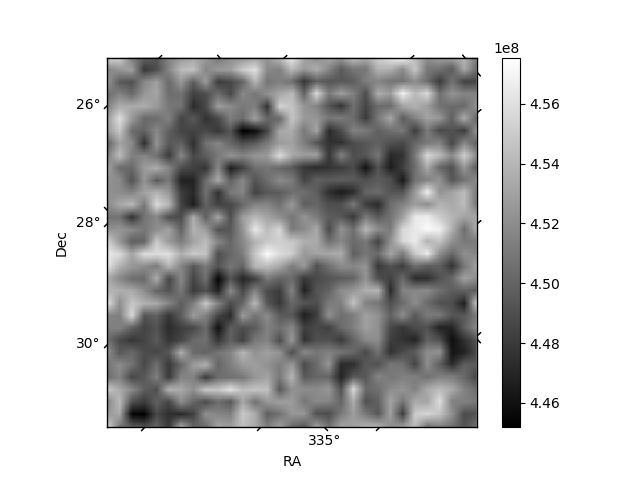
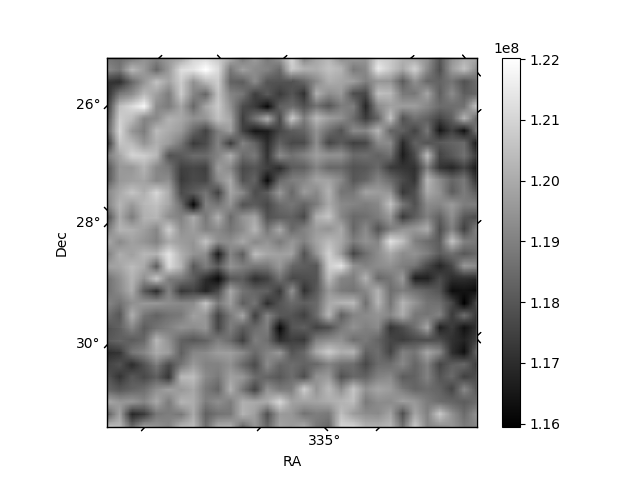
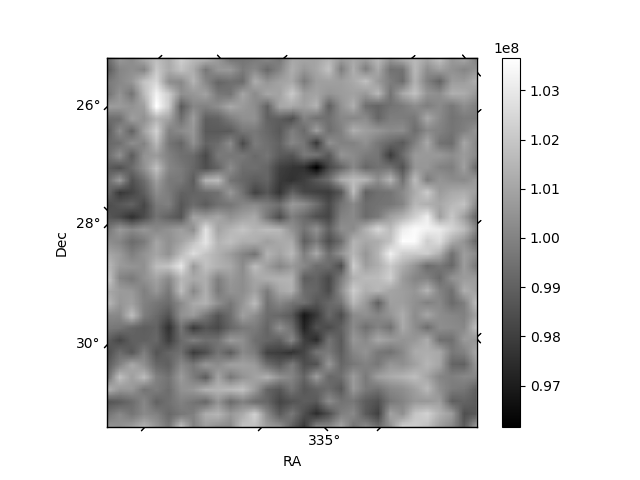
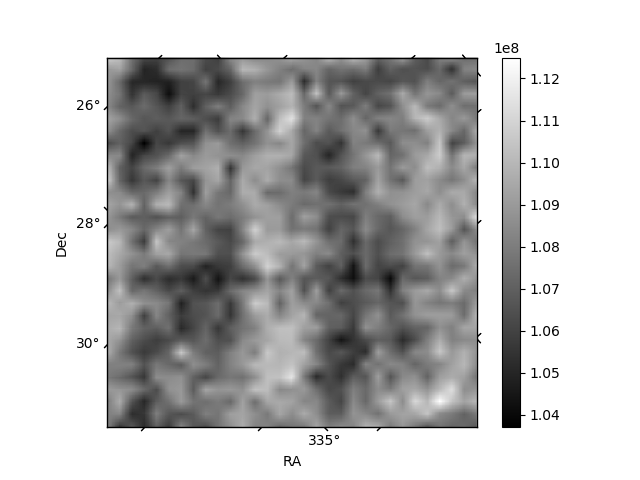
Histogram calculated using DETX and DETY for each event in the final _common_clean file
| Quadrant A | 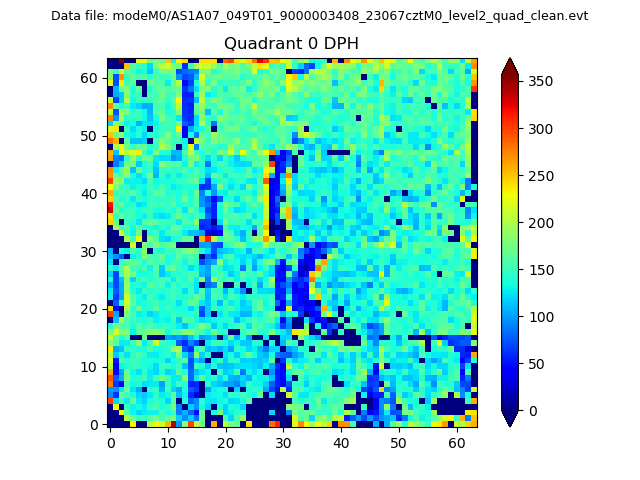 |
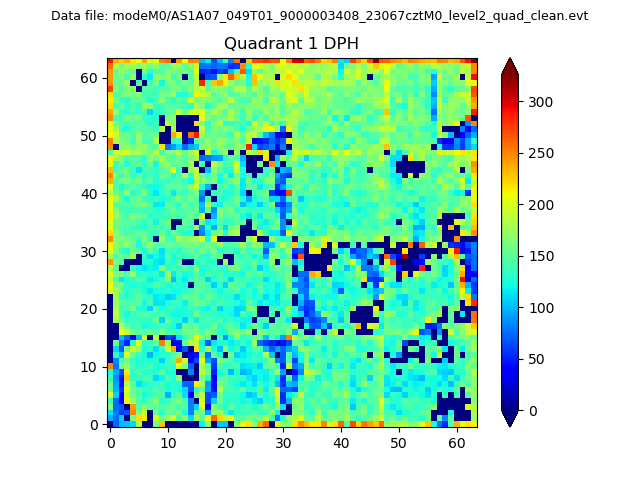 |
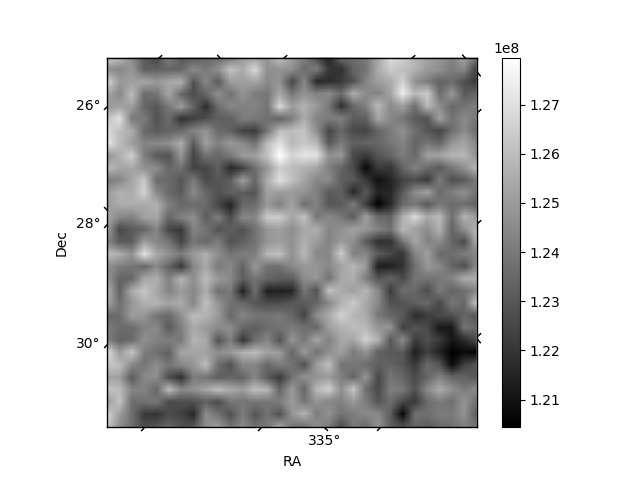
Quadrant B |
|---|---|---|---|
| Quadrant D | 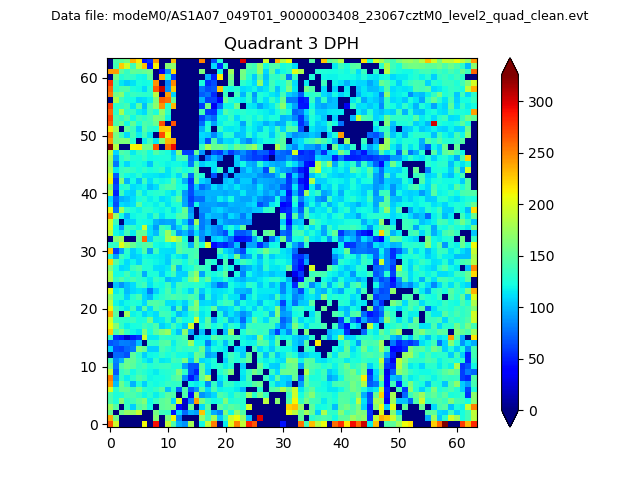 |
 |
Quadrant C |
| Plot type | Count rate plots | Images |
|---|---|---|
| Comparison with Poisson distribution Blue bars denote a histogram of data divided into 1 sec bins. Red curve is a Poisson curve with rate = median count rate of data. |
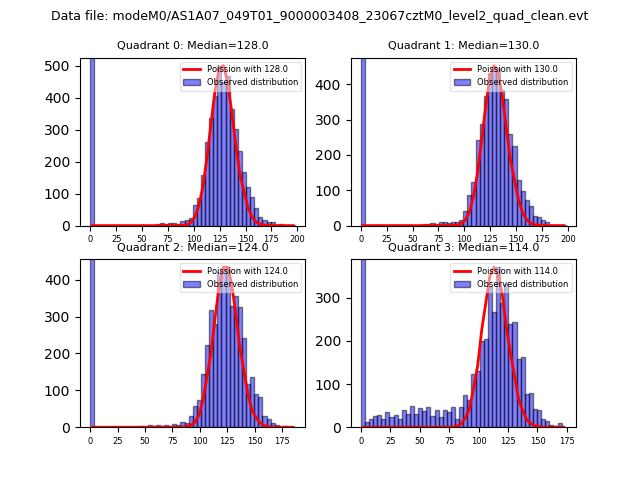 |
 |
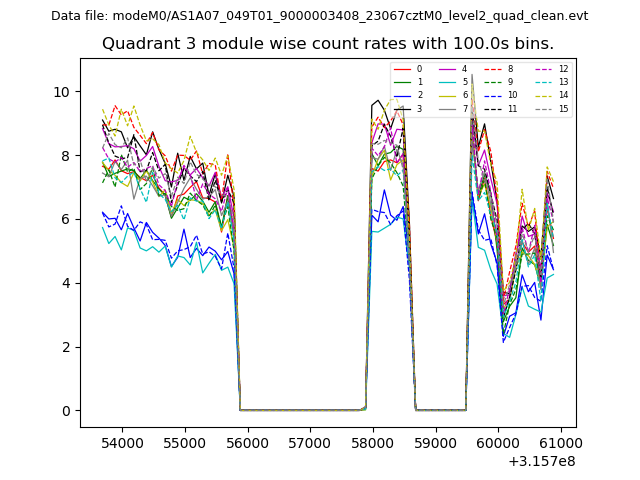
| Quadrant-wise count rates Data is divided into 100 sec bins |
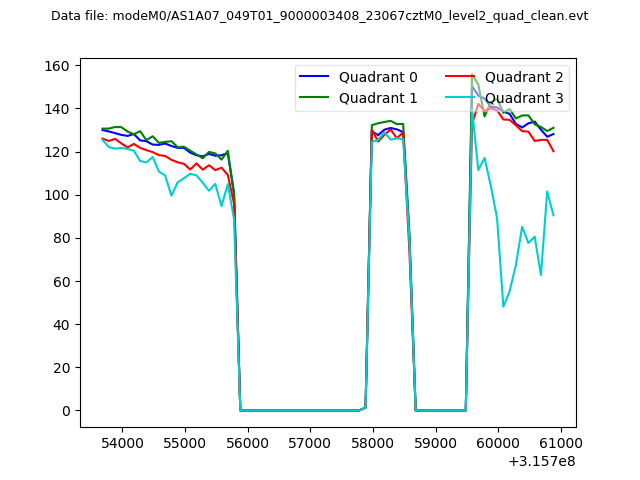 |
|
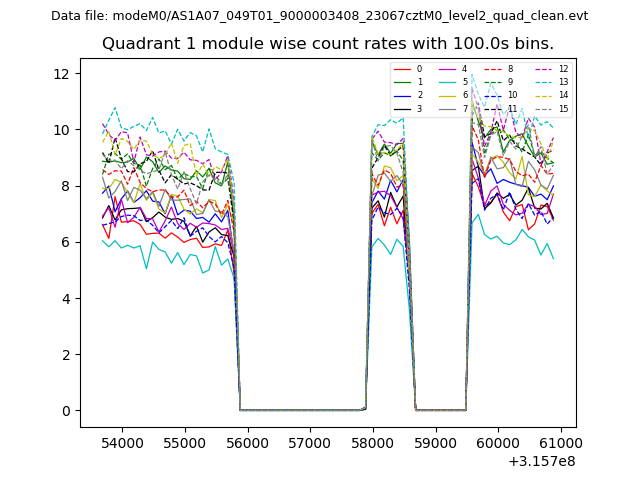
| Module-wise count rates for Quadrant A Data is divided into 100 sec bins |
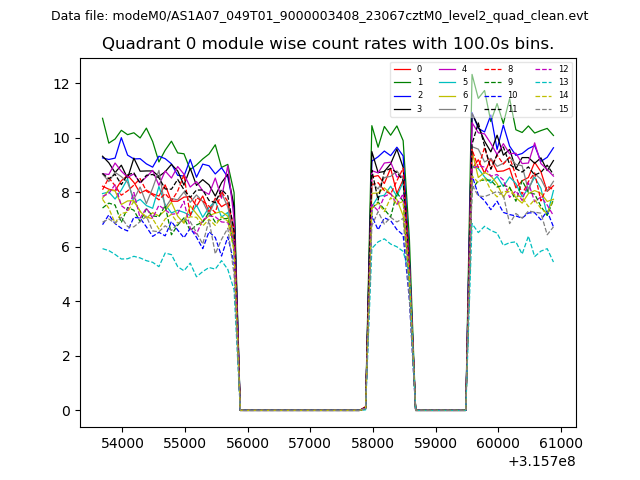 |
 |
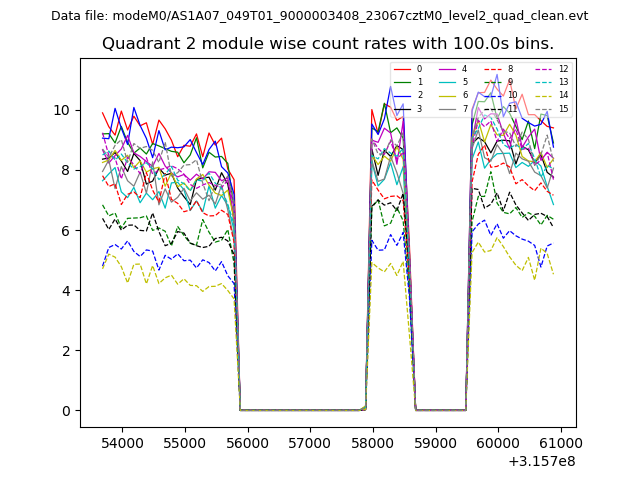
| Module-wise count rates for Quadrant B Data is divided into 100 sec bins |
 |
 |
| Module-wise count rates for Quadrant C Data is divided into 100 sec bins |
 |
 |
| Module-wise count rates for Quadrant D Data is divided into 100 sec bins |
 |
 |
| Parameter | Plot |
|---|---|
| CZT HV Monitor | 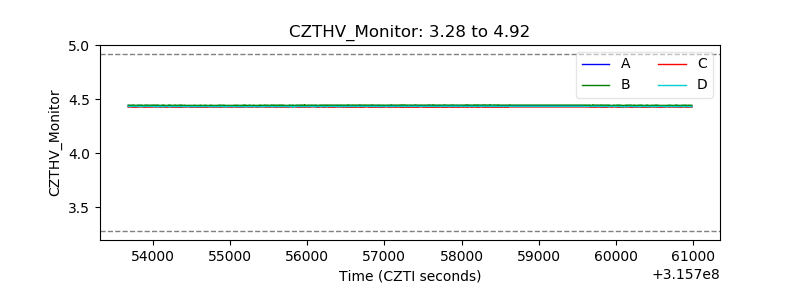 |
| D_VDD | 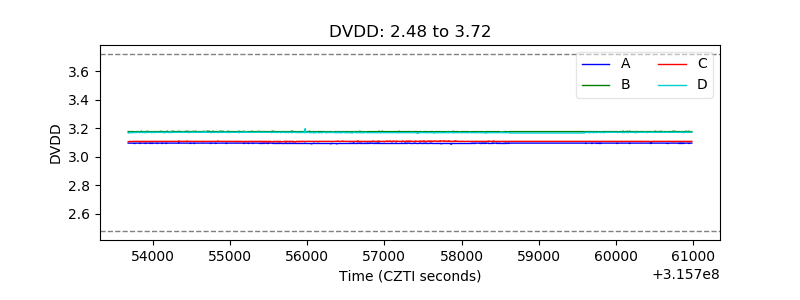 |
| Temperature 1 | 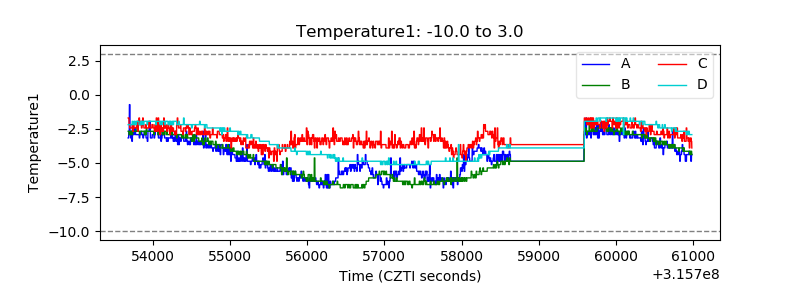 |
| Veto HV Monitor | 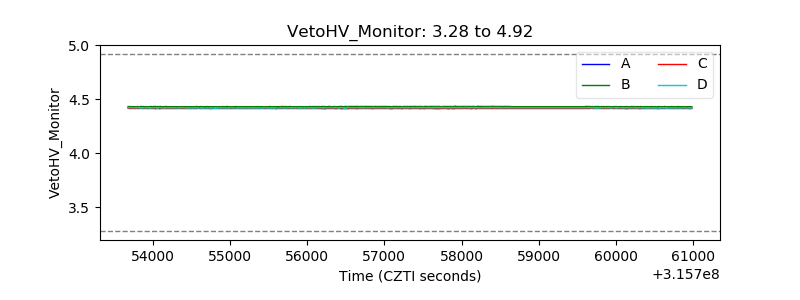 |
| Veto LLD | 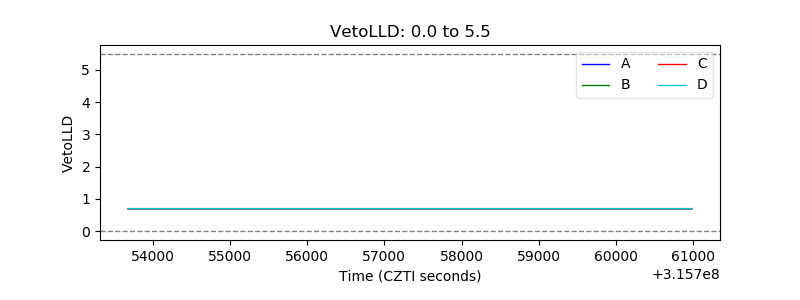 |
| Alpha Counter | 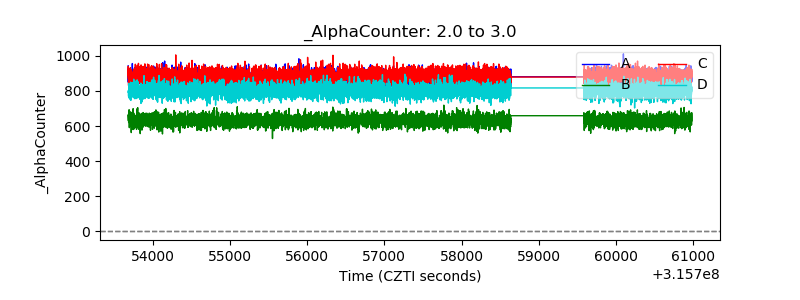 |
| _CPM_Rate | 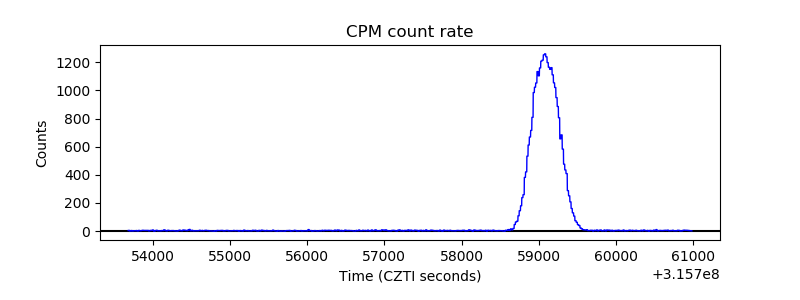 |
| CZT Counter | 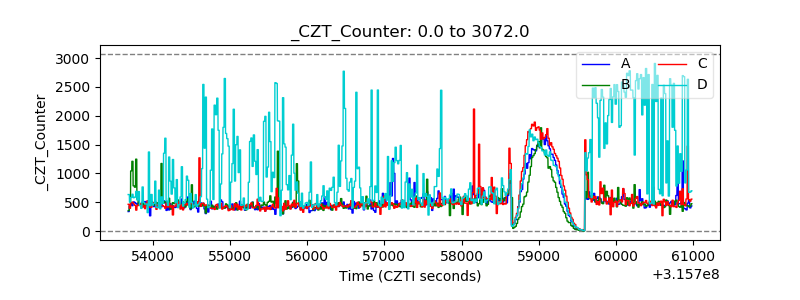 |
| +2.5 Volts monitor |  |
| +5 Volts monitor |  |
| _ROLL_ROT | 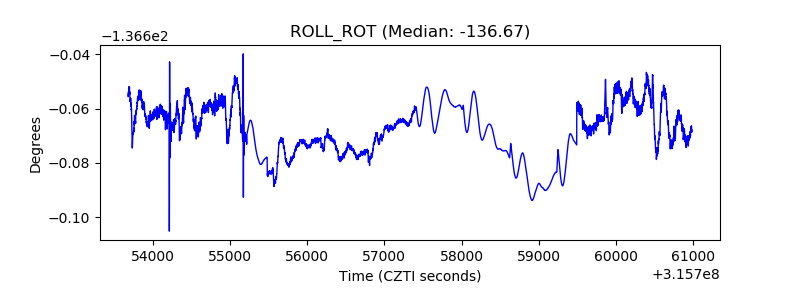 |
| _Roll_DEC | 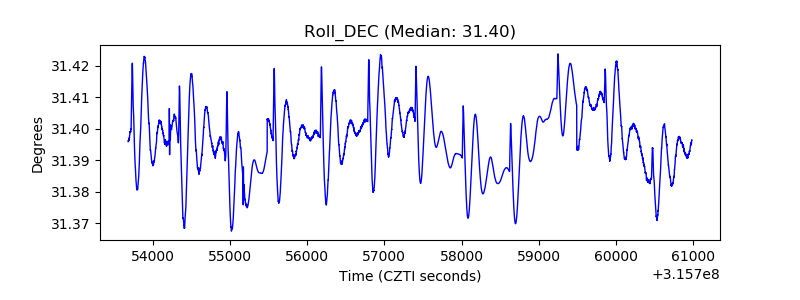 |
| _Roll_RA | 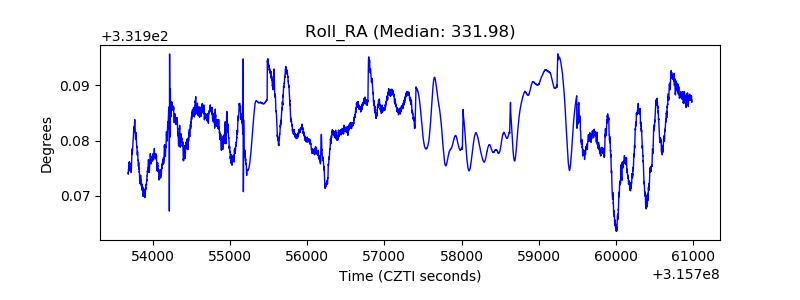 |
| Veto Counter | 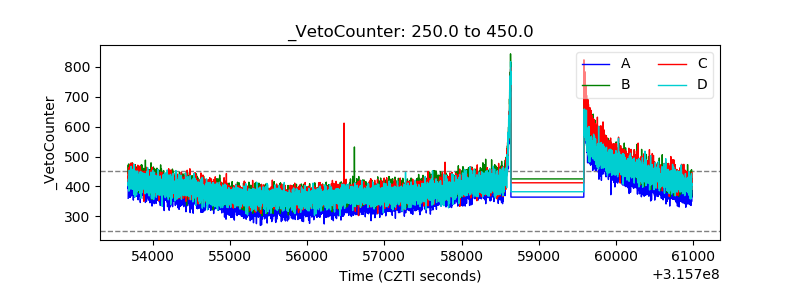 |