| Param | Original file | Final file |
|---|---|---|
| Filename | modeM0/AS1A07_049T01_9000003408_23071cztM0_level2.evt | modeM0/AS1A07_049T01_9000003408_23071cztM0_level2_quad_clean.evt |
| Size (bytes) | 496,981,440 | 89,835,840 |
| Size | 474.0 MB | 85.7 MB |
| Events in quadrant A | 3,259,387 | 573,468 |
| Events in quadrant B | 3,430,537 | 594,383 |
| Events in quadrant C | 3,523,883 | 566,954 |
| Events in quadrant D | 4,401,363 | 537,617 |
| Mode M0 | |||
|---|---|---|---|
| Quadrant | BADHDUFLAG | Total packets | Discarded packets |
| A | 0 | 13684 | 2 |
| B | 0 | 14110 | 2 |
| C | 0 | 14428 | 2 |
| D | 0 | 17391 | 2 |
| Mode M9 | |||
|---|---|---|---|
| Quadrant | BADHDUFLAG | Total packets | Discarded packets |
| A | 0 | 19 | 0 |
| B | 0 | 20 | 0 |
| C | 0 | 20 | 0 |
| D | 0 | 20 | 0 |
| Mode SS | |||
|---|---|---|---|
| Quadrant | BADHDUFLAG | Total packets | Discarded packets |
| A | 0 | 130 | 0 |
| B | 0 | 130 | 0 |
| C | 0 | 130 | 0 |
| D | 0 | 130 | 0 |
| Quadrant | Total seconds | Saturated seconds | Saturation percentage |
|---|---|---|---|
| A | 6424 | 21 | 0.326899% |
| B | 6424 | 57 | 0.887298% |
| C | 6424 | 118 | 1.836862% |
| D | 6424 | 309 | 4.810087% |
Noise dominated data is calculated using 1-second bins in cleaned event files. If a bin has >2000 counts, and if more than 50% of those come from <1% of pixels, then it is considered to be noise-dominated and hence unusable.
| Quadrant | # 1 sec bins | Bins with >0 counts | Bins with >2000 counts | High rate bins dominated by noise | Noise dominated (total time) | Noise dominated (detector-on time) | Marked lightcurve |
|---|---|---|---|---|---|---|---|
| A | 7754 | 6425 | 1 | 1 | 0.01% | 0.02% | 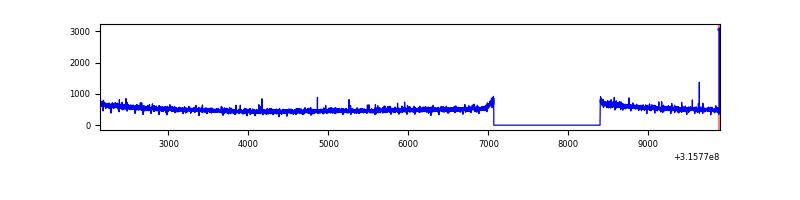 |
| B | 7754 | 6425 | 17 | 17 | 0.22% | 0.26% | 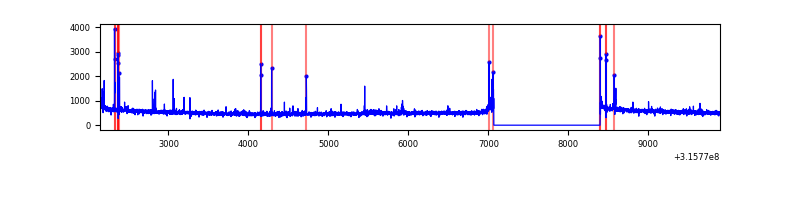 |
| C | 7754 | 6425 | 17 | 17 | 0.22% | 0.26% | 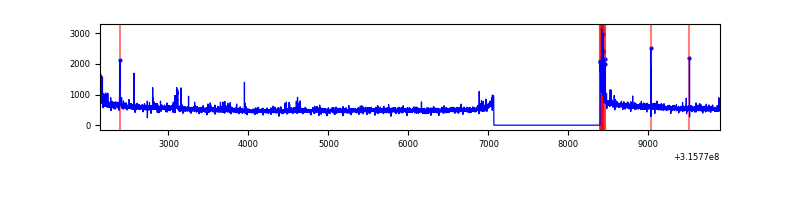 |
| D | 7754 | 6425 | 226 | 226 | 2.91% | 3.52% | 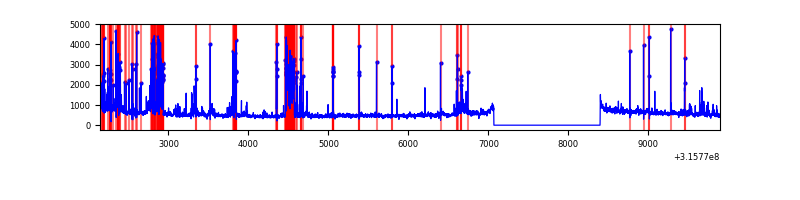 |
Top three noisy pixels from each quadrant. If the there are fewer than three noisy pixels in the level2.evt file, extra rows are filled as -1
| Pixel properties | Quadrant properties | ||||||
|---|---|---|---|---|---|---|---|
| Quadrant | DetID | PixID | Counts | Sigma | Mean | Median | Sigma |
| A | 6 | 16 | 11005 | 60.56 | 842 | 826 | 168.1 |
| A | 13 | 254 | 9931 | 54.17 | 842 | 826 | 168.1 |
| A | 0 | 226 | 7428 | 39.28 | 842 | 826 | 168.1 |
| B | 4 | 216 | 55714 | 350.8 | 845 | 825 | 156.5 |
| B | 0 | 189 | 20684 | 126.92 | 845 | 825 | 156.5 |
| B | 12 | 111 | 18561 | 113.35 | 845 | 825 | 156.5 |
| C | 14 | 238 | 130764 | 678.94 | 825 | 834 | 191.4 |
| C | 0 | 10 | 120960 | 627.71 | 825 | 834 | 191.4 |
| C | 0 | 207 | 44504 | 228.19 | 825 | 834 | 191.4 |
| D | 1 | 52 | 787772 | 4000.68 | 819 | 797 | 196.7 |
| D | 1 | 239 | 228721 | 1158.68 | 819 | 797 | 196.7 |
| D | 12 | 227 | 187308 | 948.15 | 819 | 797 | 196.7 |
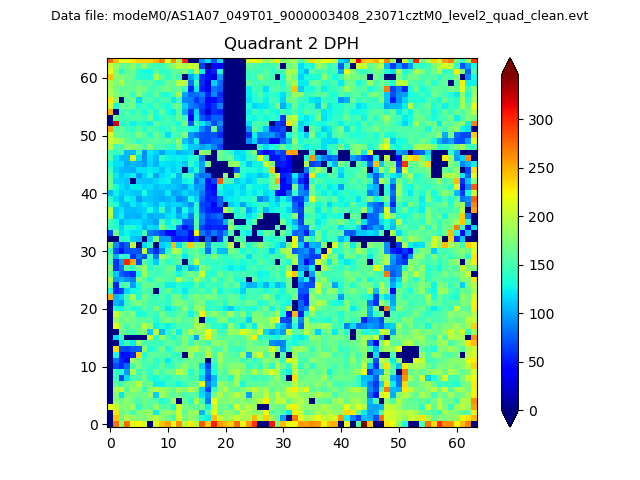
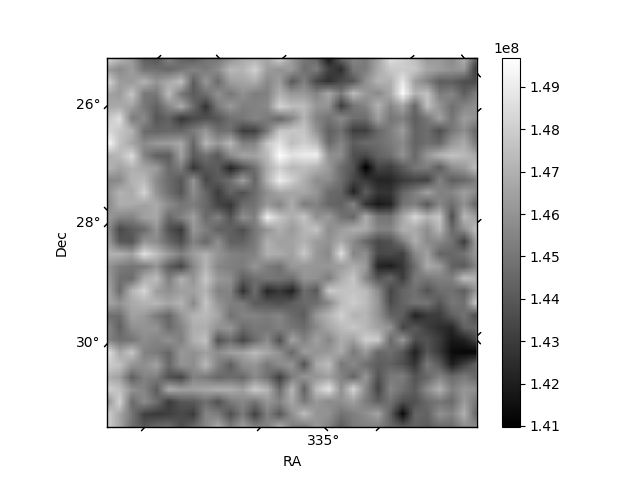
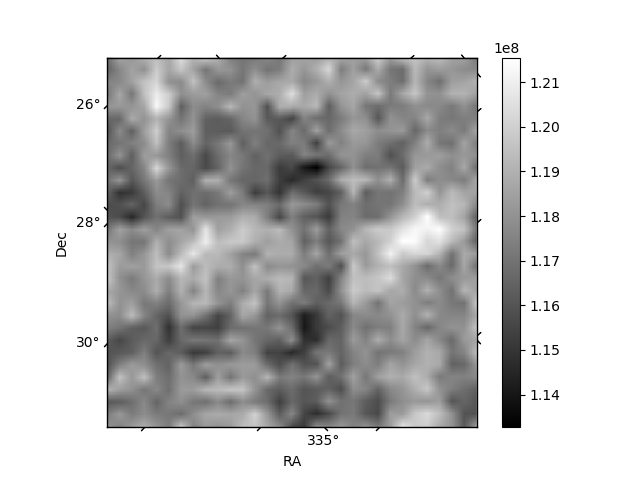
Histogram calculated using DETX and DETY for each event in the final _common_clean file
| Quadrant A | 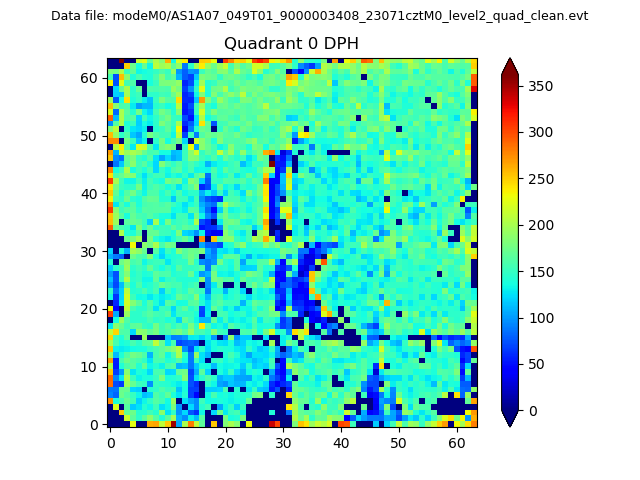 |
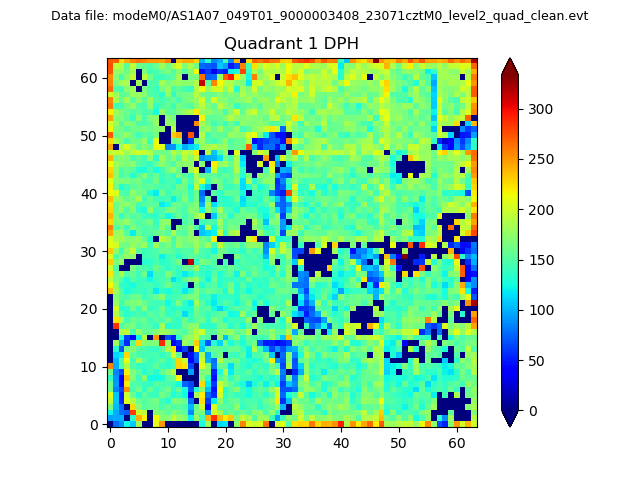 |
Quadrant B |
|---|---|---|---|
| Quadrant D | 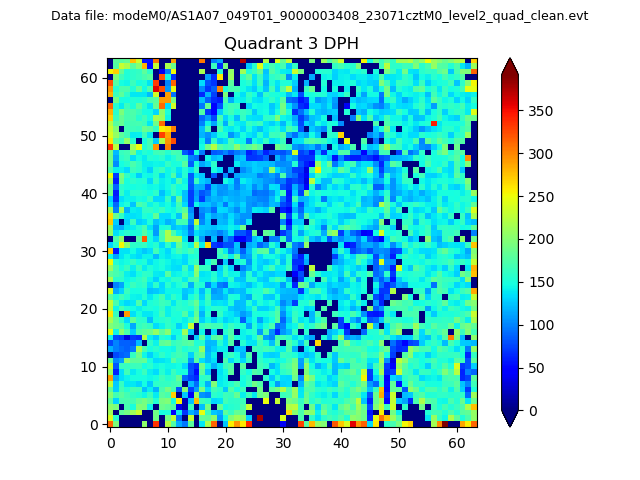 |
 |
Quadrant C |
| Plot type | Count rate plots | Images |
|---|---|---|
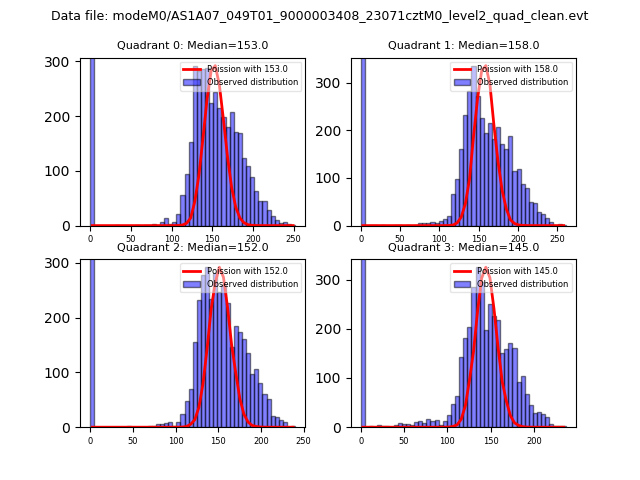
| Comparison with Poisson distribution Blue bars denote a histogram of data divided into 1 sec bins. Red curve is a Poisson curve with rate = median count rate of data. |
 |
 |
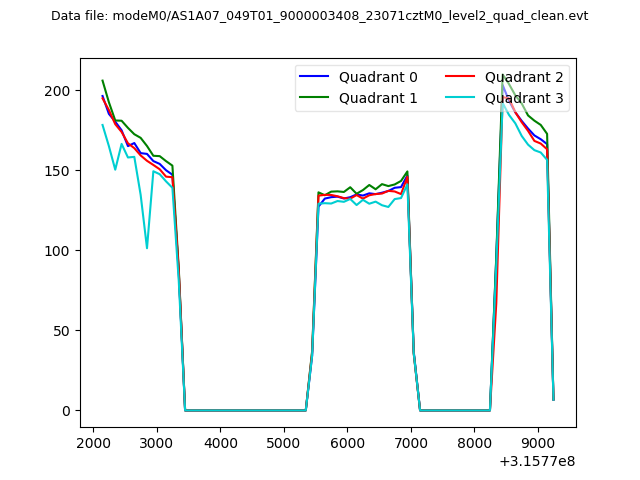
| Quadrant-wise count rates Data is divided into 100 sec bins |
 |
|
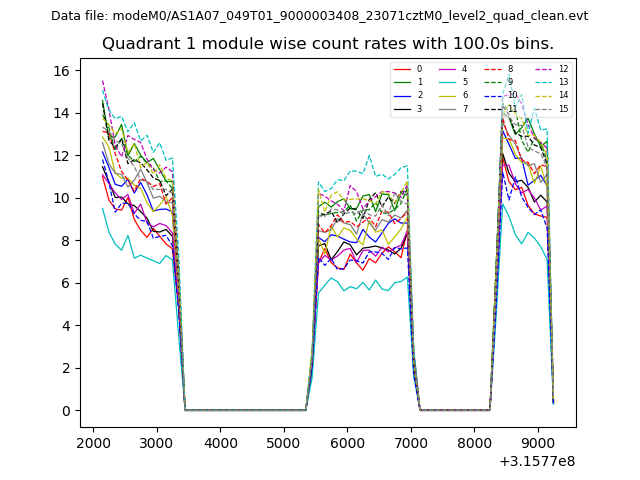
| Module-wise count rates for Quadrant A Data is divided into 100 sec bins |
 |
 |
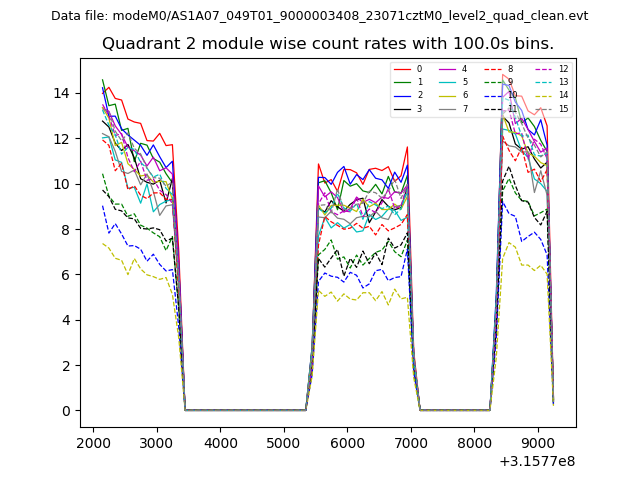
| Module-wise count rates for Quadrant B Data is divided into 100 sec bins |
 |
 |
| Module-wise count rates for Quadrant C Data is divided into 100 sec bins |
 |
 |
| Module-wise count rates for Quadrant D Data is divided into 100 sec bins |
 |
 |
| Parameter | Plot |
|---|---|
| CZT HV Monitor |  |
| D_VDD | 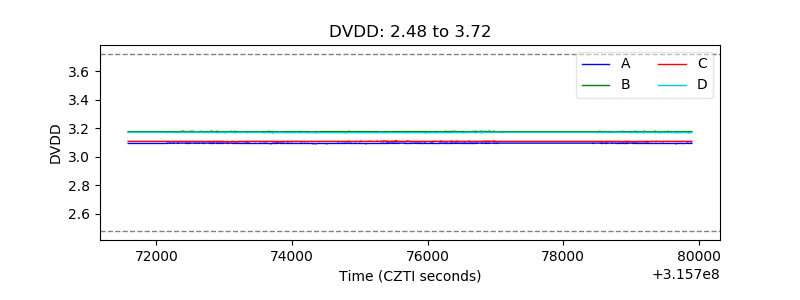 |
| Temperature 1 | 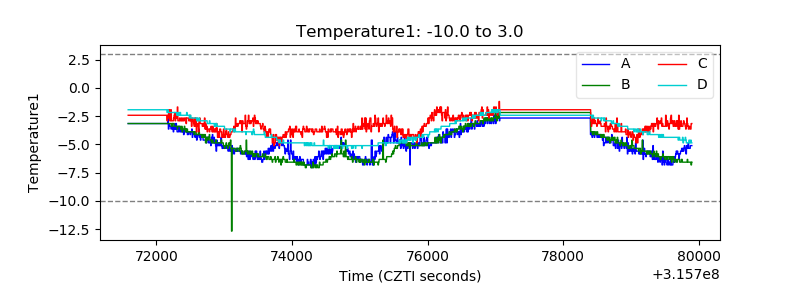 |
| Veto HV Monitor | 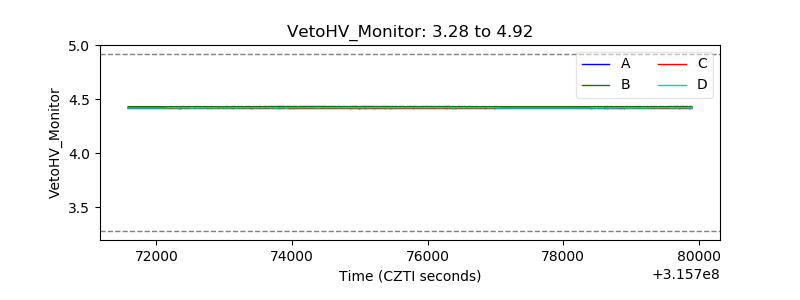 |
| Veto LLD | 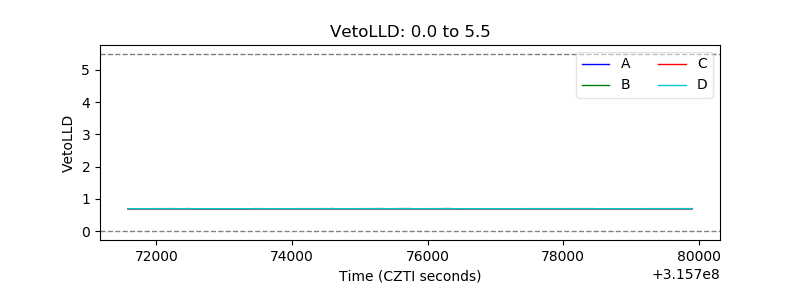 |
| Alpha Counter | 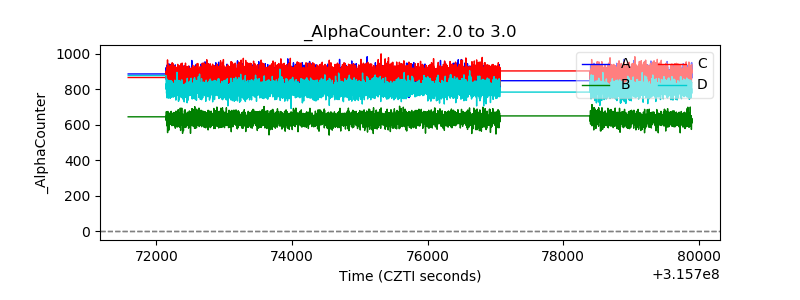 |
| _CPM_Rate | 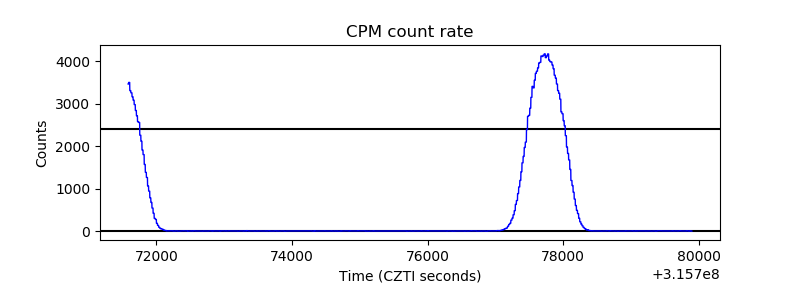 |
| CZT Counter | 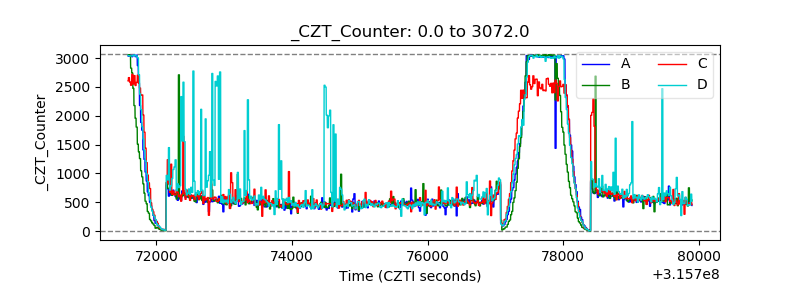 |
| +2.5 Volts monitor |  |
| +5 Volts monitor |  |
| _ROLL_ROT | 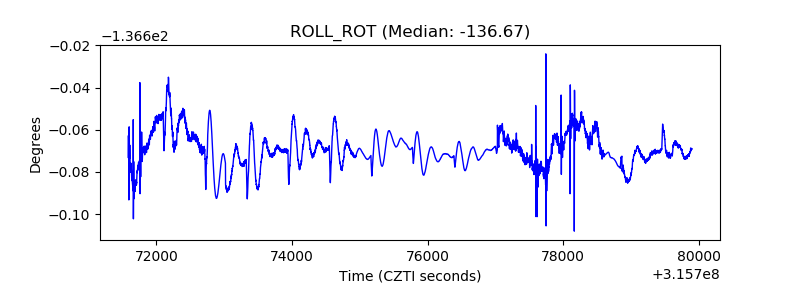 |
| _Roll_DEC |  |
| _Roll_RA | 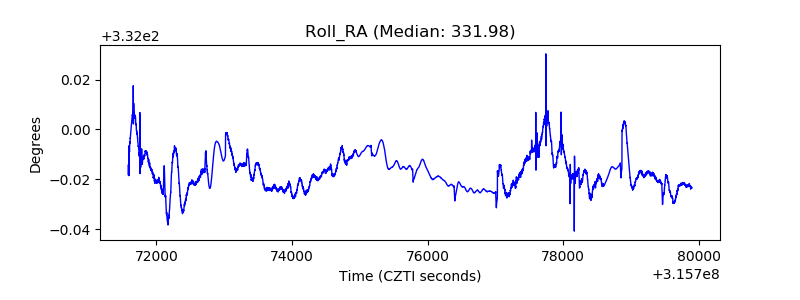 |
| Veto Counter | 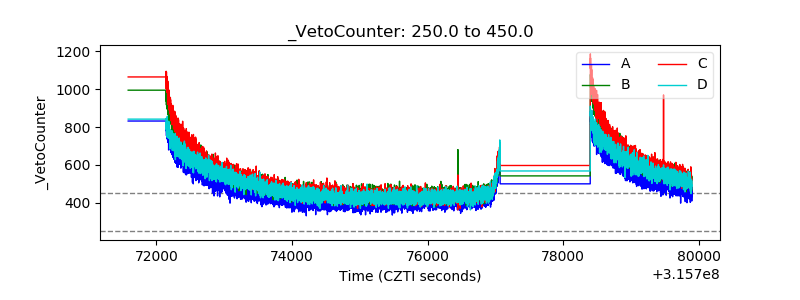 |