| Param | Original file | Final file |
|---|---|---|
| Filename | modeM0/AS1A07_049T01_9000003408_23072cztM0_level2.evt | modeM0/AS1A07_049T01_9000003408_23072cztM0_level2_quad_clean.evt |
| Size (bytes) | 490,910,400 | 80,519,040 |
| Size | 468.2 MB | 76.8 MB |
| Events in quadrant A | 3,281,064 | 506,987 |
| Events in quadrant B | 3,430,766 | 523,369 |
| Events in quadrant C | 3,569,056 | 494,100 |
| Events in quadrant D | 4,159,078 | 474,276 |
| Mode M0 | |||
|---|---|---|---|
| Quadrant | BADHDUFLAG | Total packets | Discarded packets |
| A | 0 | 13551 | 2 |
| B | 0 | 13965 | 2 |
| C | 0 | 14431 | 2 |
| D | 0 | 16532 | 3 |
| Mode M9 | |||
|---|---|---|---|
| Quadrant | BADHDUFLAG | Total packets | Discarded packets |
| A | 0 | 21 | 0 |
| B | 0 | 22 | 0 |
| C | 0 | 22 | 0 |
| D | 0 | 22 | 0 |
| Mode SS | |||
|---|---|---|---|
| Quadrant | BADHDUFLAG | Total packets | Discarded packets |
| A | 0 | 128 | 0 |
| B | 0 | 128 | 0 |
| C | 0 | 128 | 0 |
| D | 0 | 128 | 0 |
| Quadrant | Total seconds | Saturated seconds | Saturation percentage |
|---|---|---|---|
| A | 6296 | 26 | 0.412961% |
| B | 6296 | 42 | 0.667090% |
| C | 6296 | 167 | 2.652478% |
| D | 6295 | 194 | 3.081811% |
Noise dominated data is calculated using 1-second bins in cleaned event files. If a bin has >2000 counts, and if more than 50% of those come from <1% of pixels, then it is considered to be noise-dominated and hence unusable.
| Quadrant | # 1 sec bins | Bins with >0 counts | Bins with >2000 counts | High rate bins dominated by noise | Noise dominated (total time) | Noise dominated (detector-on time) | Marked lightcurve |
|---|---|---|---|---|---|---|---|
| A | 7696 | 6297 | 1 | 1 | 0.01% | 0.02% | 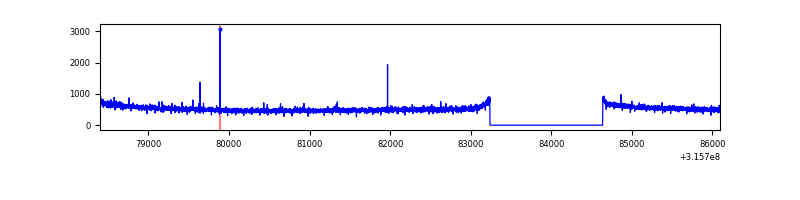 |
| B | 7696 | 6297 | 14 | 14 | 0.18% | 0.22% | 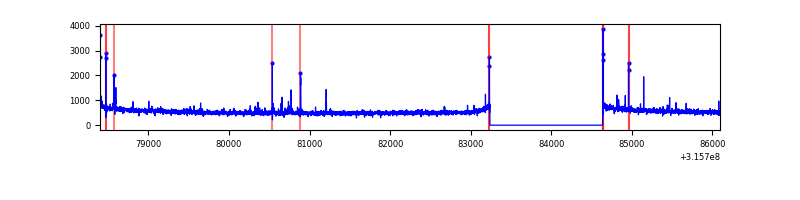 |
| C | 7696 | 6297 | 36 | 36 | 0.47% | 0.57% | 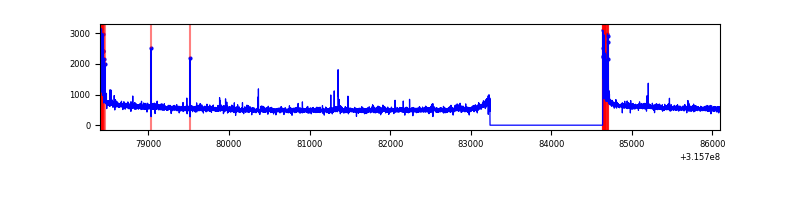 |
| D | 7695 | 6296 | 140 | 140 | 1.82% | 2.22% | 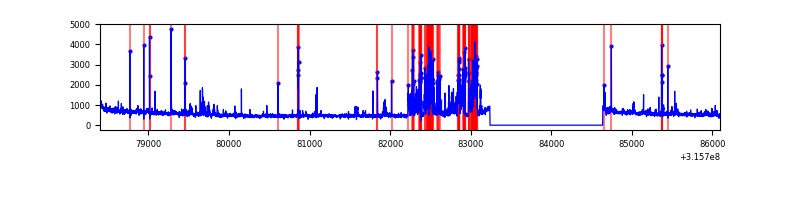 |
Top three noisy pixels from each quadrant. If the there are fewer than three noisy pixels in the level2.evt file, extra rows are filled as -1
| Pixel properties | Quadrant properties | ||||||
|---|---|---|---|---|---|---|---|
| Quadrant | DetID | PixID | Counts | Sigma | Mean | Median | Sigma |
| A | 13 | 254 | 9977 | 54.46 | 847 | 833 | 167.9 |
| A | 6 | 16 | 9935 | 54.21 | 847 | 833 | 167.9 |
| A | 0 | 226 | 7306 | 38.55 | 847 | 833 | 167.9 |
| B | 4 | 216 | 36929 | 231.3 | 851 | 833 | 156.1 |
| B | 0 | 189 | 23069 | 142.48 | 851 | 833 | 156.1 |
| B | 12 | 111 | 18275 | 111.77 | 851 | 833 | 156.1 |
| C | 0 | 10 | 170097 | 882.77 | 827 | 836 | 191.7 |
| C | 14 | 238 | 132187 | 685.06 | 827 | 836 | 191.7 |
| C | 0 | 207 | 22392 | 112.42 | 827 | 836 | 191.7 |
| D | 1 | 52 | 824217 | 4149.88 | 831 | 811 | 198.4 |
| D | 1 | 239 | 93878 | 469.05 | 831 | 811 | 198.4 |
| D | 12 | 227 | 64492 | 320.94 | 831 | 811 | 198.4 |
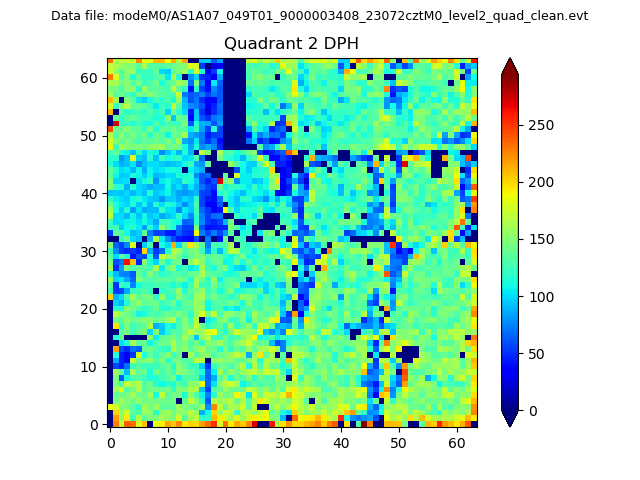
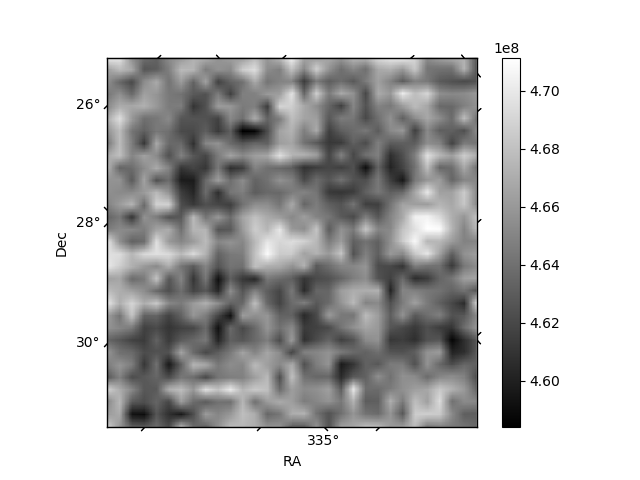
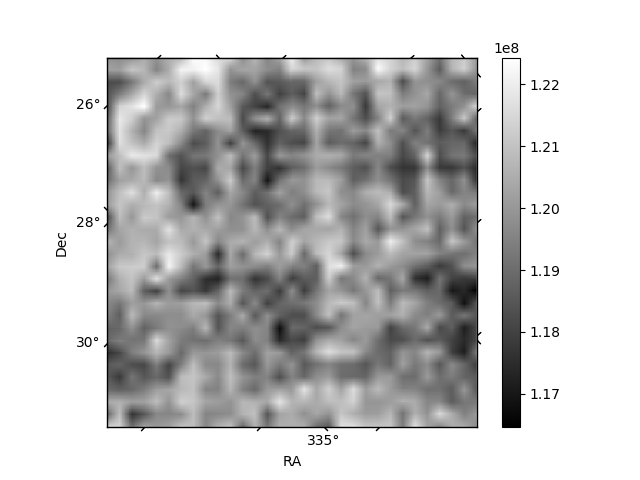
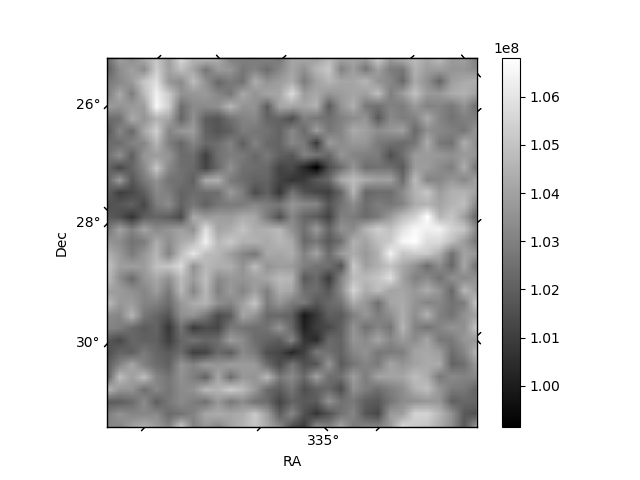
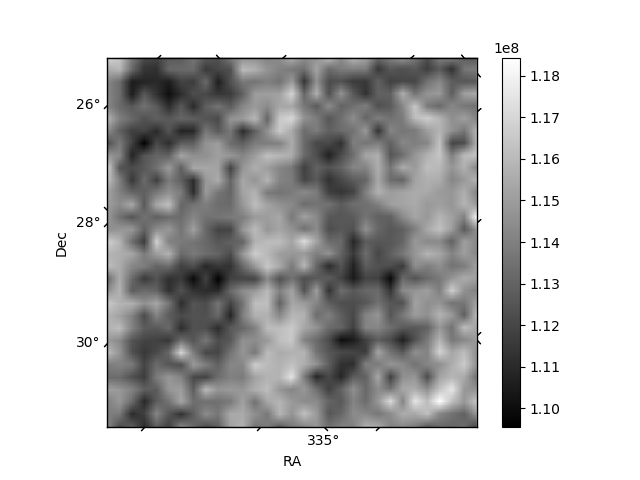
Histogram calculated using DETX and DETY for each event in the final _common_clean file
| Quadrant A | 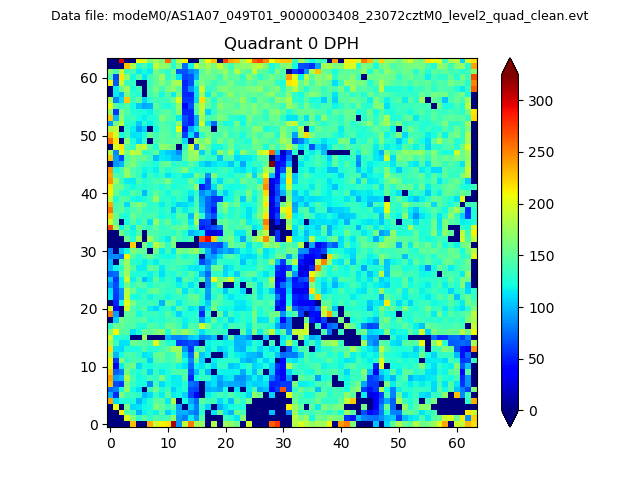 |
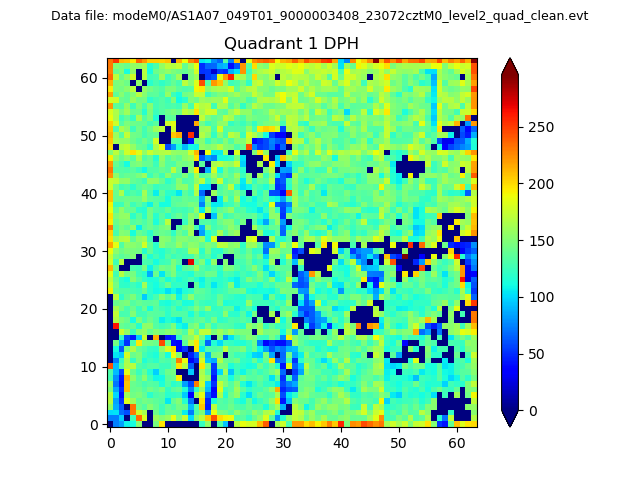 |
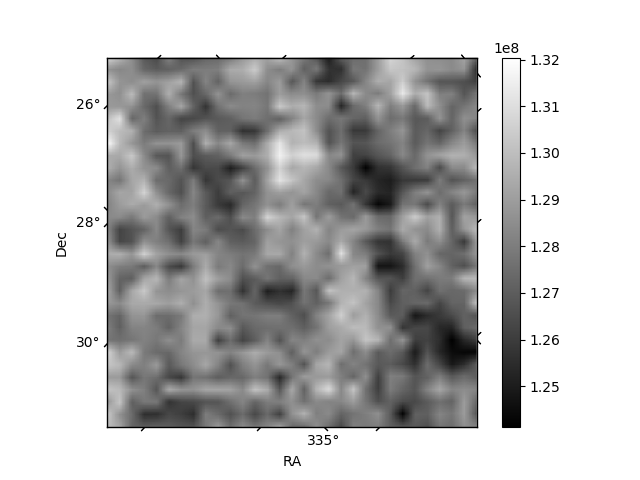
Quadrant B |
|---|---|---|---|
| Quadrant D | 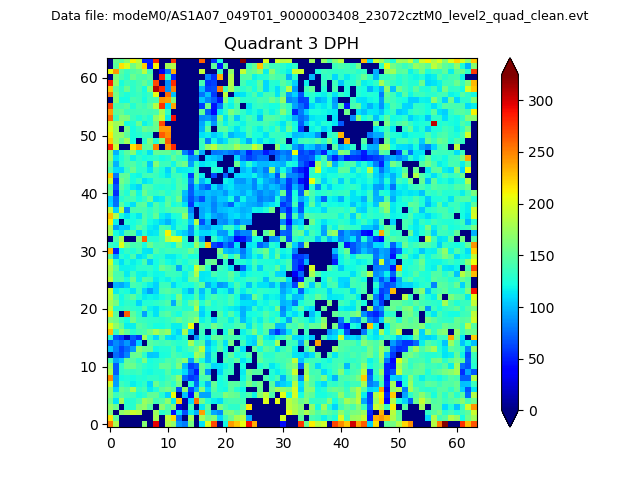 |
 |
Quadrant C |
| Plot type | Count rate plots | Images |
|---|---|---|
| Comparison with Poisson distribution Blue bars denote a histogram of data divided into 1 sec bins. Red curve is a Poisson curve with rate = median count rate of data. |
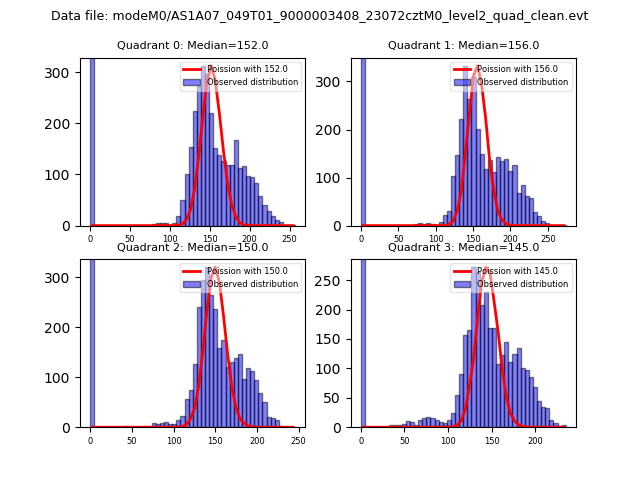 |
 |
| Quadrant-wise count rates Data is divided into 100 sec bins |
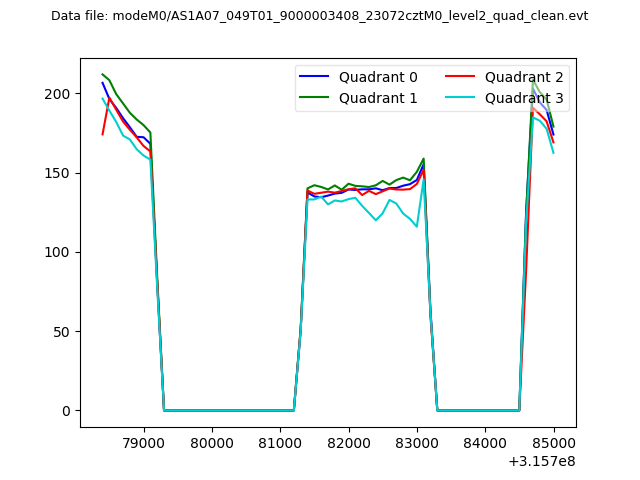 |
|
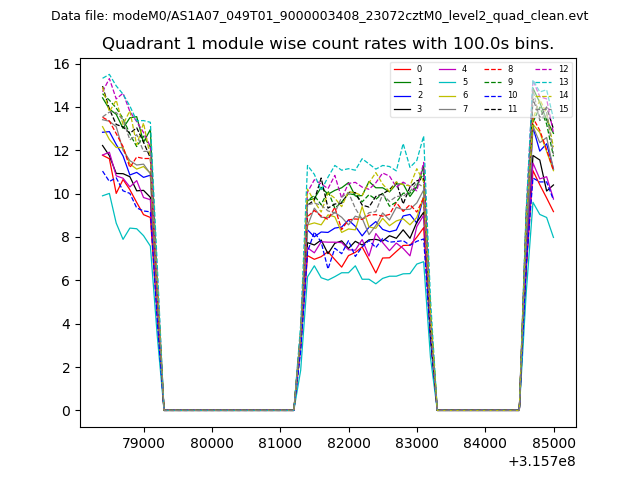
| Module-wise count rates for Quadrant A Data is divided into 100 sec bins |
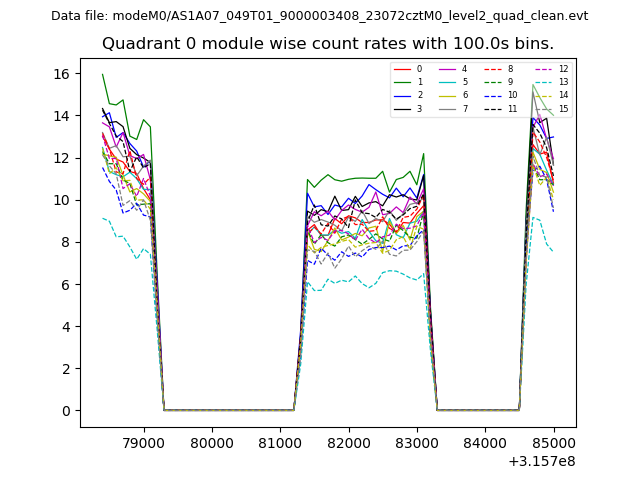 |
 |
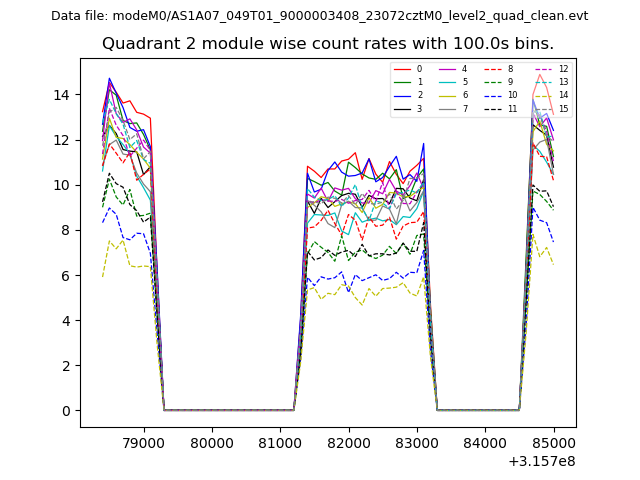
| Module-wise count rates for Quadrant B Data is divided into 100 sec bins |
 |
 |
| Module-wise count rates for Quadrant C Data is divided into 100 sec bins |
 |
 |
| Module-wise count rates for Quadrant D Data is divided into 100 sec bins |
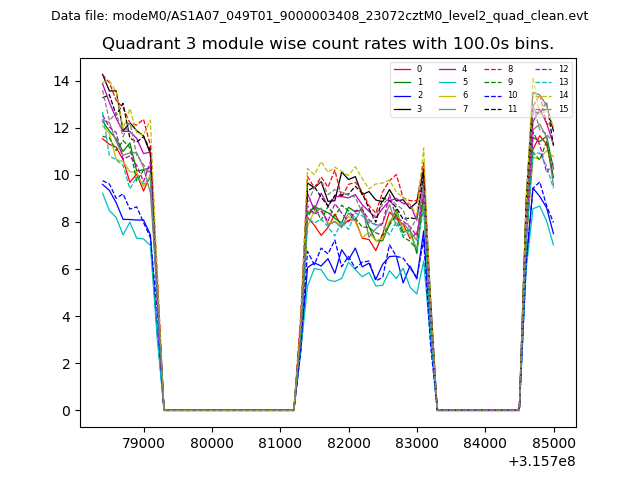 |
 |
| Parameter | Plot |
|---|---|
| CZT HV Monitor | 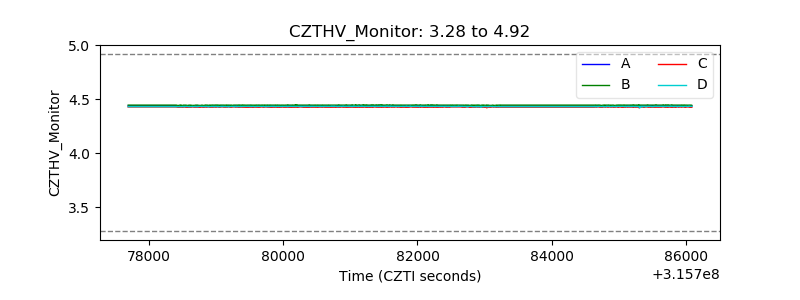 |
| D_VDD | 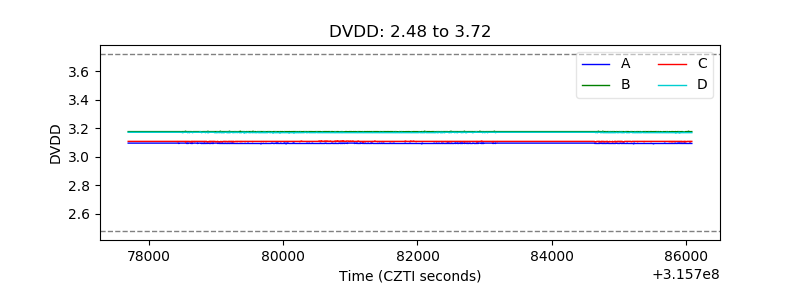 |
| Temperature 1 | 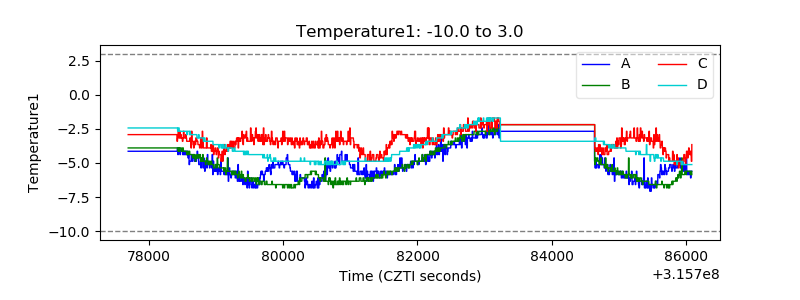 |
| Veto HV Monitor | 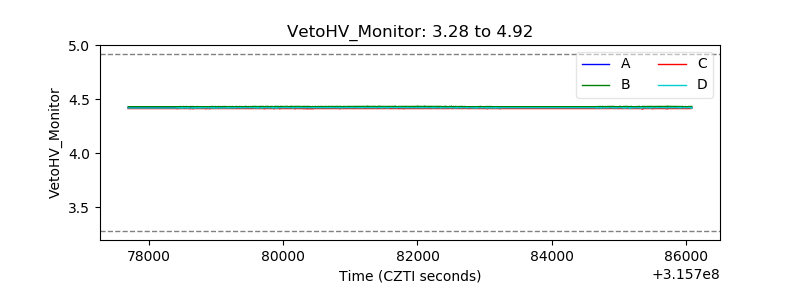 |
| Veto LLD | 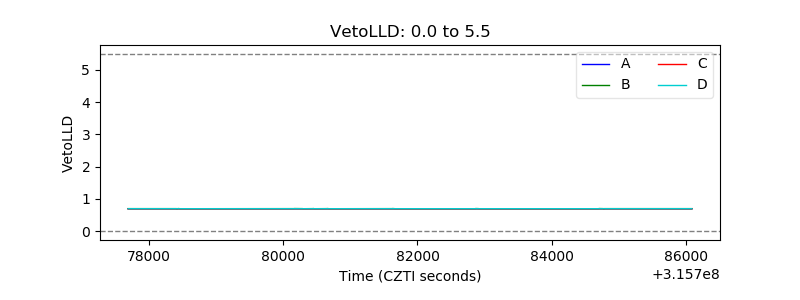 |
| Alpha Counter | 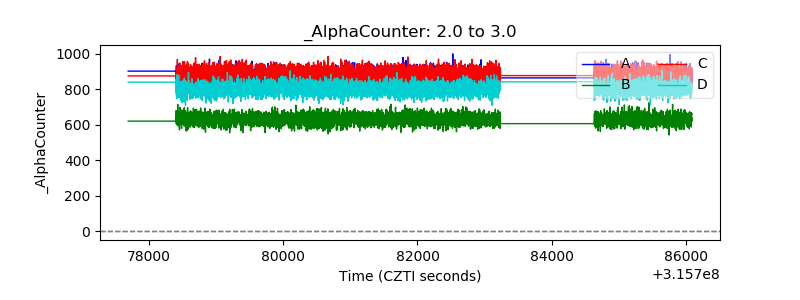 |
| _CPM_Rate | 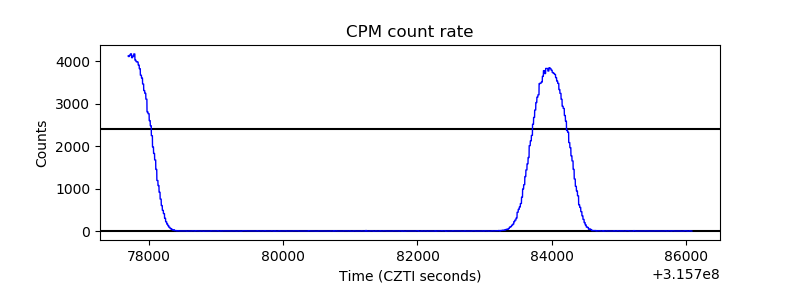 |
| CZT Counter | 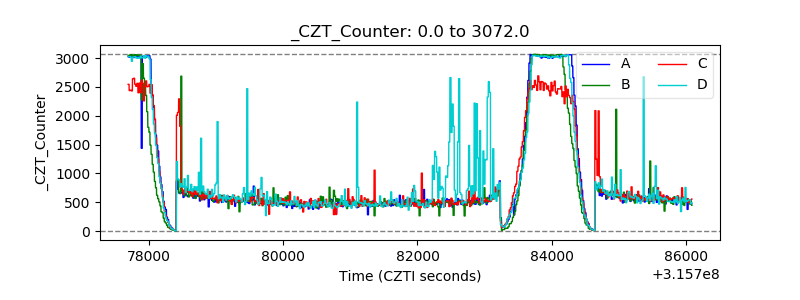 |
| +2.5 Volts monitor | 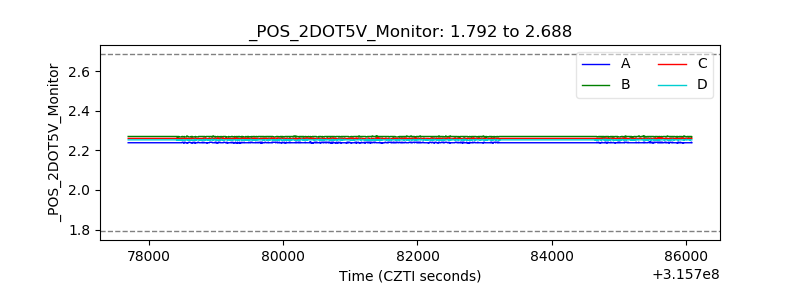 |
| +5 Volts monitor | 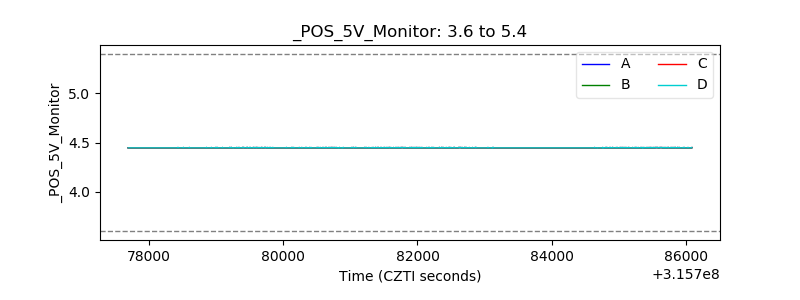 |
| _ROLL_ROT | 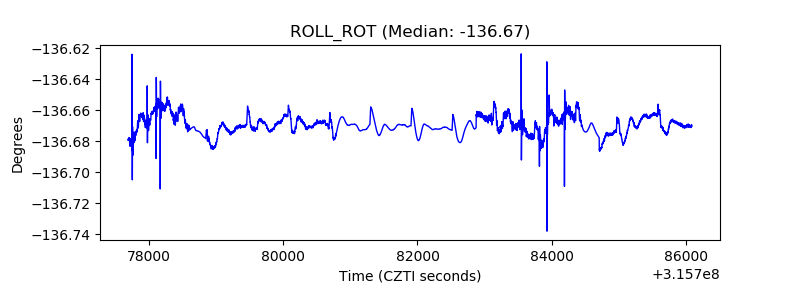 |
| _Roll_DEC | 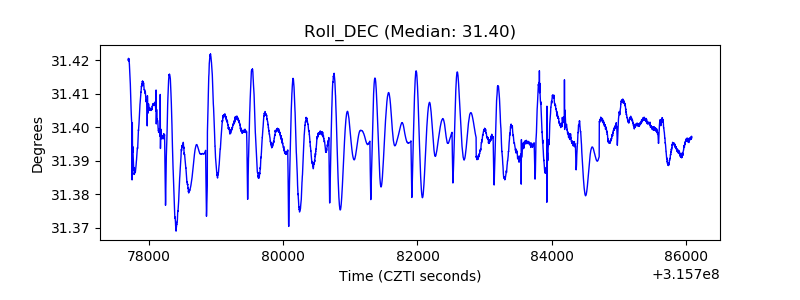 |
| _Roll_RA | 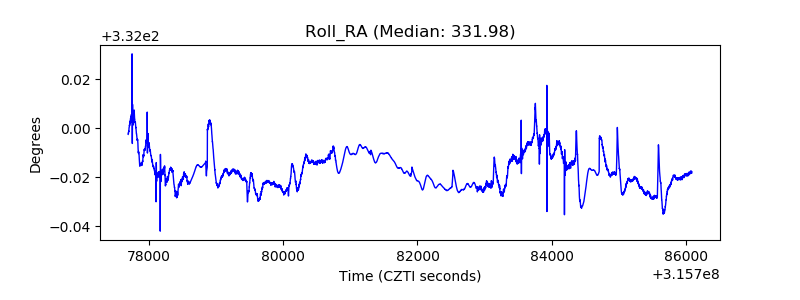 |
| Veto Counter | 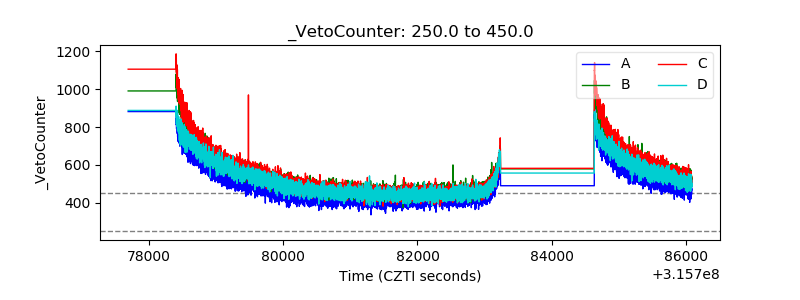 |