| Param | Original file | Final file |
|---|---|---|
| Filename | modeM0/AS1A07_049T01_9000003408_23073cztM0_level2.evt | modeM0/AS1A07_049T01_9000003408_23073cztM0_level2_quad_clean.evt |
| Size (bytes) | 477,552,960 | 69,281,280 |
| Size | 455.4 MB | 66.1 MB |
| Events in quadrant A | 3,301,930 | 418,359 |
| Events in quadrant B | 3,413,010 | 430,226 |
| Events in quadrant C | 3,642,435 | 406,872 |
| Events in quadrant D | 3,675,258 | 400,198 |
| Mode M0 | |||
|---|---|---|---|
| Quadrant | BADHDUFLAG | Total packets | Discarded packets |
| A | 0 | 13534 | 1 |
| B | 0 | 13942 | 1 |
| C | 0 | 14645 | 1 |
| D | 0 | 14957 | 1 |
| Mode M9 | |||
|---|---|---|---|
| Quadrant | BADHDUFLAG | Total packets | Discarded packets |
| A | 0 | 24 | 0 |
| B | 0 | 25 | 0 |
| C | 0 | 25 | 0 |
| D | 0 | 25 | 0 |
| Mode SS | |||
|---|---|---|---|
| Quadrant | BADHDUFLAG | Total packets | Discarded packets |
| A | 0 | 128 | 0 |
| B | 0 | 128 | 0 |
| C | 0 | 128 | 0 |
| D | 0 | 128 | 0 |
| Quadrant | Total seconds | Saturated seconds | Saturation percentage |
|---|---|---|---|
| A | 6336 | 29 | 0.457702% |
| B | 6336 | 38 | 0.599747% |
| C | 6336 | 247 | 3.898359% |
| D | 6336 | 78 | 1.231061% |
Noise dominated data is calculated using 1-second bins in cleaned event files. If a bin has >2000 counts, and if more than 50% of those come from <1% of pixels, then it is considered to be noise-dominated and hence unusable.
| Quadrant | # 1 sec bins | Bins with >0 counts | Bins with >2000 counts | High rate bins dominated by noise | Noise dominated (total time) | Noise dominated (detector-on time) | Marked lightcurve |
|---|---|---|---|---|---|---|---|
| A | 7756 | 6337 | 0 | 0 | 0.00% | 0.00% | 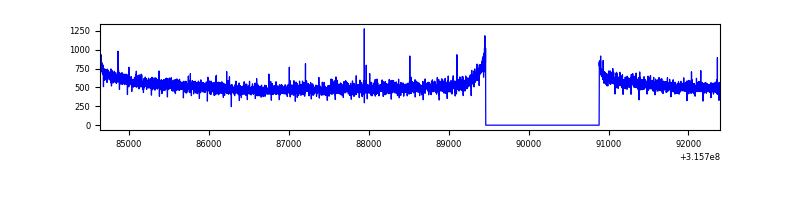 |
| B | 7756 | 6337 | 15 | 15 | 0.19% | 0.24% | 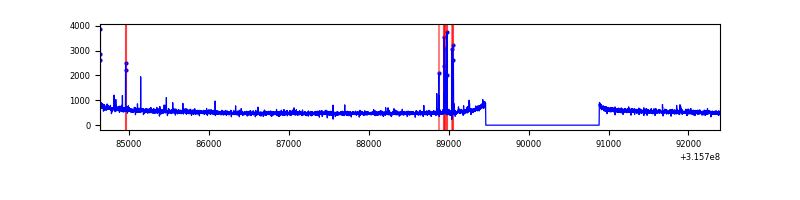 |
| C | 7756 | 6337 | 67 | 67 | 0.86% | 1.06% | 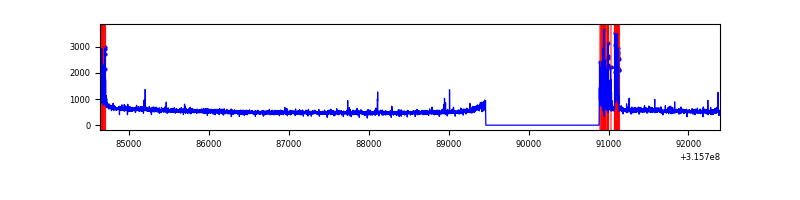 |
| D | 7756 | 6337 | 41 | 41 | 0.53% | 0.65% | 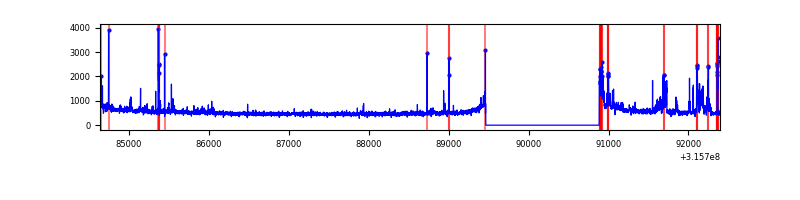 |
Top three noisy pixels from each quadrant. If the there are fewer than three noisy pixels in the level2.evt file, extra rows are filled as -1
| Pixel properties | Quadrant properties | ||||||
|---|---|---|---|---|---|---|---|
| Quadrant | DetID | PixID | Counts | Sigma | Mean | Median | Sigma |
| A | 6 | 16 | 22314 | 127.22 | 851 | 837 | 168.8 |
| A | 13 | 254 | 9562 | 51.68 | 851 | 837 | 168.8 |
| A | 0 | 226 | 7296 | 38.26 | 851 | 837 | 168.8 |
| B | 4 | 216 | 54580 | 339.64 | 852 | 834 | 158.2 |
| B | 12 | 111 | 18421 | 111.14 | 852 | 834 | 158.2 |
| B | 11 | 111 | 16772 | 100.72 | 852 | 834 | 158.2 |
| C | 0 | 10 | 294563 | 1555.14 | 816 | 825 | 188.9 |
| C | 14 | 238 | 131497 | 691.82 | 816 | 825 | 188.9 |
| C | 0 | 207 | 19184 | 97.2 | 816 | 825 | 188.9 |
| D | 1 | 239 | 191710 | 954.35 | 834 | 814 | 200.0 |
| D | 1 | 52 | 170160 | 846.61 | 834 | 814 | 200.0 |
| D | 12 | 227 | 84916 | 420.45 | 834 | 814 | 200.0 |
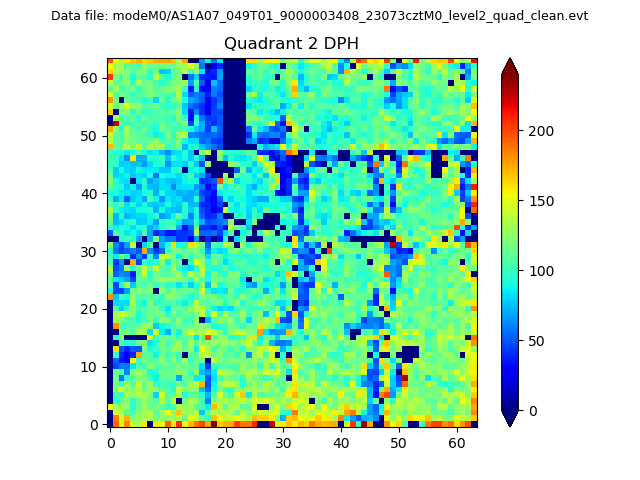
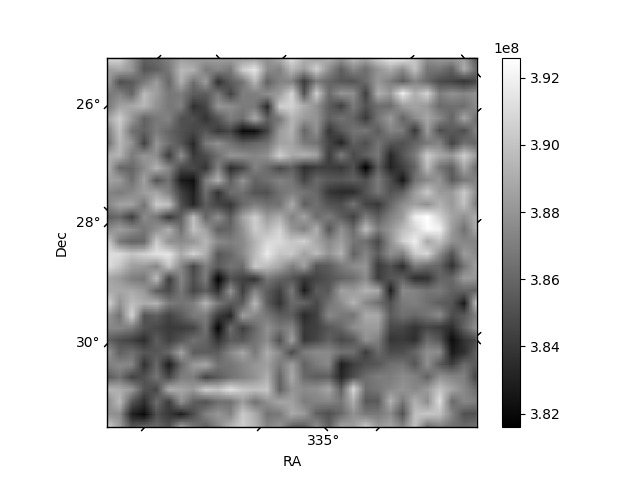
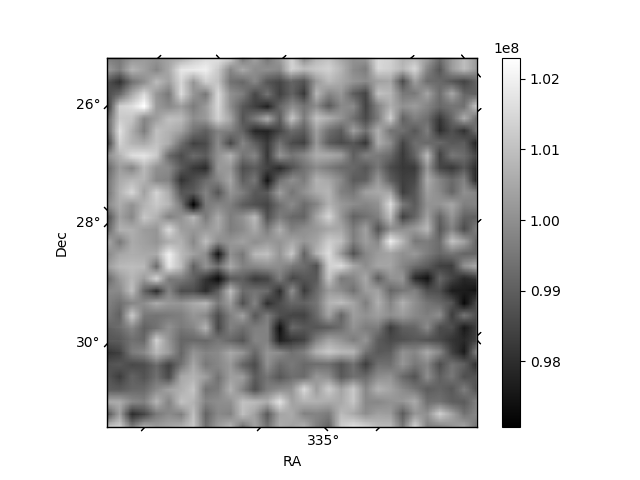
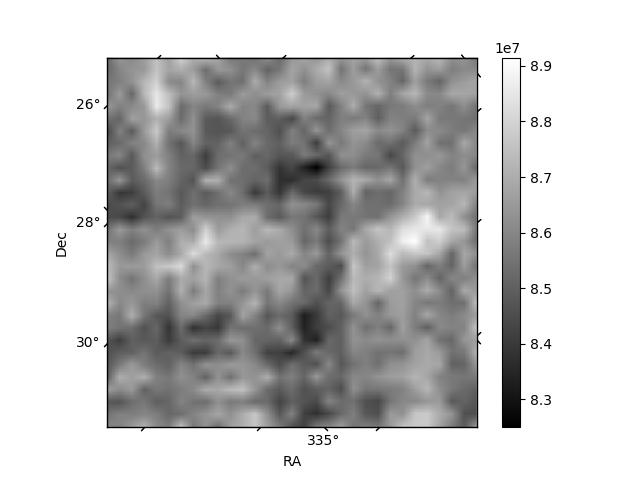
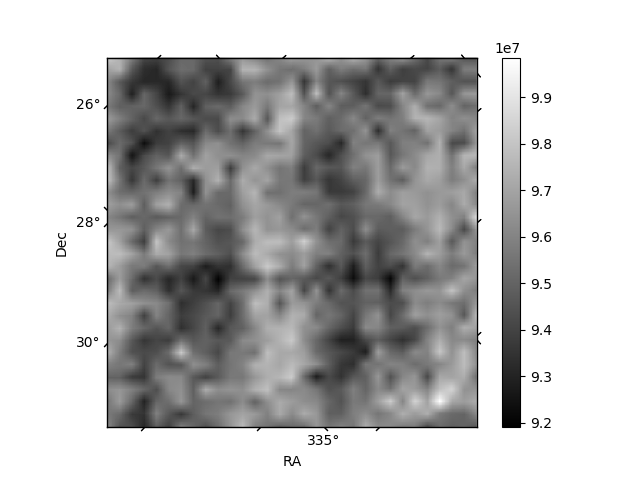
Histogram calculated using DETX and DETY for each event in the final _common_clean file
| Quadrant A | 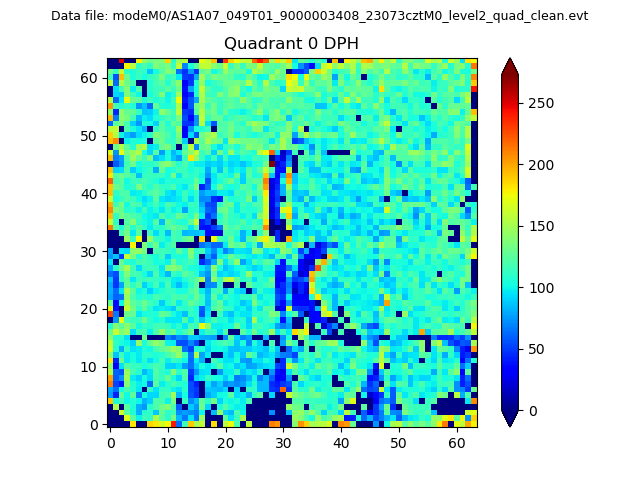 |
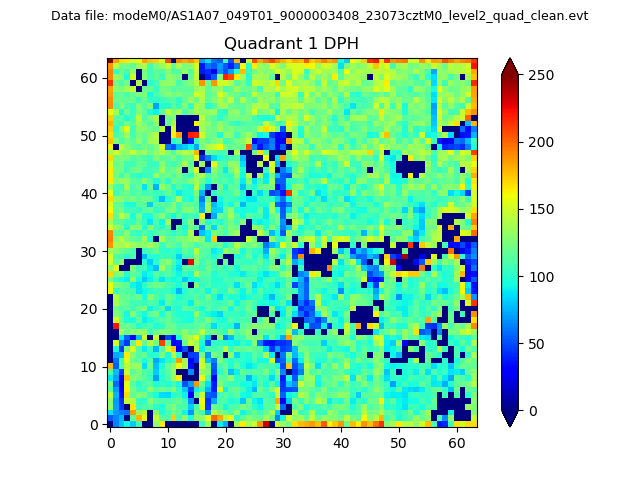 |
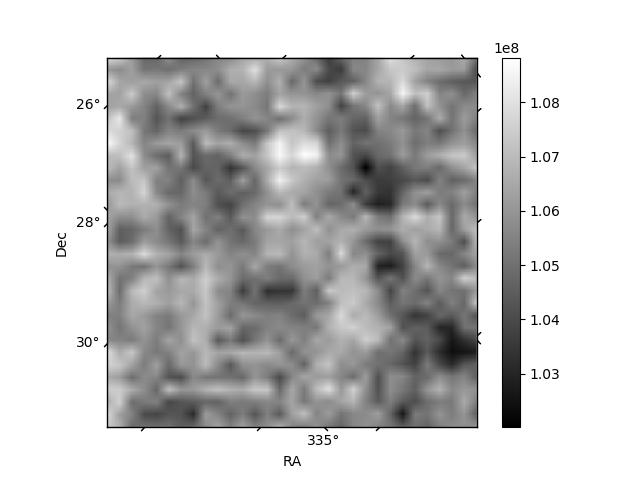
Quadrant B |
|---|---|---|---|
| Quadrant D | 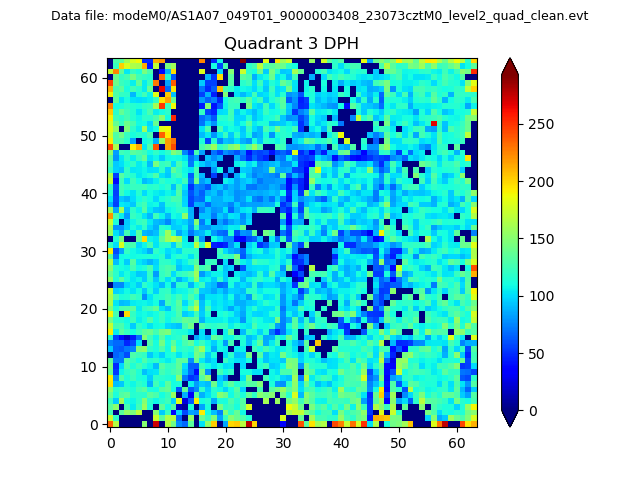 |
 |
Quadrant C |
| Plot type | Count rate plots | Images |
|---|---|---|
| Comparison with Poisson distribution Blue bars denote a histogram of data divided into 1 sec bins. Red curve is a Poisson curve with rate = median count rate of data. |
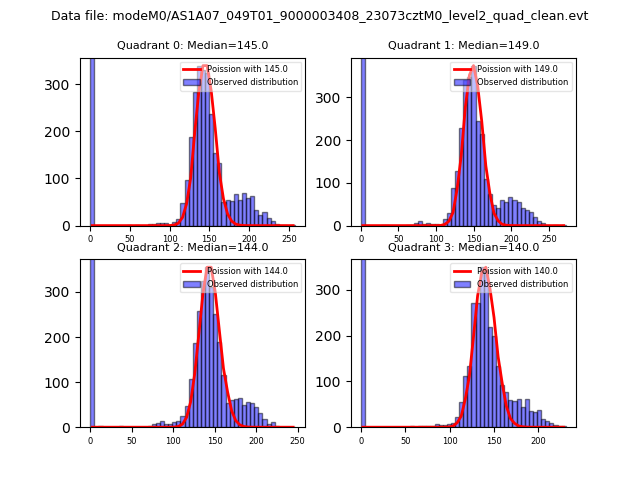 |
 |
| Quadrant-wise count rates Data is divided into 100 sec bins |
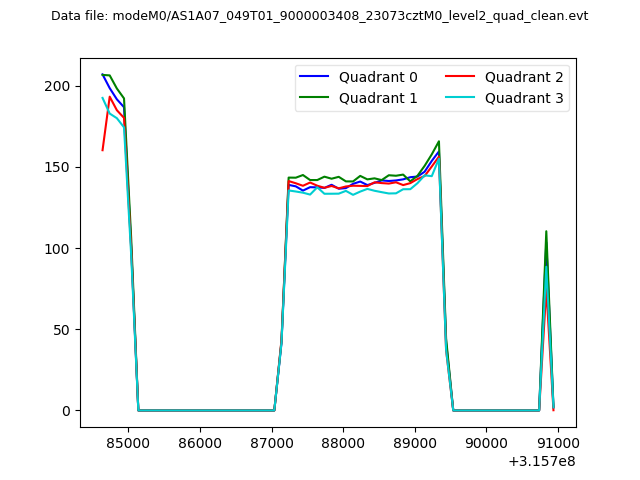 |
|
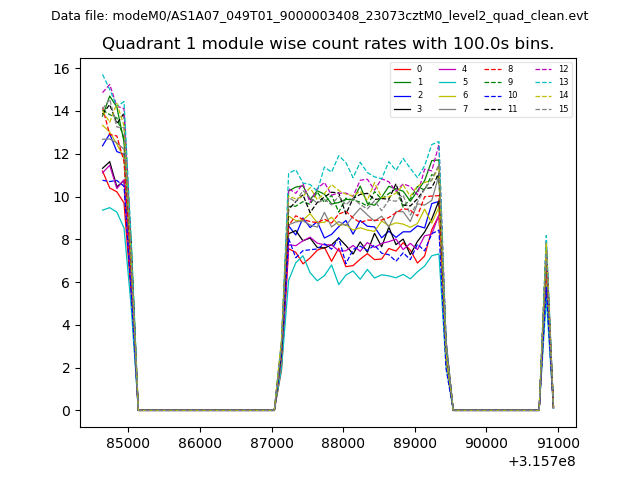
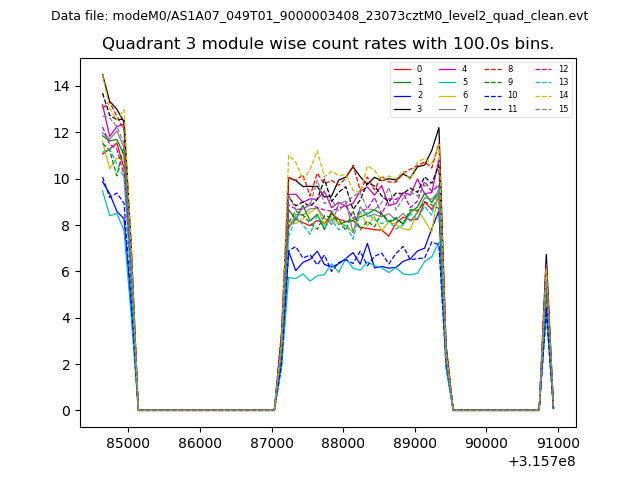
| Module-wise count rates for Quadrant A Data is divided into 100 sec bins |
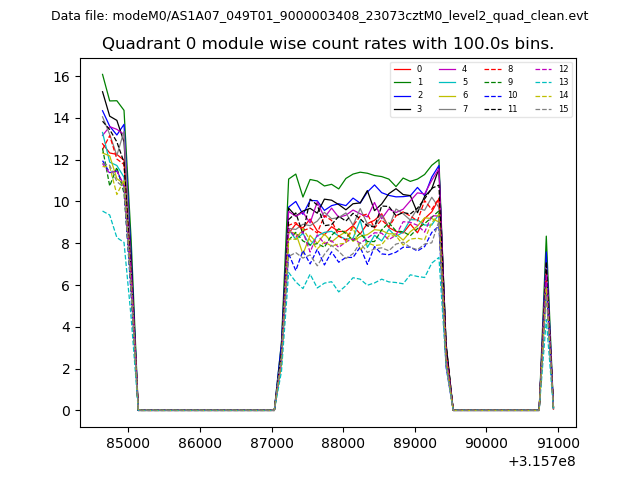 |
 |
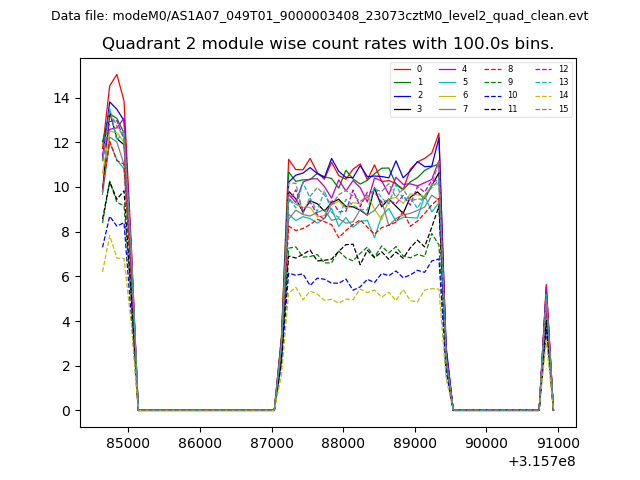
| Module-wise count rates for Quadrant B Data is divided into 100 sec bins |
 |
 |
| Module-wise count rates for Quadrant C Data is divided into 100 sec bins |
 |
 |
| Module-wise count rates for Quadrant D Data is divided into 100 sec bins |
 |
 |
| Parameter | Plot |
|---|---|
| CZT HV Monitor | 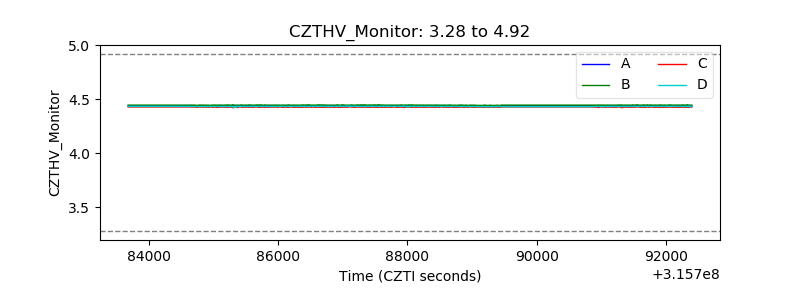 |
| D_VDD | 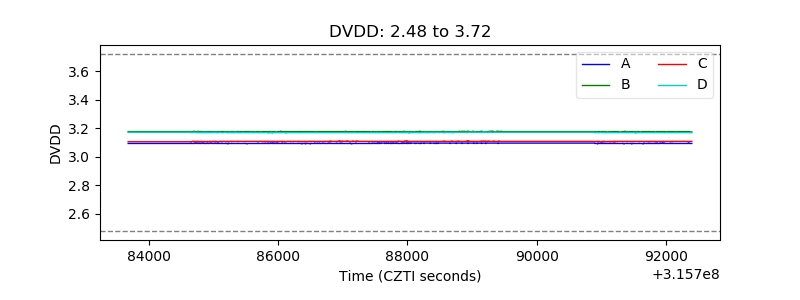 |
| Temperature 1 | 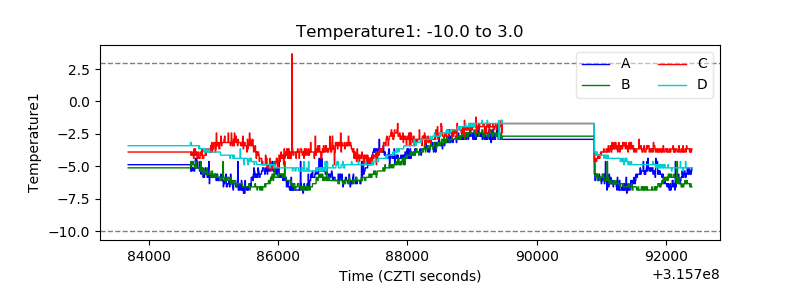 |
| Veto HV Monitor | 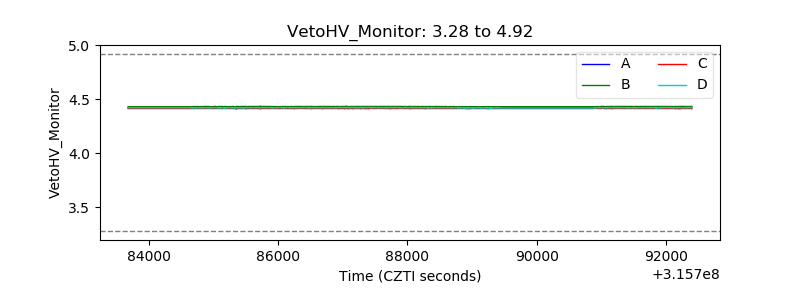 |
| Veto LLD | 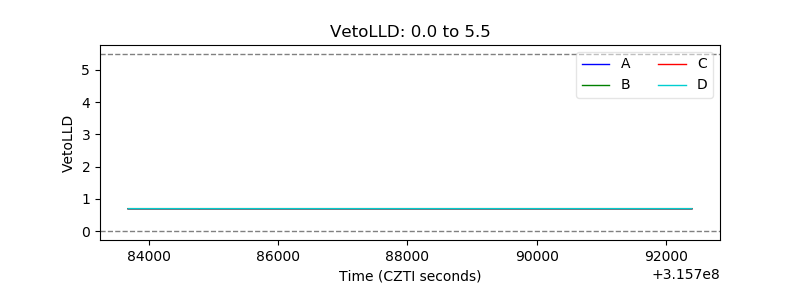 |
| Alpha Counter | 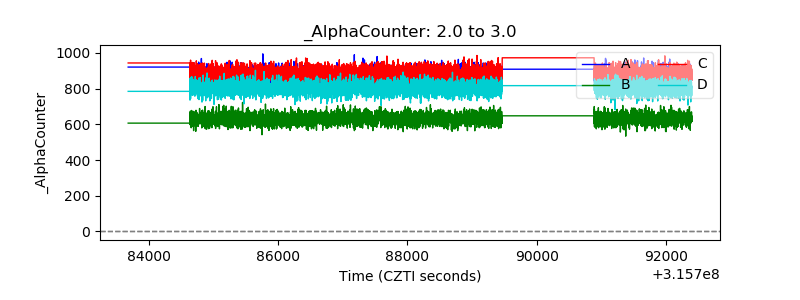 |
| _CPM_Rate | 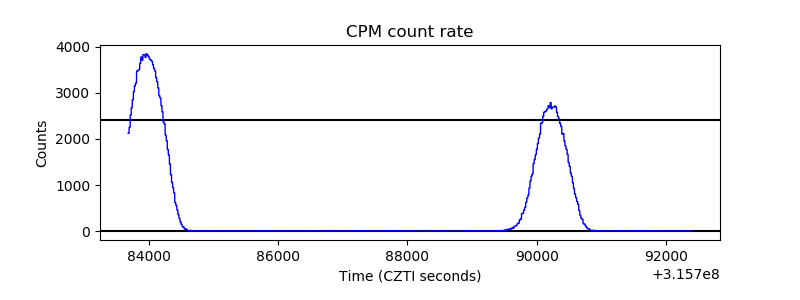 |
| CZT Counter | 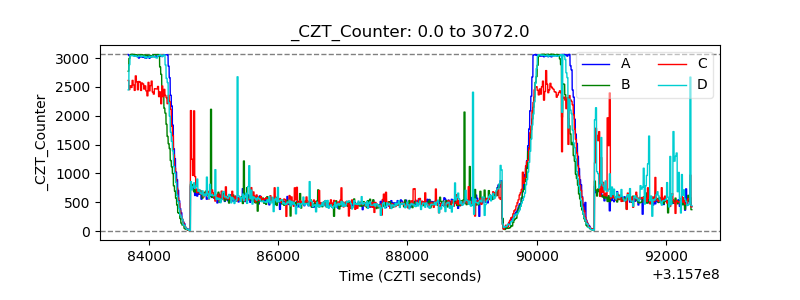 |
| +2.5 Volts monitor |  |
| +5 Volts monitor | 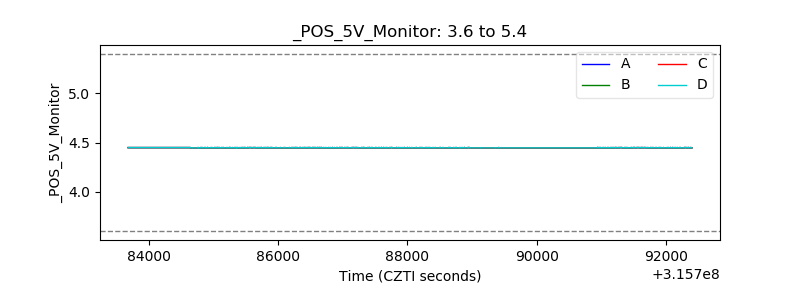 |
| _ROLL_ROT | 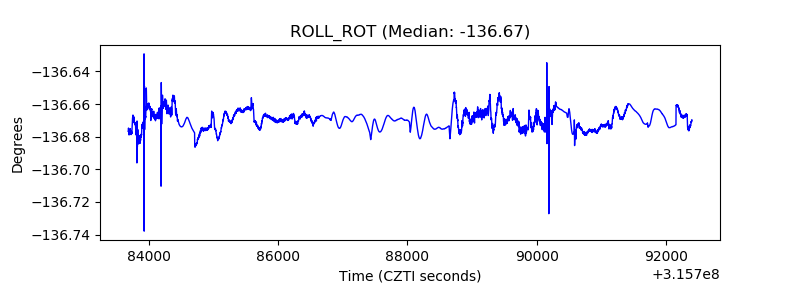 |
| _Roll_DEC | 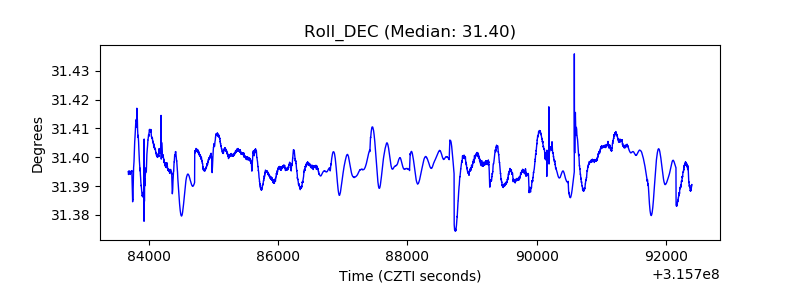 |
| _Roll_RA | 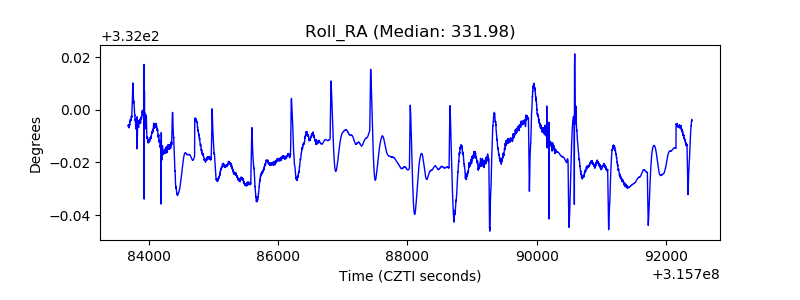 |
| Veto Counter | 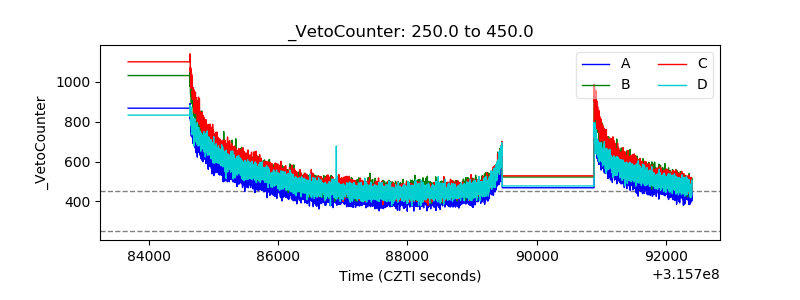 |