| Param | Original file | Final file |
|---|---|---|
| Filename | modeM0/AS1A07_049T01_9000003408_23074cztM0_level2.evt | modeM0/AS1A07_049T01_9000003408_23074cztM0_level2_quad_clean.evt |
| Size (bytes) | 488,471,040 | 66,133,440 |
| Size | 465.8 MB | 63.1 MB |
| Events in quadrant A | 3,322,518 | 393,350 |
| Events in quadrant B | 3,342,036 | 403,507 |
| Events in quadrant C | 3,635,459 | 384,264 |
| Events in quadrant D | 4,059,238 | 374,937 |
| Mode M0 | |||
|---|---|---|---|
| Quadrant | BADHDUFLAG | Total packets | Discarded packets |
| A | 0 | 13649 | 1 |
| B | 0 | 13703 | 1 |
| C | 0 | 14649 | 1 |
| D | 0 | 16123 | 1 |
| Mode M9 | |||
|---|---|---|---|
| Quadrant | BADHDUFLAG | Total packets | Discarded packets |
| A | 0 | 23 | 0 |
| B | 0 | 24 | 0 |
| C | 0 | 24 | 0 |
| D | 0 | 24 | 0 |
| Mode SS | |||
|---|---|---|---|
| Quadrant | BADHDUFLAG | Total packets | Discarded packets |
| A | 0 | 128 | 0 |
| B | 0 | 128 | 0 |
| C | 0 | 128 | 0 |
| D | 0 | 128 | 0 |
| Quadrant | Total seconds | Saturated seconds | Saturation percentage |
|---|---|---|---|
| A | 6401 | 38 | 0.593657% |
| B | 6401 | 55 | 0.859241% |
| C | 6401 | 236 | 3.686924% |
| D | 6401 | 148 | 2.312139% |
Noise dominated data is calculated using 1-second bins in cleaned event files. If a bin has >2000 counts, and if more than 50% of those come from <1% of pixels, then it is considered to be noise-dominated and hence unusable.
| Quadrant | # 1 sec bins | Bins with >0 counts | Bins with >2000 counts | High rate bins dominated by noise | Noise dominated (total time) | Noise dominated (detector-on time) | Marked lightcurve |
|---|---|---|---|---|---|---|---|
| A | 7696 | 6402 | 6 | 6 | 0.08% | 0.09% | 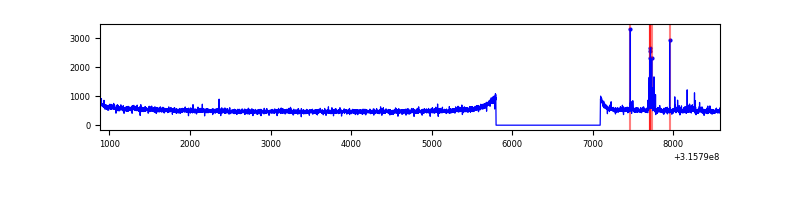 |
| B | 7696 | 6402 | 8 | 8 | 0.10% | 0.12% | 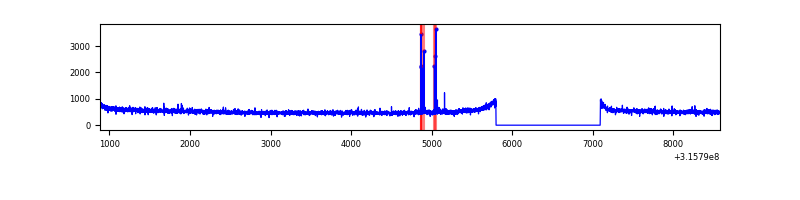 |
| C | 7696 | 6402 | 57 | 57 | 0.74% | 0.89% | 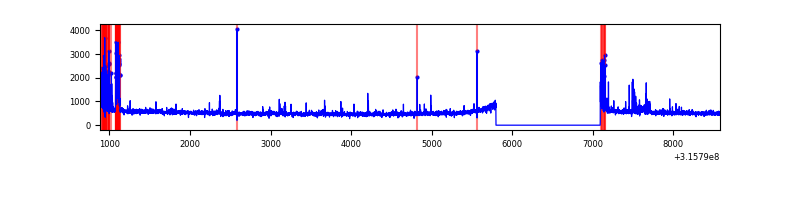 |
| D | 7696 | 6402 | 120 | 120 | 1.56% | 1.87% | 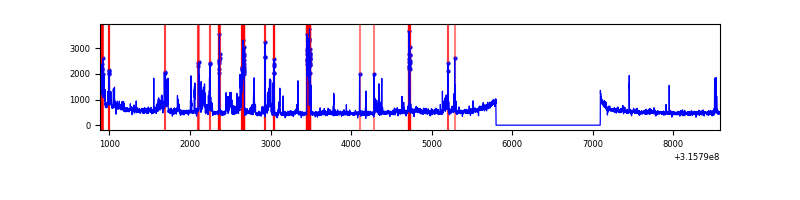 |
Top three noisy pixels from each quadrant. If the there are fewer than three noisy pixels in the level2.evt file, extra rows are filled as -1
| Pixel properties | Quadrant properties | ||||||
|---|---|---|---|---|---|---|---|
| Quadrant | DetID | PixID | Counts | Sigma | Mean | Median | Sigma |
| A | 6 | 16 | 93245 | 554.86 | 837 | 822 | 166.6 |
| A | 13 | 254 | 9603 | 52.72 | 837 | 822 | 166.6 |
| A | 0 | 226 | 7340 | 39.13 | 837 | 822 | 166.6 |
| B | 4 | 216 | 37543 | 231.97 | 839 | 819 | 158.3 |
| B | 12 | 111 | 19026 | 115.01 | 839 | 819 | 158.3 |
| B | 11 | 111 | 16912 | 101.65 | 839 | 819 | 158.3 |
| C | 0 | 10 | 326529 | 1753.68 | 800 | 807 | 185.7 |
| C | 14 | 238 | 129845 | 694.74 | 800 | 807 | 185.7 |
| C | 0 | 207 | 41099 | 216.93 | 800 | 807 | 185.7 |
| D | 1 | 52 | 358017 | 1817.99 | 814 | 794 | 196.5 |
| D | 1 | 239 | 325853 | 1654.3 | 814 | 794 | 196.5 |
| D | 12 | 227 | 214493 | 1087.56 | 814 | 794 | 196.5 |
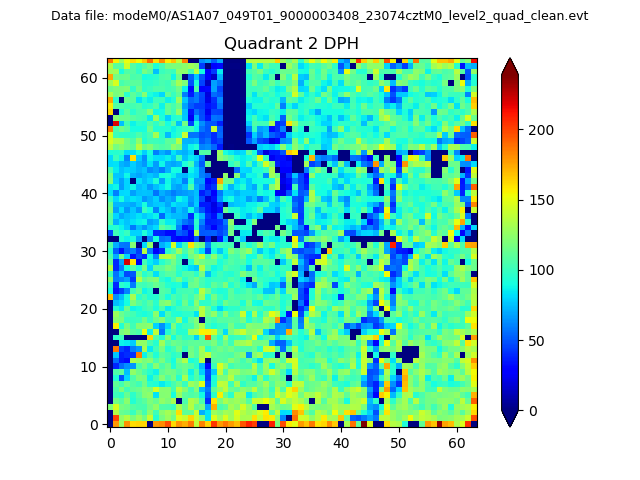
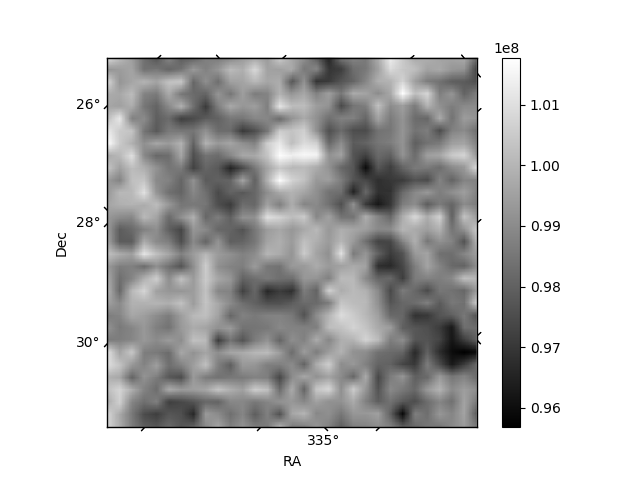
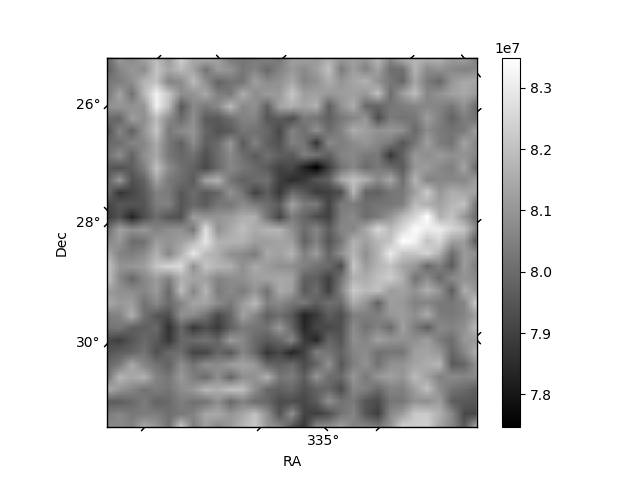
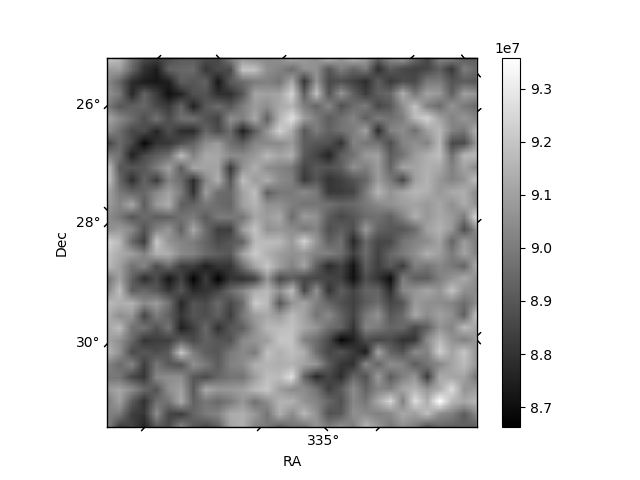
Histogram calculated using DETX and DETY for each event in the final _common_clean file
| Quadrant A | 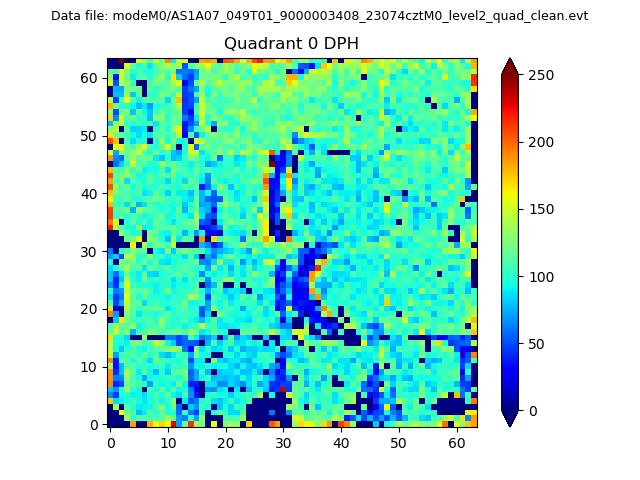 |
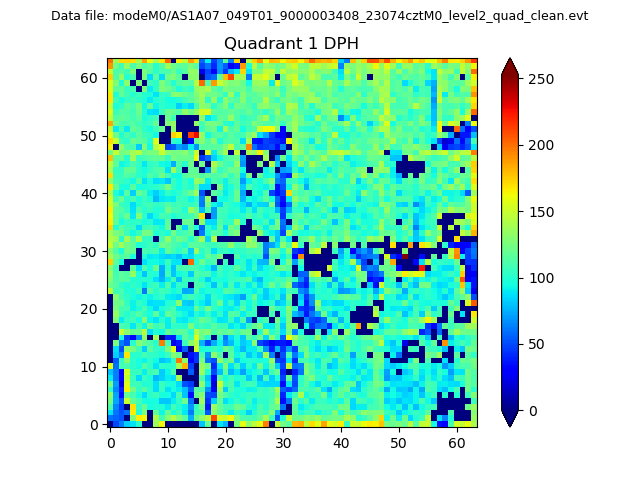 |
Quadrant B |
|---|---|---|---|
| Quadrant D | 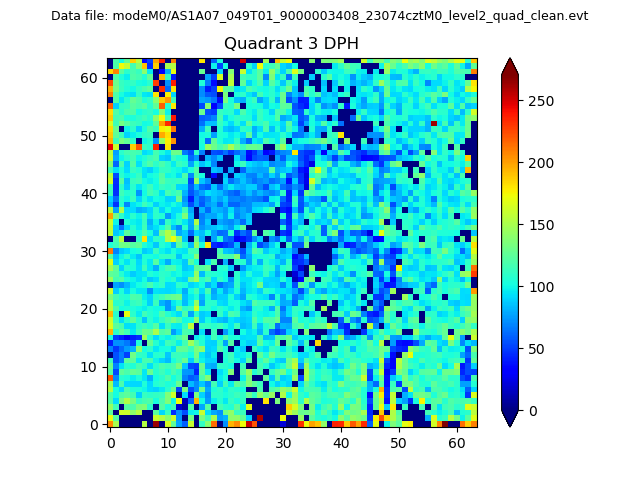 |
 |
Quadrant C |
| Plot type | Count rate plots | Images |
|---|---|---|
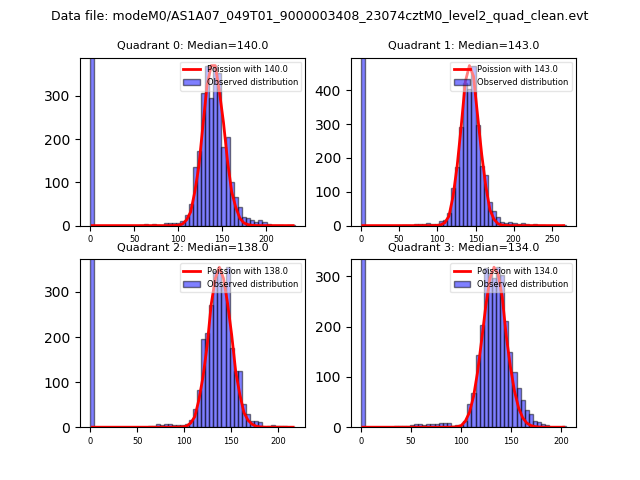
| Comparison with Poisson distribution Blue bars denote a histogram of data divided into 1 sec bins. Red curve is a Poisson curve with rate = median count rate of data. |
 |
 |
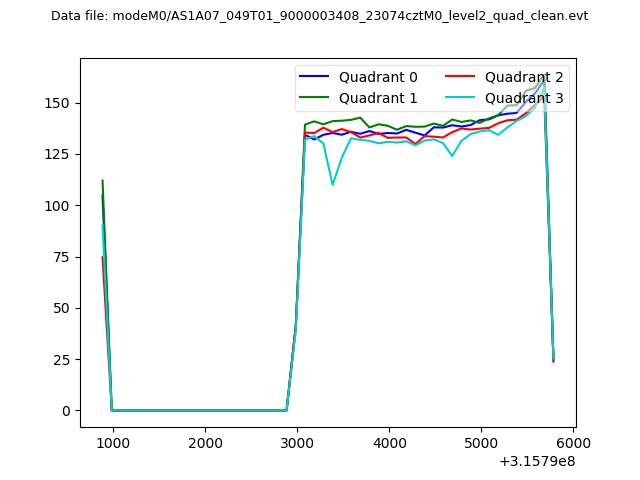
| Quadrant-wise count rates Data is divided into 100 sec bins |
 |
|
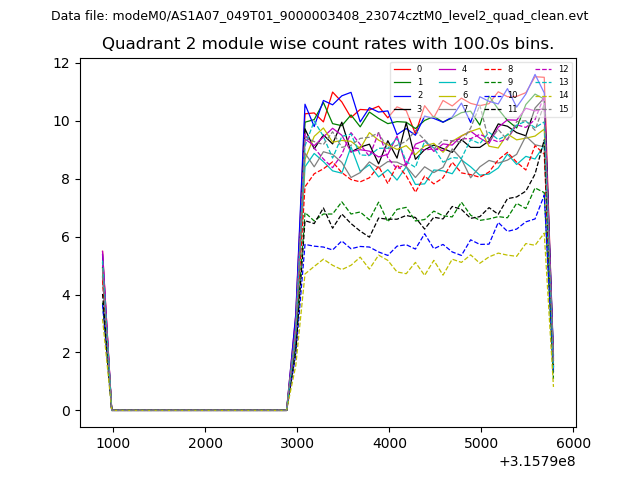
| Module-wise count rates for Quadrant A Data is divided into 100 sec bins |
 |
 |
| Module-wise count rates for Quadrant B Data is divided into 100 sec bins |
 |
 |
| Module-wise count rates for Quadrant C Data is divided into 100 sec bins |
 |
 |
| Module-wise count rates for Quadrant D Data is divided into 100 sec bins |
 |
 |
| Parameter | Plot |
|---|---|
| CZT HV Monitor |  |
| D_VDD | 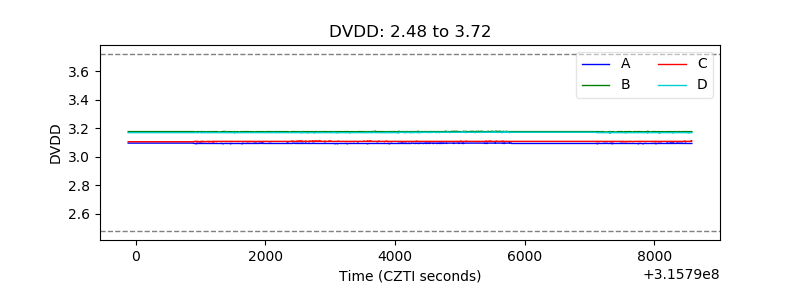 |
| Temperature 1 | 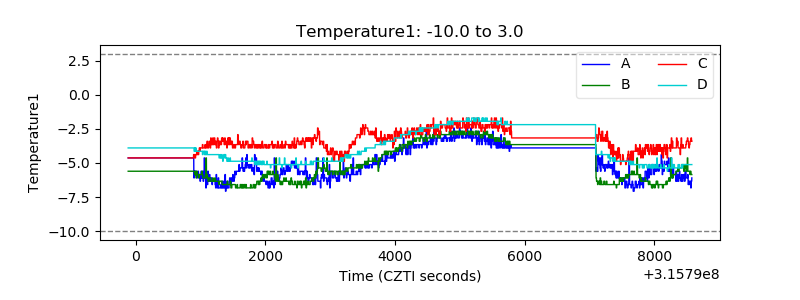 |
| Veto HV Monitor |  |
| Veto LLD | 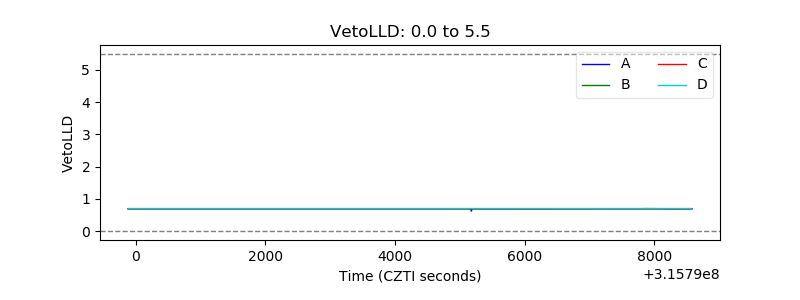 |
| Alpha Counter | 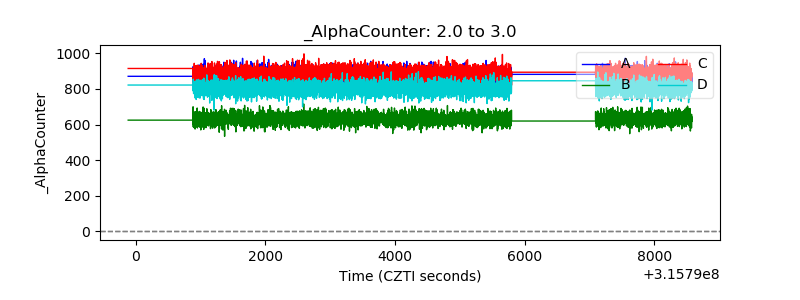 |
| _CPM_Rate | 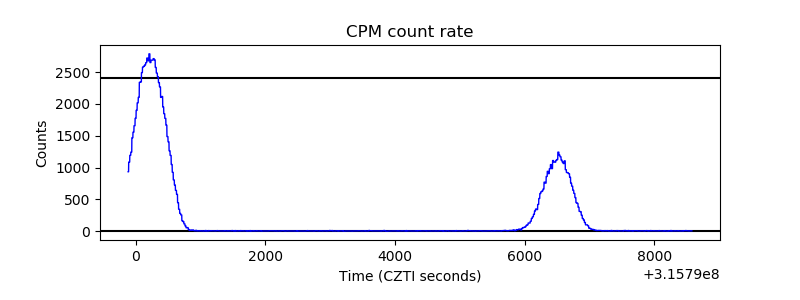 |
| CZT Counter | 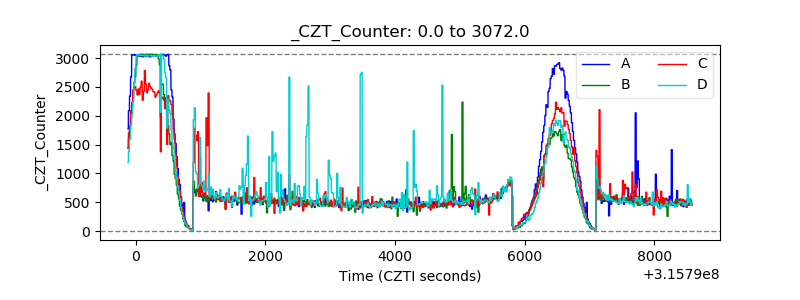 |
| +2.5 Volts monitor | 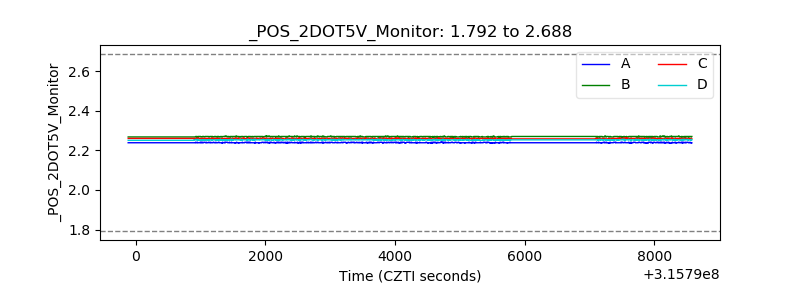 |
| +5 Volts monitor |  |
| _ROLL_ROT | 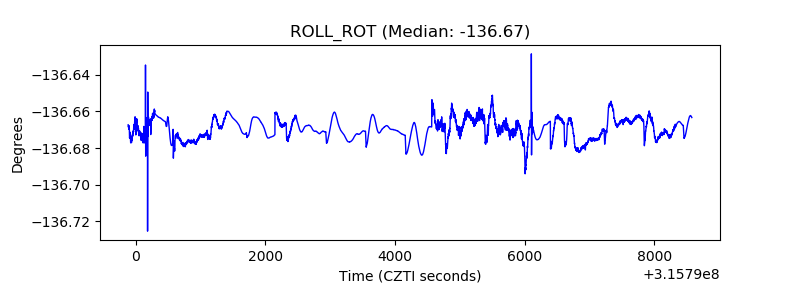 |
| _Roll_DEC | 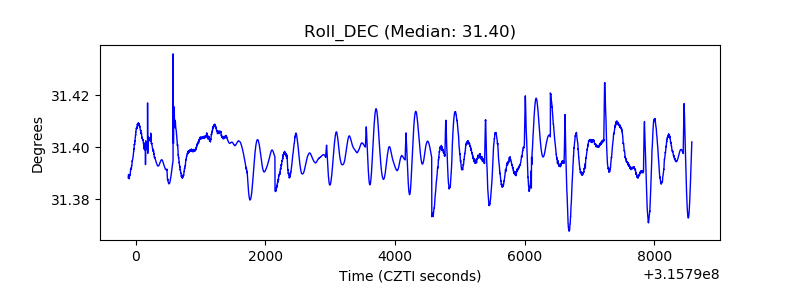 |
| _Roll_RA |  |
| Veto Counter | 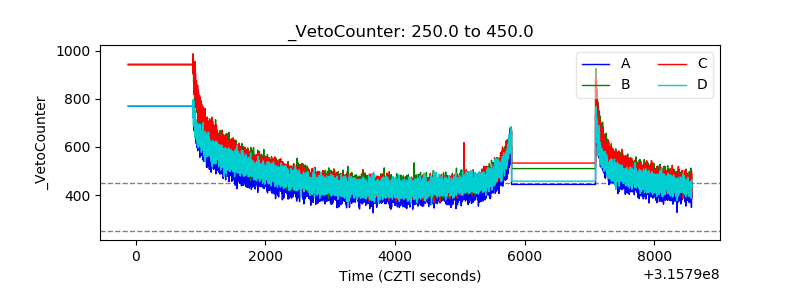 |