| Param | Original file | Final file |
|---|---|---|
| Filename | modeM0/AS1A07_049T01_9000003408_23077cztM0_level2.evt | modeM0/AS1A07_049T01_9000003408_23077cztM0_level2_quad_clean.evt |
| Size (bytes) | 620,187,840 | 92,188,800 |
| Size | 591.5 MB | 87.9 MB |
| Events in quadrant A | 4,584,379 | 564,316 |
| Events in quadrant B | 3,919,738 | 584,887 |
| Events in quadrant C | 3,935,827 | 564,803 |
| Events in quadrant D | 5,807,858 | 529,707 |
| Mode M0 | |||
|---|---|---|---|
| Quadrant | BADHDUFLAG | Total packets | Discarded packets |
| A | 0 | 18765 | 3 |
| B | 0 | 16763 | 3 |
| C | 0 | 16780 | 3 |
| D | 0 | 22572 | 4 |
| Mode M9 | |||
|---|---|---|---|
| Quadrant | BADHDUFLAG | Total packets | Discarded packets |
| A | 0 | 5 | 0 |
| B | 0 | 5 | 0 |
| C | 0 | 5 | 0 |
| D | 0 | 5 | 0 |
| Mode SS | |||
|---|---|---|---|
| Quadrant | BADHDUFLAG | Total packets | Discarded packets |
| A | 0 | 162 | 0 |
| B | 0 | 162 | 0 |
| C | 0 | 162 | 0 |
| D | 0 | 162 | 0 |
| Quadrant | Total seconds | Saturated seconds | Saturation percentage |
|---|---|---|---|
| A | 7878 | 393 | 4.988576% |
| B | 7878 | 304 | 3.858847% |
| C | 7879 | 320 | 4.061429% |
| D | 7878 | 712 | 9.037827% |
Noise dominated data is calculated using 1-second bins in cleaned event files. If a bin has >2000 counts, and if more than 50% of those come from <1% of pixels, then it is considered to be noise-dominated and hence unusable.
| Quadrant | # 1 sec bins | Bins with >0 counts | Bins with >2000 counts | High rate bins dominated by noise | Noise dominated (total time) | Noise dominated (detector-on time) | Marked lightcurve |
|---|---|---|---|---|---|---|---|
| A | 8413 | 7882 | 127 | 127 | 1.51% | 1.61% | 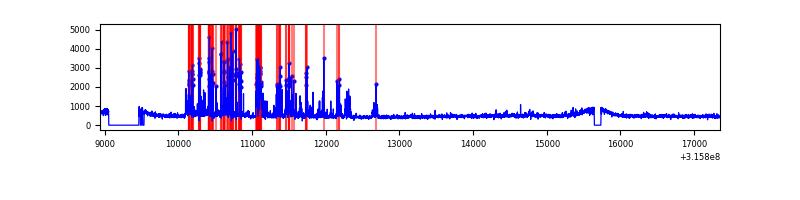 |
| B | 8413 | 7882 | 5 | 5 | 0.06% | 0.06% | 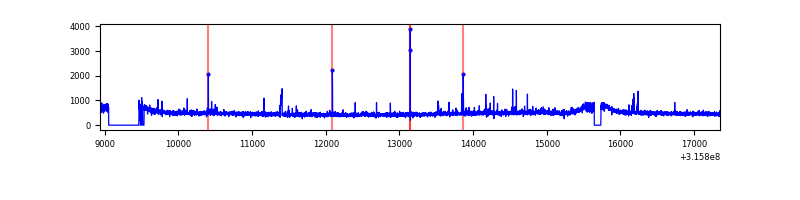 |
| C | 8414 | 7882 | 13 | 13 | 0.15% | 0.16% | 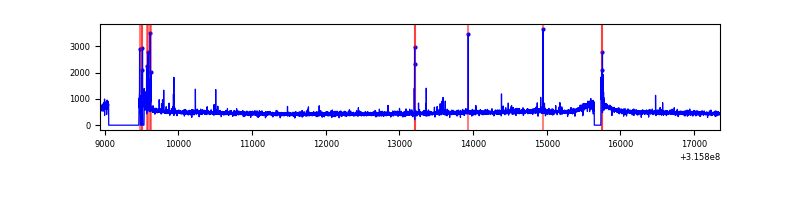 |
| D | 8413 | 7882 | 385 | 385 | 4.58% | 4.88% | 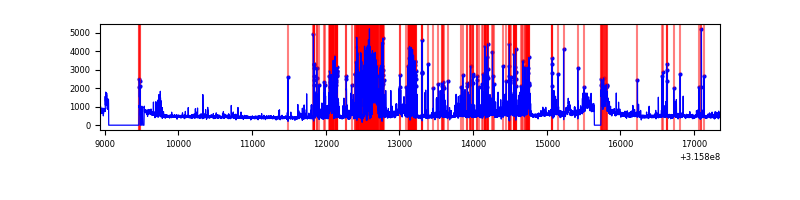 |
Top three noisy pixels from each quadrant. If the there are fewer than three noisy pixels in the level2.evt file, extra rows are filled as -1
| Pixel properties | Quadrant properties | ||||||
|---|---|---|---|---|---|---|---|
| Quadrant | DetID | PixID | Counts | Sigma | Mean | Median | Sigma |
| A | 6 | 16 | 847880 | 4362.19 | 965 | 941 | 194.2 |
| A | 13 | 254 | 10864 | 51.11 | 965 | 941 | 194.2 |
| A | 2 | 79 | 9181 | 42.44 | 965 | 941 | 194.2 |
| B | 3 | 64 | 41006 | 212.21 | 970 | 944 | 188.8 |
| B | 0 | 189 | 40980 | 212.08 | 970 | 944 | 188.8 |
| B | 12 | 111 | 23564 | 119.82 | 970 | 944 | 188.8 |
| C | 14 | 238 | 146287 | 660.73 | 934 | 939 | 220.0 |
| C | 0 | 10 | 127923 | 577.25 | 934 | 939 | 220.0 |
| C | 2 | 16 | 9689 | 39.78 | 934 | 939 | 220.0 |
| D | 1 | 52 | 2100706 | 9247.84 | 926 | 894 | 227.1 |
| D | 1 | 239 | 71238 | 309.8 | 926 | 894 | 227.1 |
| D | 13 | 104 | 66259 | 287.87 | 926 | 894 | 227.1 |
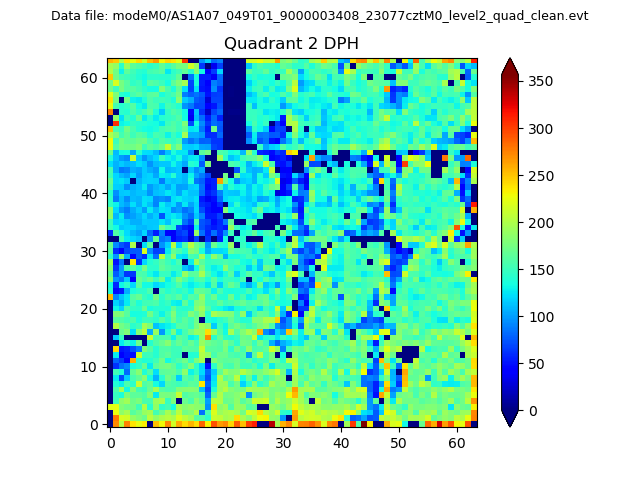
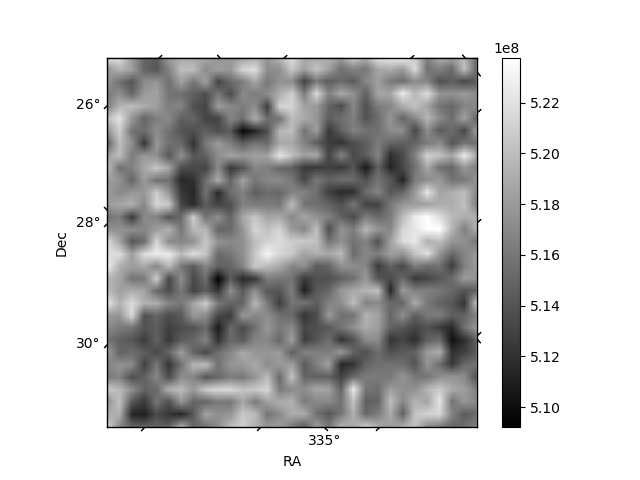
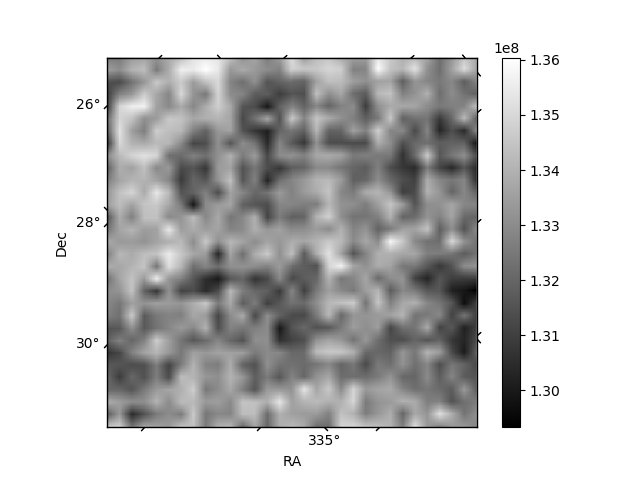
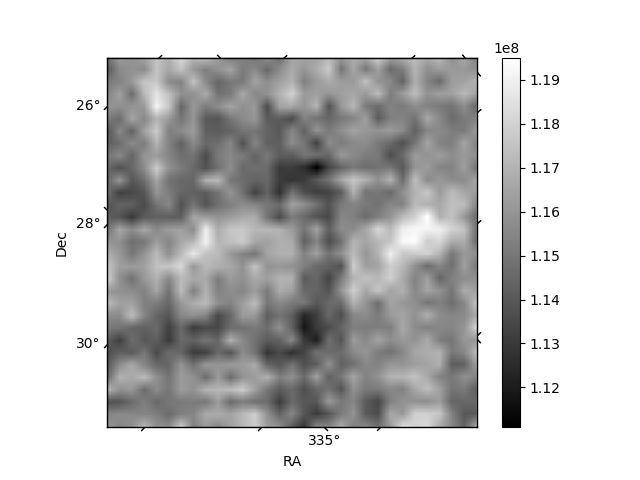
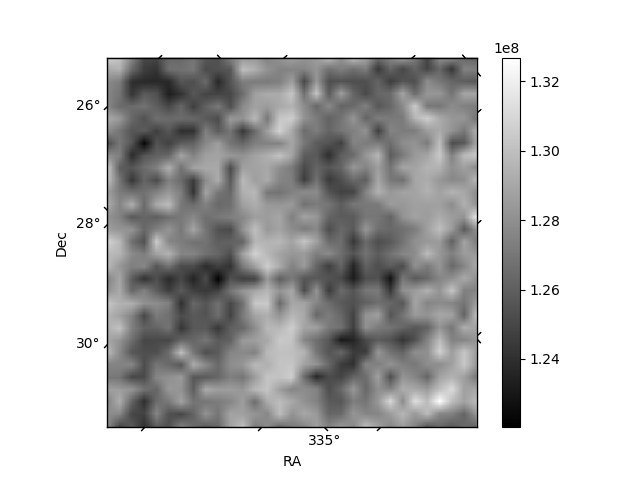
Histogram calculated using DETX and DETY for each event in the final _common_clean file
| Quadrant A | 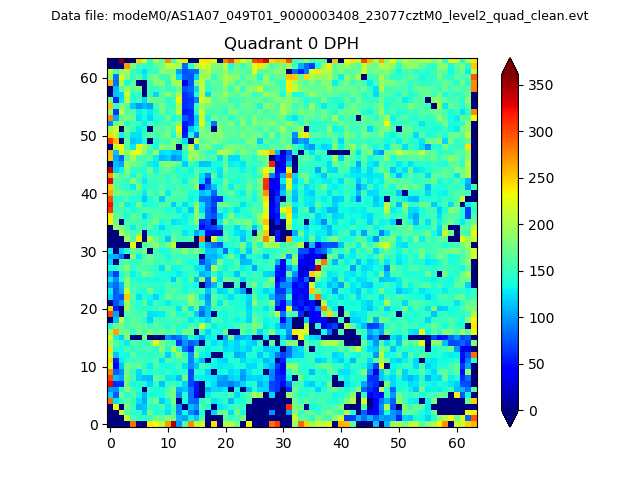 |
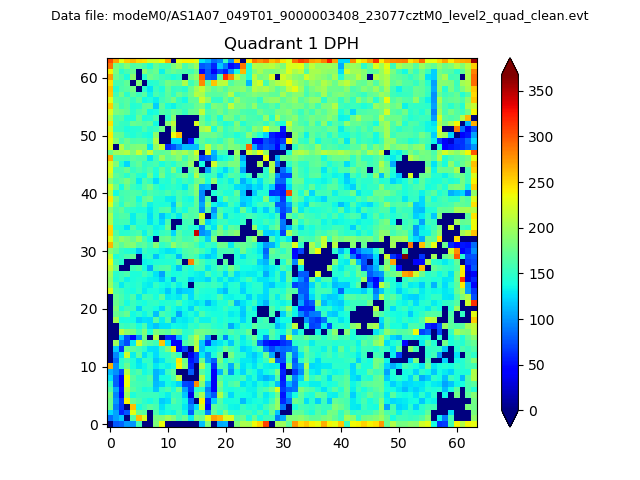 |
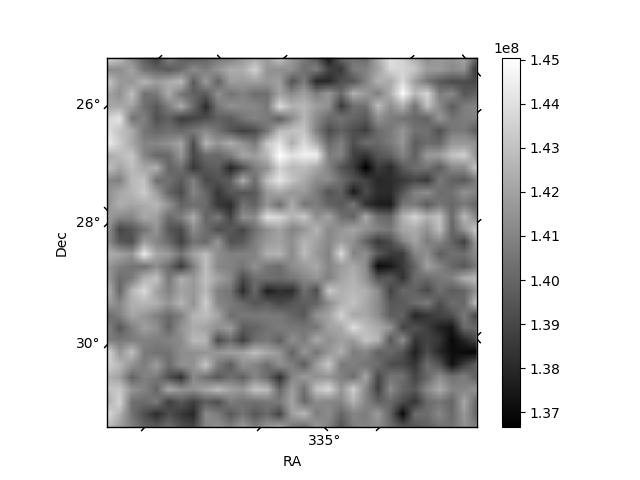
Quadrant B |
|---|---|---|---|
| Quadrant D | 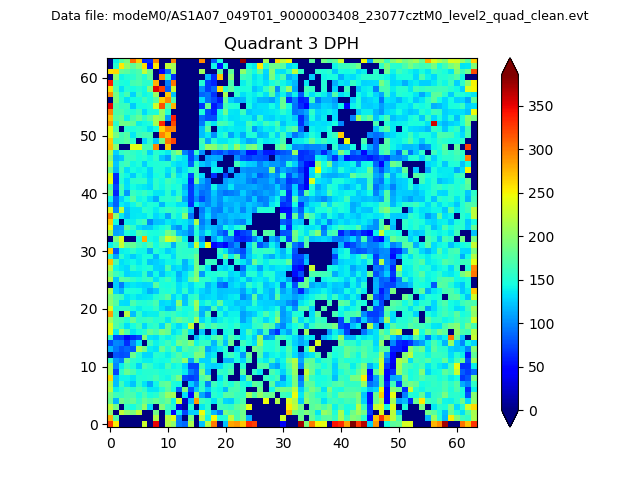 |
 |
Quadrant C |
| Plot type | Count rate plots | Images |
|---|---|---|
| Comparison with Poisson distribution Blue bars denote a histogram of data divided into 1 sec bins. Red curve is a Poisson curve with rate = median count rate of data. |
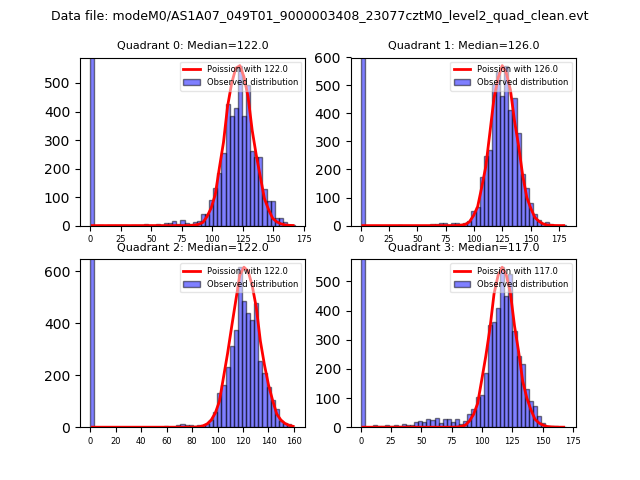 |
 |
| Quadrant-wise count rates Data is divided into 100 sec bins |
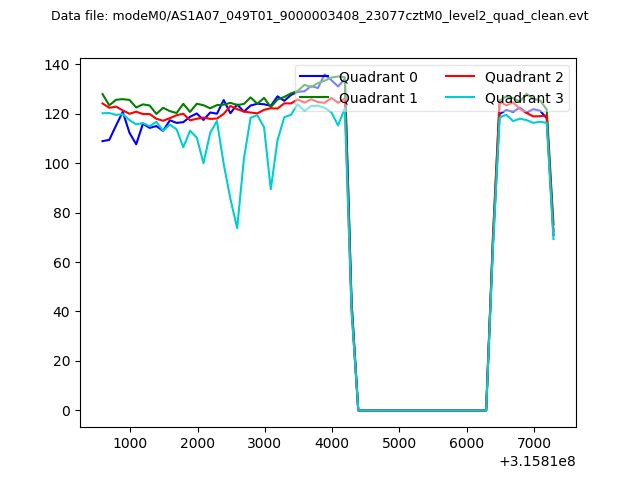 |
|
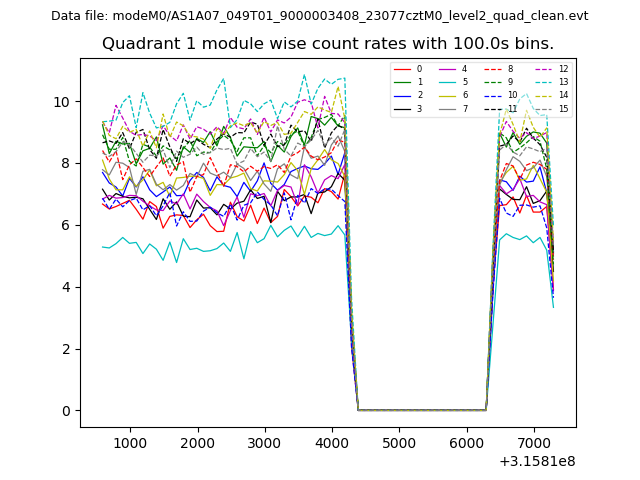
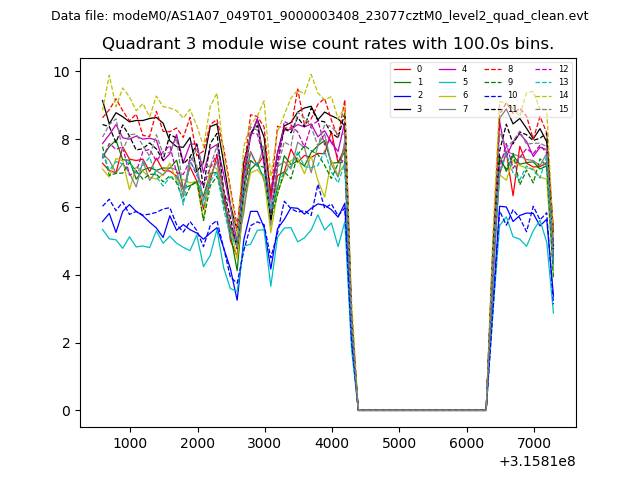
| Module-wise count rates for Quadrant A Data is divided into 100 sec bins |
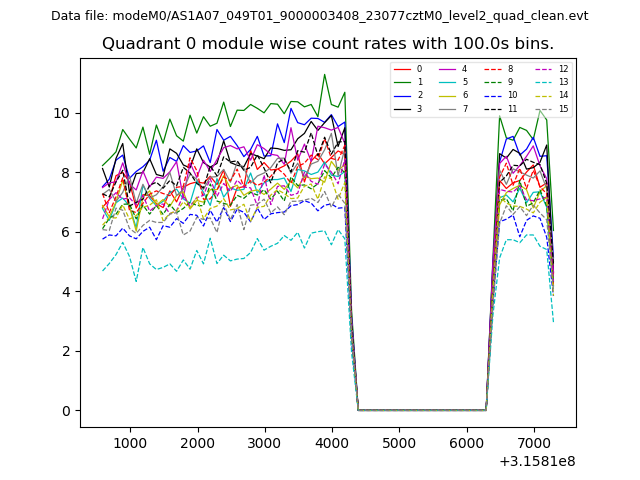 |
 |
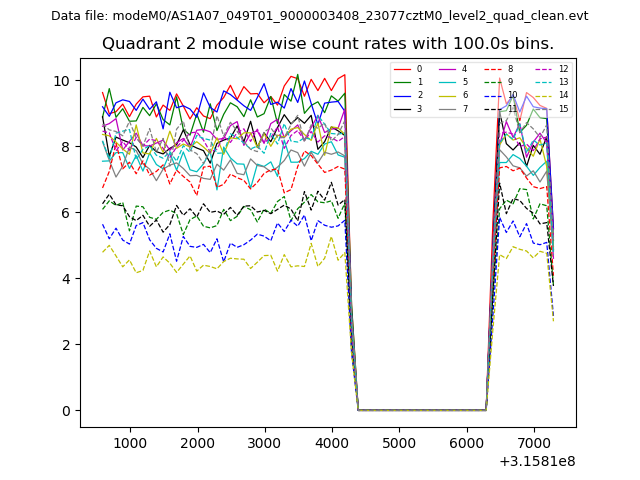
| Module-wise count rates for Quadrant B Data is divided into 100 sec bins |
 |
 |
| Module-wise count rates for Quadrant C Data is divided into 100 sec bins |
 |
 |
| Module-wise count rates for Quadrant D Data is divided into 100 sec bins |
 |
 |
| Parameter | Plot |
|---|---|
| CZT HV Monitor | 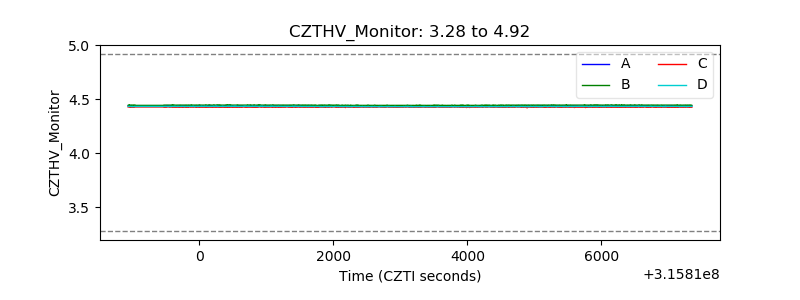 |
| D_VDD | 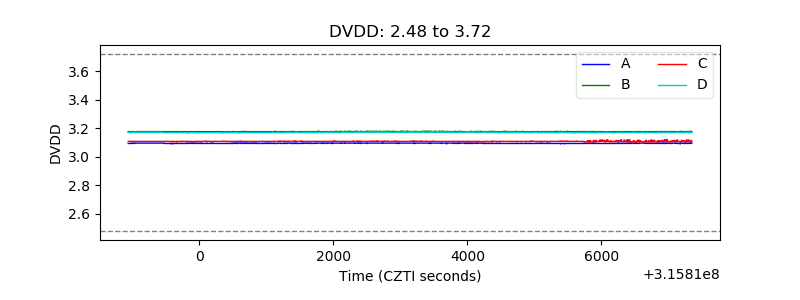 |
| Temperature 1 | 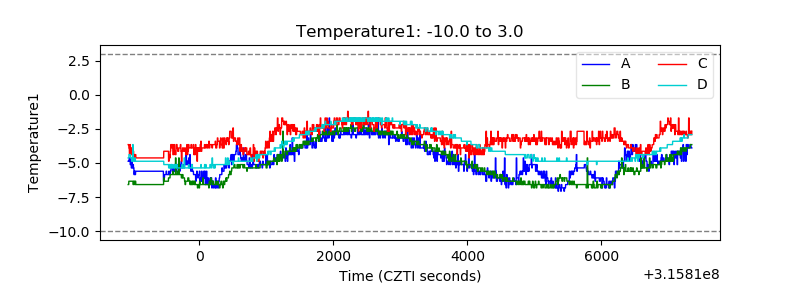 |
| Veto HV Monitor | 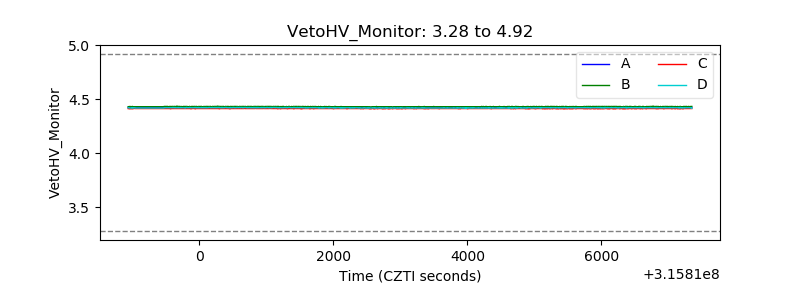 |
| Veto LLD | 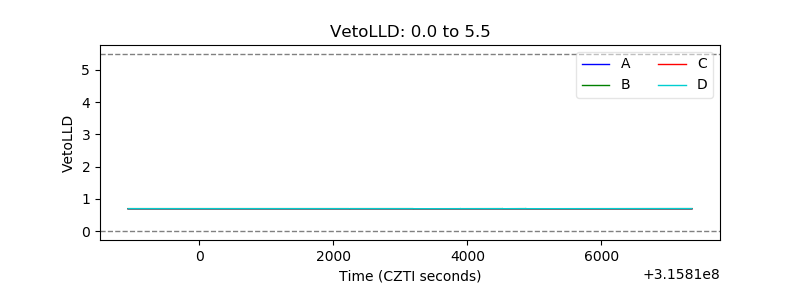 |
| Alpha Counter | 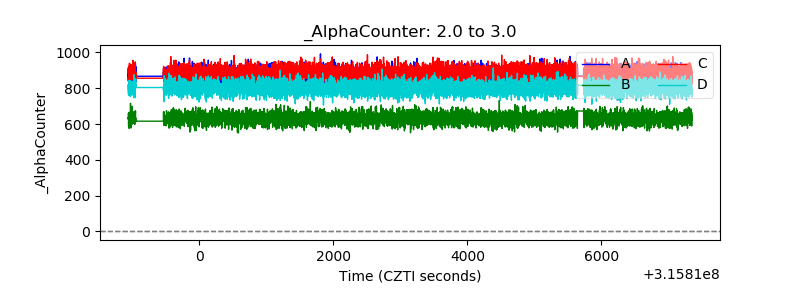 |
| _CPM_Rate | 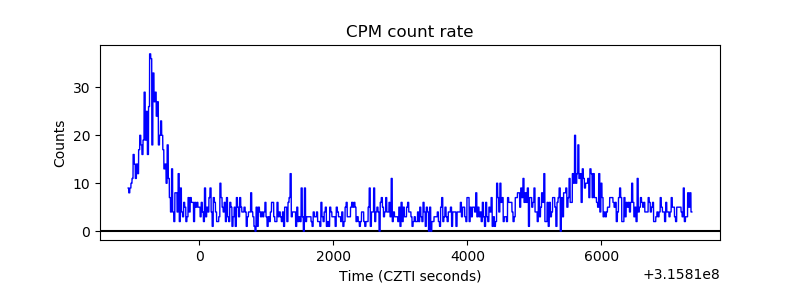 |
| CZT Counter | 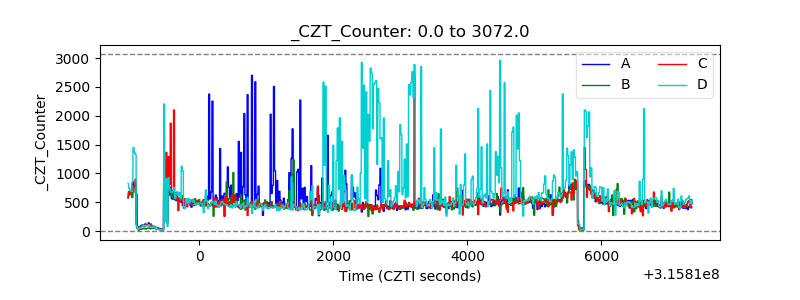 |
| +2.5 Volts monitor |  |
| +5 Volts monitor | 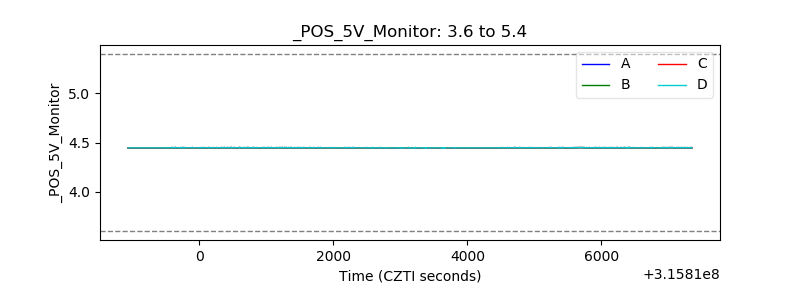 |
| _ROLL_ROT | 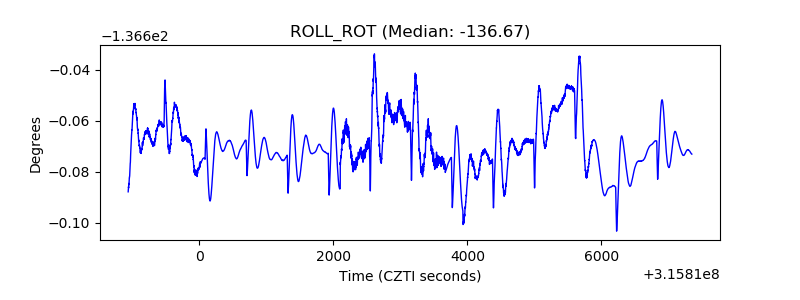 |
| _Roll_DEC | 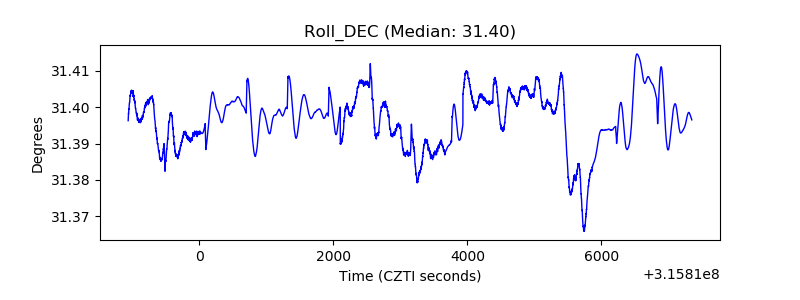 |
| _Roll_RA | 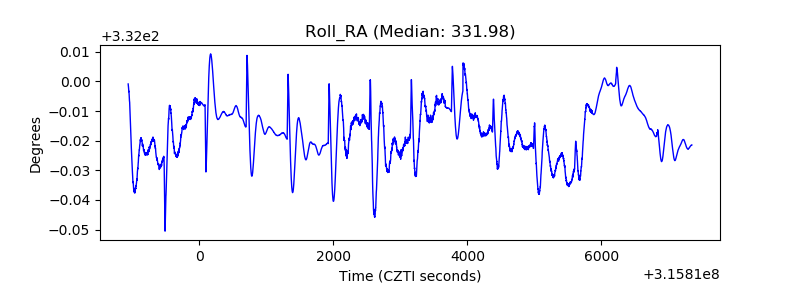 |
| Veto Counter | 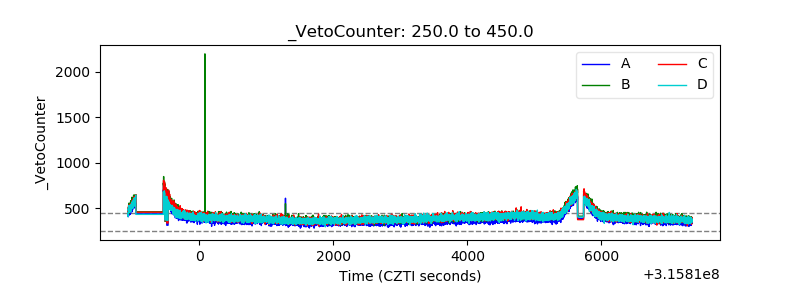 |