| Param | Original file | Final file |
|---|---|---|
| Filename | modeM0/AS1A07_049T01_9000003408_23078cztM0_level2.evt | modeM0/AS1A07_049T01_9000003408_23078cztM0_level2_quad_clean.evt |
| Size (bytes) | 522,648,000 | 98,971,200 |
| Size | 498.4 MB | 94.4 MB |
| Events in quadrant A | 3,534,906 | 626,090 |
| Events in quadrant B | 3,807,797 | 635,063 |
| Events in quadrant C | 3,726,373 | 612,226 |
| Events in quadrant D | 4,247,448 | 599,688 |
| Mode M0 | |||
|---|---|---|---|
| Quadrant | BADHDUFLAG | Total packets | Discarded packets |
| A | 0 | 15430 | 2 |
| B | 0 | 16026 | 2 |
| C | 0 | 15926 | 2 |
| D | 0 | 17431 | 2 |
| Mode M9 | |||
|---|---|---|---|
| Quadrant | BADHDUFLAG | Total packets | Discarded packets |
| A | 0 | 2 | 0 |
| B | 0 | 2 | 0 |
| C | 0 | 2 | 0 |
| D | 0 | 2 | 0 |
| Mode SS | |||
|---|---|---|---|
| Quadrant | BADHDUFLAG | Total packets | Discarded packets |
| A | 0 | 154 | 0 |
| B | 0 | 154 | 0 |
| C | 0 | 154 | 0 |
| D | 0 | 154 | 0 |
| Quadrant | Total seconds | Saturated seconds | Saturation percentage |
|---|---|---|---|
| A | 7530 | 132 | 1.752988% |
| B | 7531 | 177 | 2.350285% |
| C | 7531 | 184 | 2.443235% |
| D | 7530 | 125 | 1.660027% |
Noise dominated data is calculated using 1-second bins in cleaned event files. If a bin has >2000 counts, and if more than 50% of those come from <1% of pixels, then it is considered to be noise-dominated and hence unusable.
| Quadrant | # 1 sec bins | Bins with >0 counts | Bins with >2000 counts | High rate bins dominated by noise | Noise dominated (total time) | Noise dominated (detector-on time) | Marked lightcurve |
|---|---|---|---|---|---|---|---|
| A | 7745 | 7532 | 0 | 0 | 0.00% | 0.00% | 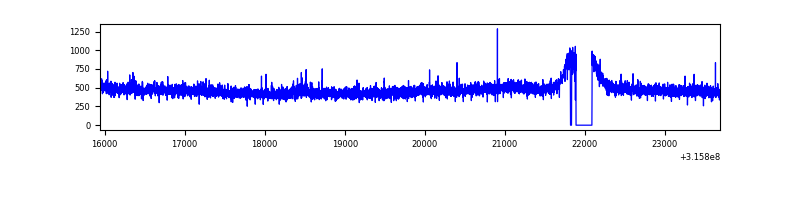 |
| B | 7746 | 7533 | 29 | 29 | 0.37% | 0.38% | 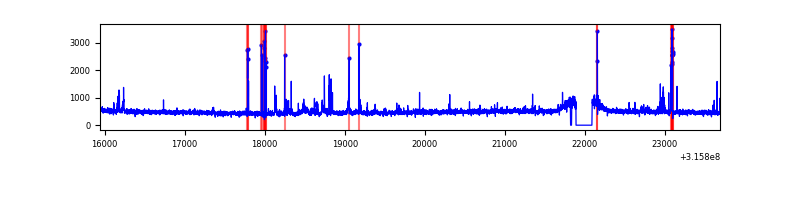 |
| C | 7746 | 7533 | 27 | 27 | 0.35% | 0.36% | 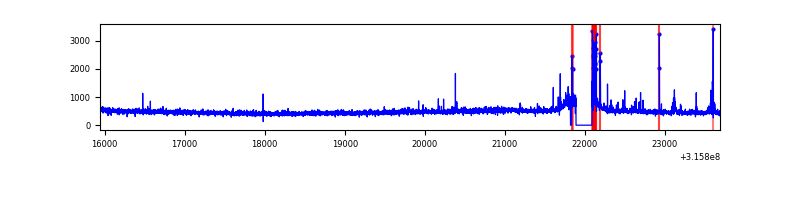 |
| D | 7745 | 7532 | 37 | 37 | 0.48% | 0.49% | 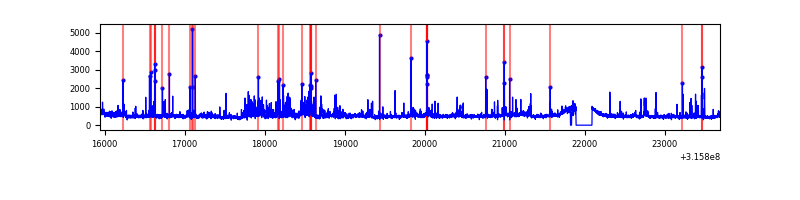 |
Top three noisy pixels from each quadrant. If the there are fewer than three noisy pixels in the level2.evt file, extra rows are filled as -1
| Pixel properties | Quadrant properties | ||||||
|---|---|---|---|---|---|---|---|
| Quadrant | DetID | PixID | Counts | Sigma | Mean | Median | Sigma |
| A | 6 | 16 | 20374 | 105.24 | 911 | 892 | 185.1 |
| A | 13 | 254 | 11491 | 57.26 | 911 | 892 | 185.1 |
| A | 3 | 137 | 8555 | 41.4 | 911 | 892 | 185.1 |
| B | 3 | 64 | 67805 | 380.09 | 904 | 880 | 176.1 |
| B | 14 | 207 | 60979 | 341.33 | 904 | 880 | 176.1 |
| B | 4 | 216 | 52241 | 291.7 | 904 | 880 | 176.1 |
| C | 0 | 10 | 176624 | 853.86 | 869 | 872 | 205.8 |
| C | 14 | 238 | 137352 | 663.06 | 869 | 872 | 205.8 |
| C | 8 | 128 | 7760 | 33.46 | 869 | 872 | 205.8 |
| D | 1 | 52 | 702127 | 3247.38 | 887 | 861 | 215.9 |
| D | 7 | 238 | 53833 | 245.3 | 887 | 861 | 215.9 |
| D | 12 | 227 | 51067 | 232.49 | 887 | 861 | 215.9 |
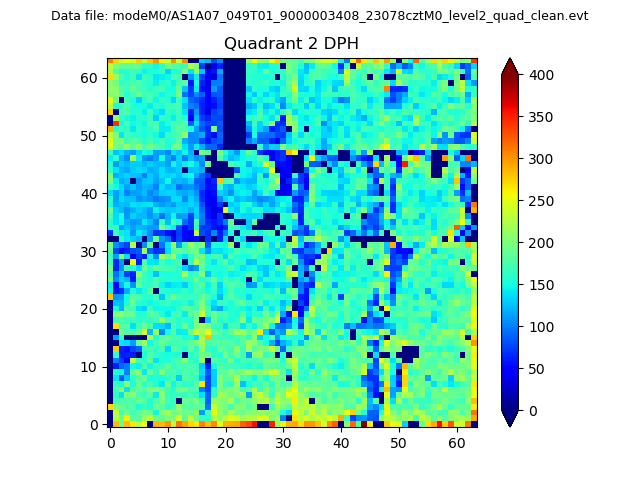
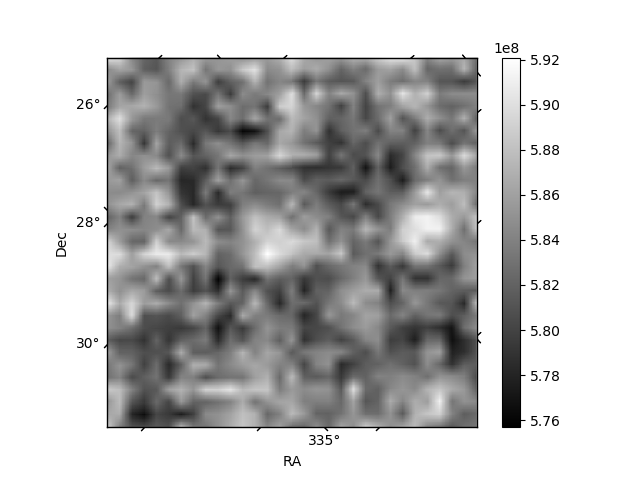
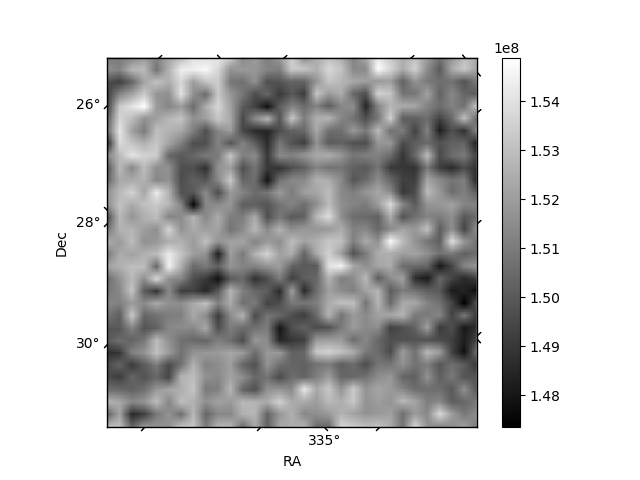
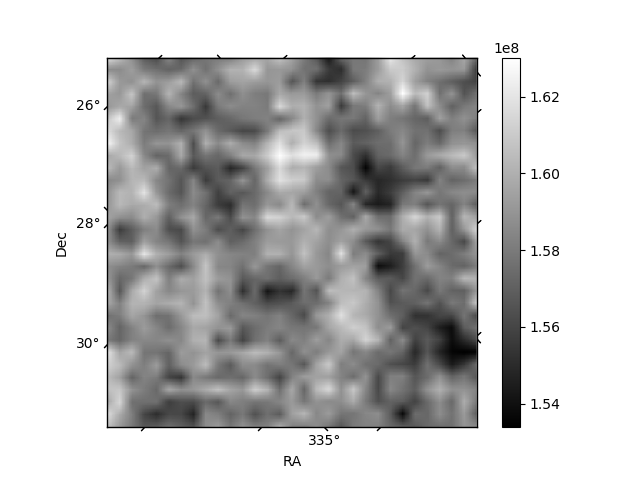
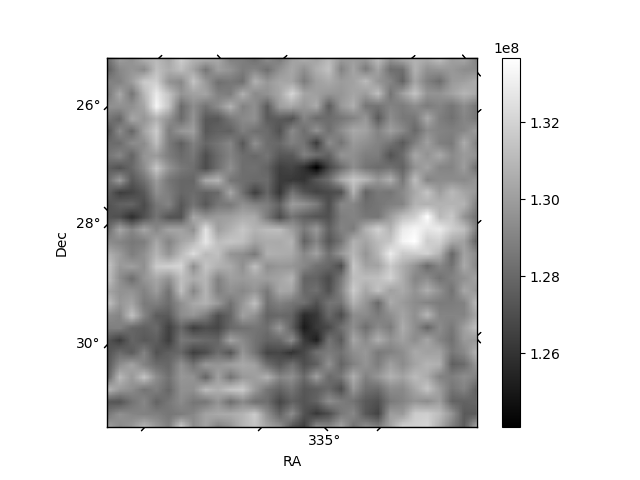
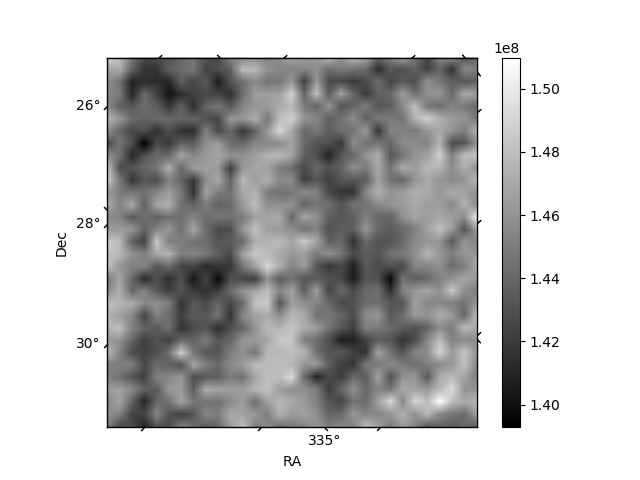
Histogram calculated using DETX and DETY for each event in the final _common_clean file
| Quadrant A | 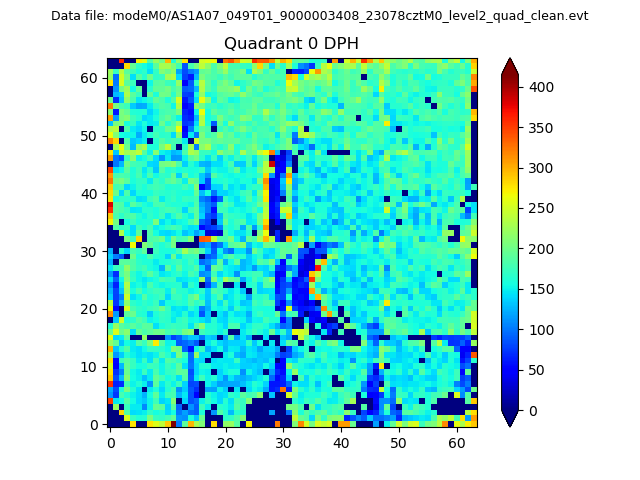 |
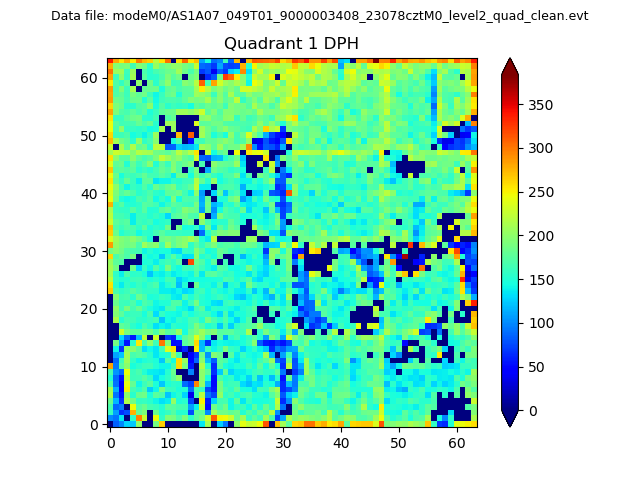 |
Quadrant B |
|---|---|---|---|
| Quadrant D | 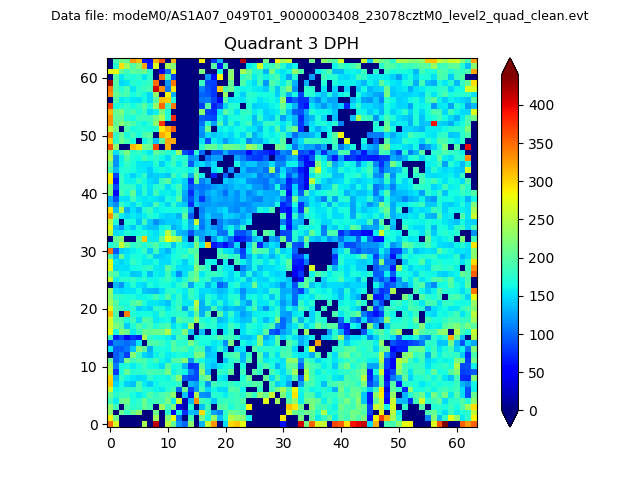 |
 |
Quadrant C |
| Plot type | Count rate plots | Images |
|---|---|---|
| Comparison with Poisson distribution Blue bars denote a histogram of data divided into 1 sec bins. Red curve is a Poisson curve with rate = median count rate of data. |
 |
 |
| Quadrant-wise count rates Data is divided into 100 sec bins |
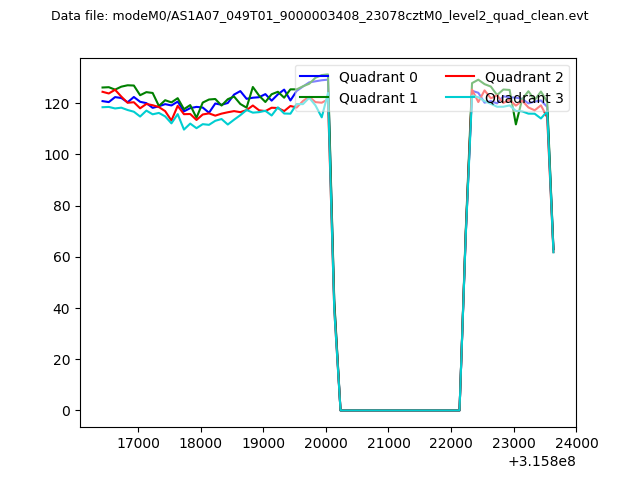 |
|
| Module-wise count rates for Quadrant A Data is divided into 100 sec bins |
 |
 |
| Module-wise count rates for Quadrant B Data is divided into 100 sec bins |
 |
 |
| Module-wise count rates for Quadrant C Data is divided into 100 sec bins |
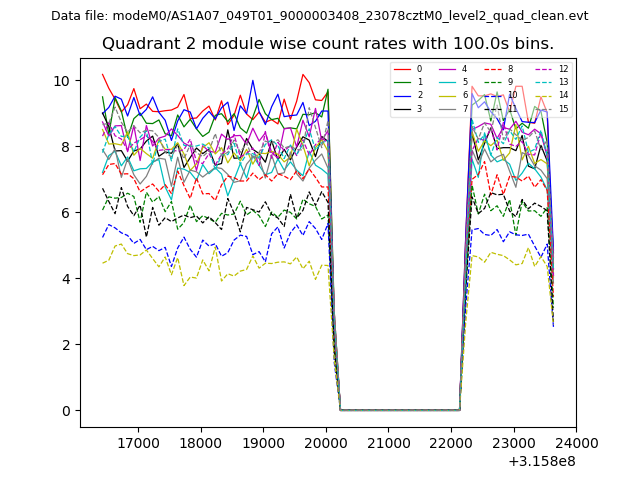 |
 |
| Module-wise count rates for Quadrant D Data is divided into 100 sec bins |
 |
 |
| Parameter | Plot |
|---|---|
| CZT HV Monitor | 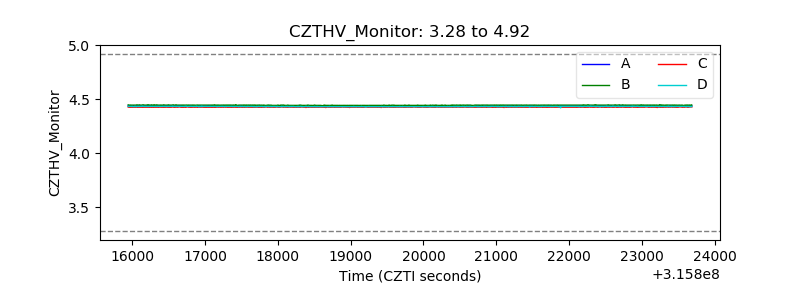 |
| D_VDD | 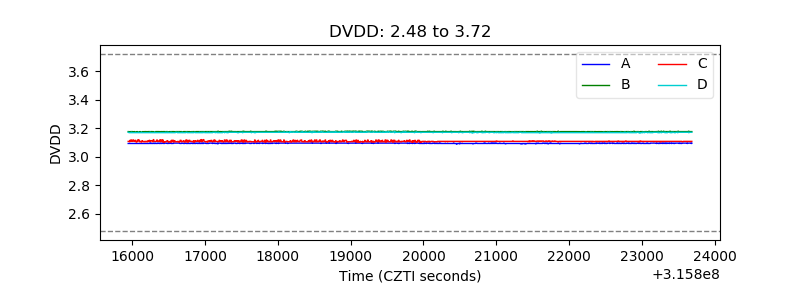 |
| Temperature 1 | 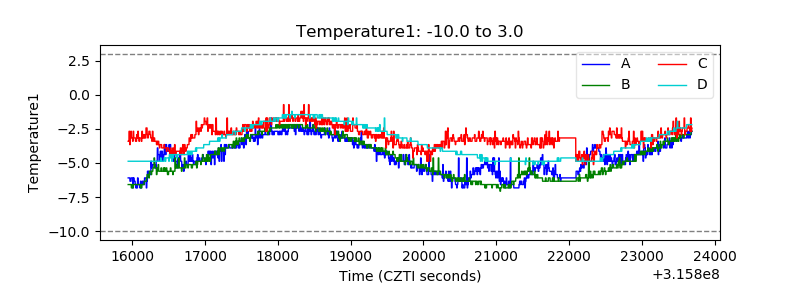 |
| Veto HV Monitor |  |
| Veto LLD | 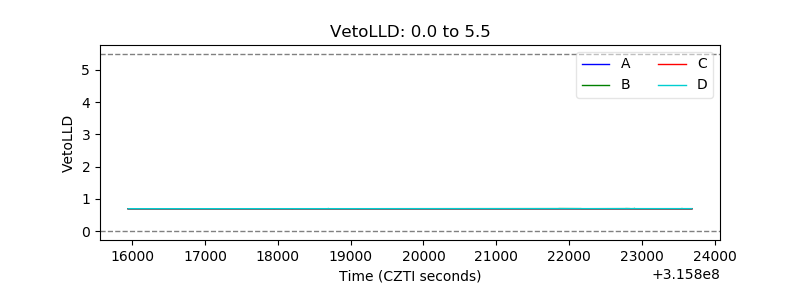 |
| Alpha Counter | 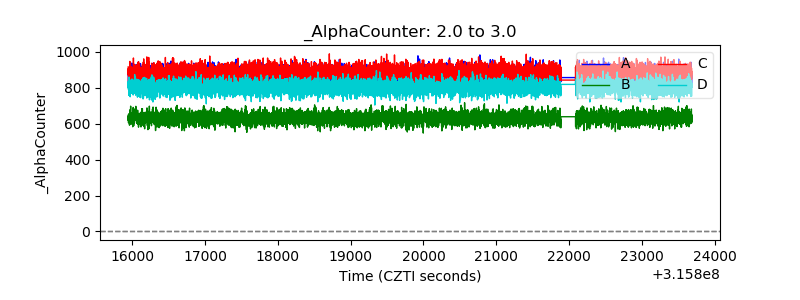 |
| _CPM_Rate | 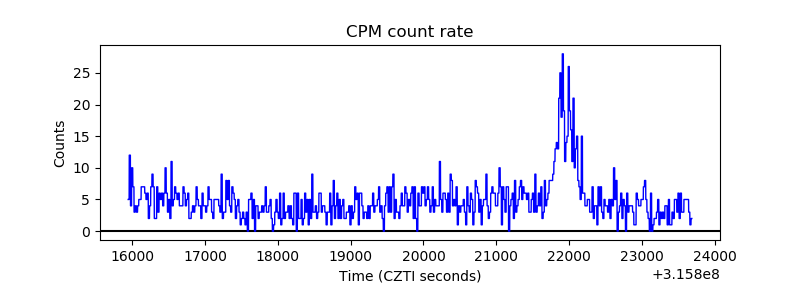 |
| CZT Counter | 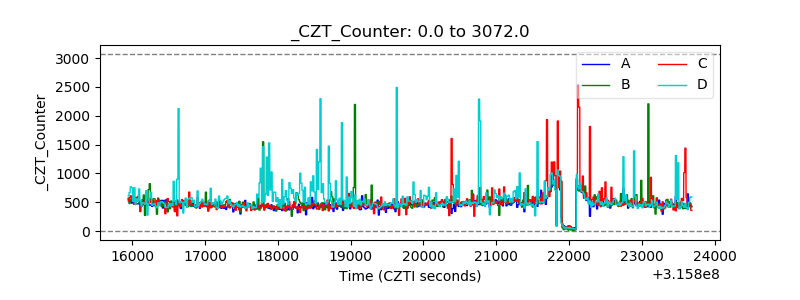 |
| +2.5 Volts monitor |  |
| +5 Volts monitor |  |
| _ROLL_ROT | 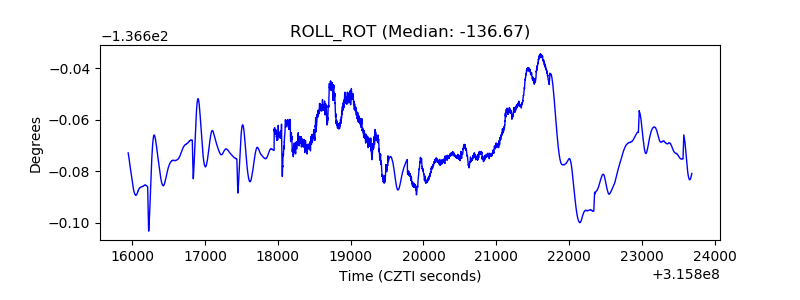 |
| _Roll_DEC | 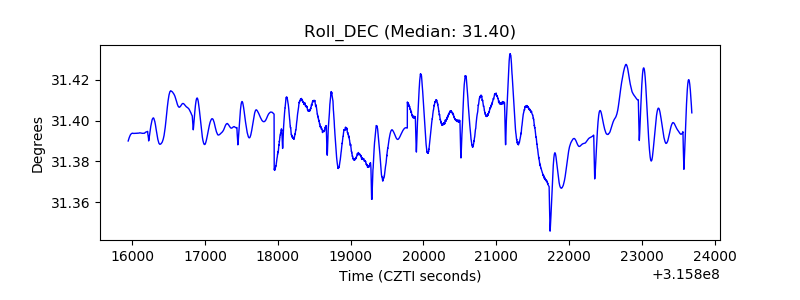 |
| _Roll_RA | 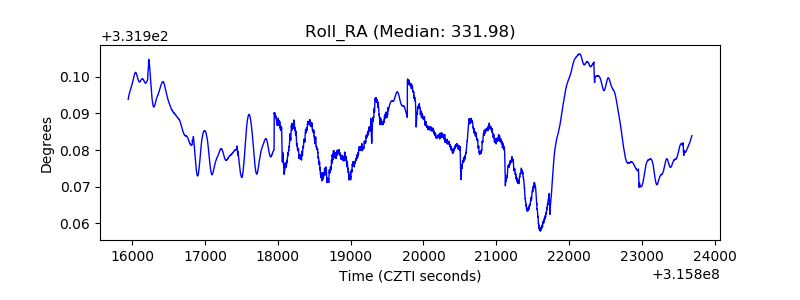 |
| Veto Counter | 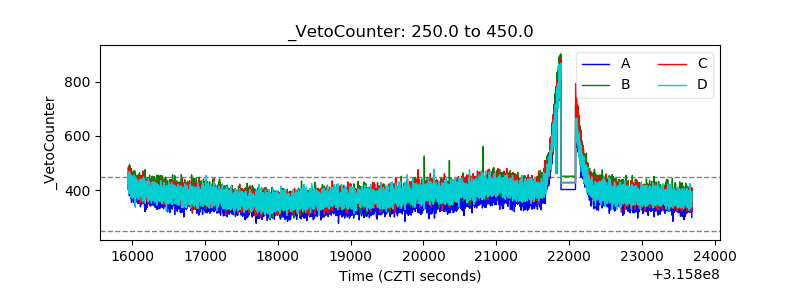 |