| Param | Original file | Final file |
|---|---|---|
| Filename | modeM0/AS1A07_049T01_9000003408_23081cztM0_level2.evt | modeM0/AS1A07_049T01_9000003408_23081cztM0_level2_quad_clean.evt |
| Size (bytes) | 817,375,680 | 144,253,440 |
| Size | 779.5 MB | 137.6 MB |
| Events in quadrant A | 5,351,606 | 914,383 |
| Events in quadrant B | 6,061,025 | 916,040 |
| Events in quadrant C | 5,866,517 | 876,377 |
| Events in quadrant D | 6,691,709 | 861,298 |
| Mode M0 | |||
|---|---|---|---|
| Quadrant | BADHDUFLAG | Total packets | Discarded packets |
| A | 0 | 23634 | 2 |
| B | 0 | 25453 | 2 |
| C | 0 | 24769 | 2 |
| D | 0 | 27574 | 2 |
| Mode M9 | |||
|---|---|---|---|
| Quadrant | BADHDUFLAG | Total packets | Discarded packets |
| A | 0 | 14 | 0 |
| B | 0 | 14 | 0 |
| C | 0 | 14 | 0 |
| D | 0 | 14 | 0 |
| Mode SS | |||
|---|---|---|---|
| Quadrant | BADHDUFLAG | Total packets | Discarded packets |
| A | 0 | 238 | 0 |
| B | 0 | 238 | 0 |
| C | 0 | 238 | 0 |
| D | 0 | 238 | 0 |
| Quadrant | Total seconds | Saturated seconds | Saturation percentage |
|---|---|---|---|
| A | 11561 | 87 | 0.752530% |
| B | 11562 | 204 | 1.764401% |
| C | 11562 | 231 | 1.997924% |
| D | 11562 | 172 | 1.487632% |
Noise dominated data is calculated using 1-second bins in cleaned event files. If a bin has >2000 counts, and if more than 50% of those come from <1% of pixels, then it is considered to be noise-dominated and hence unusable.
| Quadrant | # 1 sec bins | Bins with >0 counts | Bins with >2000 counts | High rate bins dominated by noise | Noise dominated (total time) | Noise dominated (detector-on time) | Marked lightcurve |
|---|---|---|---|---|---|---|---|
| A | 13036 | 11562 | 0 | 0 | 0.00% | 0.00% | 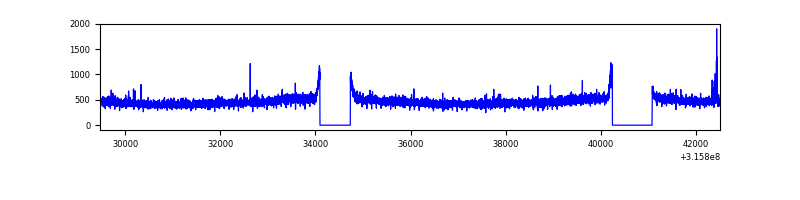 |
| B | 13037 | 11563 | 81 | 81 | 0.62% | 0.70% | 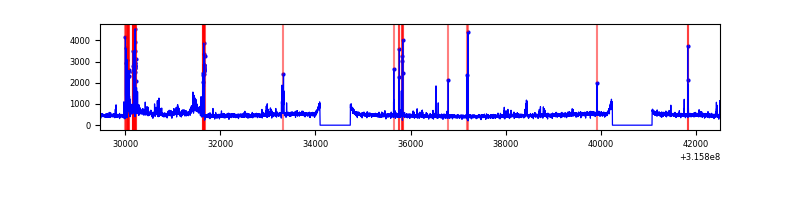 |
| C | 13037 | 11563 | 41 | 41 | 0.31% | 0.35% | 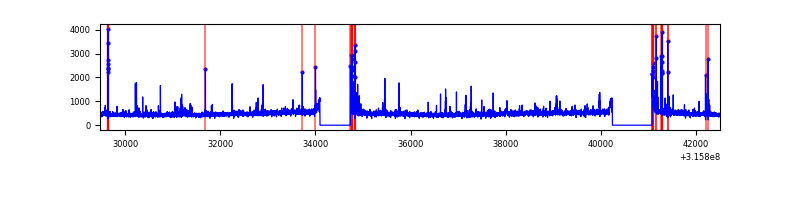 |
| D | 13037 | 11564 | 107 | 107 | 0.82% | 0.93% | 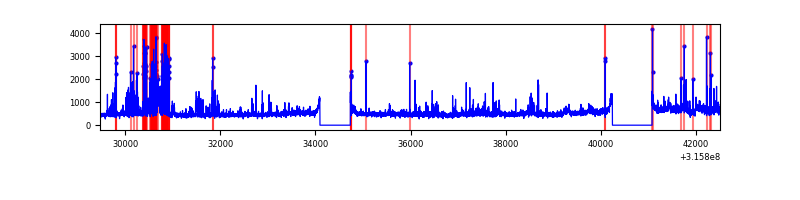 |
Top three noisy pixels from each quadrant. If the there are fewer than three noisy pixels in the level2.evt file, extra rows are filled as -1
| Pixel properties | Quadrant properties | ||||||
|---|---|---|---|---|---|---|---|
| Quadrant | DetID | PixID | Counts | Sigma | Mean | Median | Sigma |
| A | 6 | 16 | 58028 | 204.99 | 1373 | 1341 | 276.5 |
| A | 13 | 254 | 17021 | 56.7 | 1373 | 1341 | 276.5 |
| A | 3 | 137 | 12343 | 39.78 | 1373 | 1341 | 276.5 |
| B | 14 | 207 | 556365 | 2131.36 | 1357 | 1322 | 260.4 |
| B | 3 | 64 | 46150 | 172.14 | 1357 | 1322 | 260.4 |
| B | 0 | 183 | 45297 | 168.86 | 1357 | 1322 | 260.4 |
| C | 0 | 10 | 416120 | 1351.26 | 1311 | 1319 | 307.0 |
| C | 14 | 238 | 206721 | 669.12 | 1311 | 1319 | 307.0 |
| C | 10 | 187 | 62854 | 200.46 | 1311 | 1319 | 307.0 |
| D | 1 | 52 | 1075862 | 3287.26 | 1338 | 1298 | 326.9 |
| D | 12 | 227 | 283777 | 864.15 | 1338 | 1298 | 326.9 |
| D | 7 | 238 | 149352 | 452.92 | 1338 | 1298 | 326.9 |
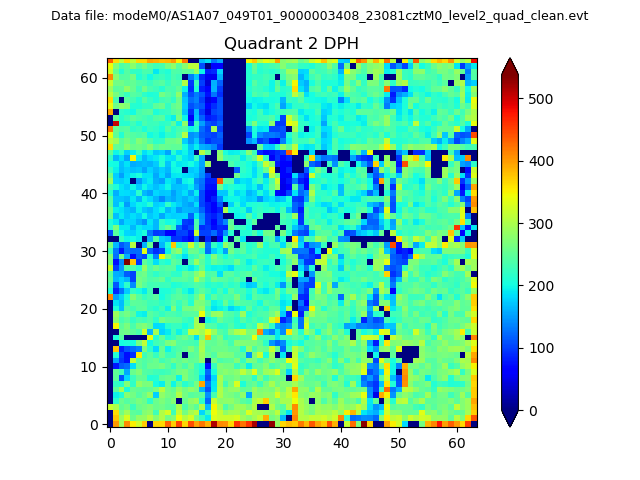
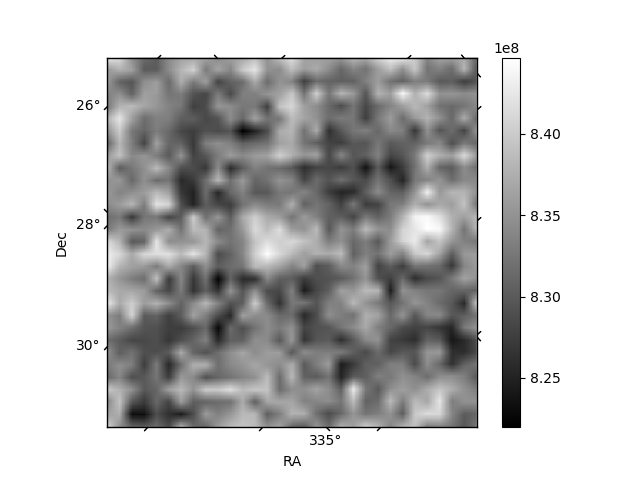
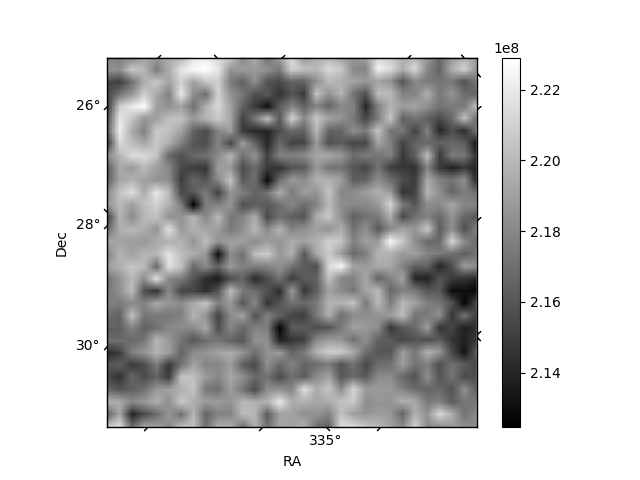
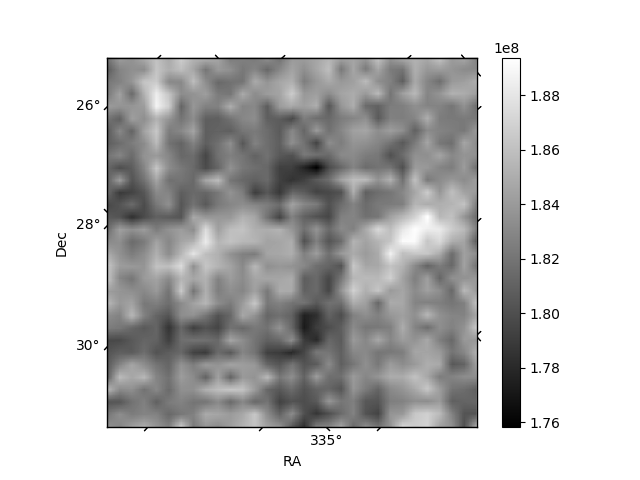
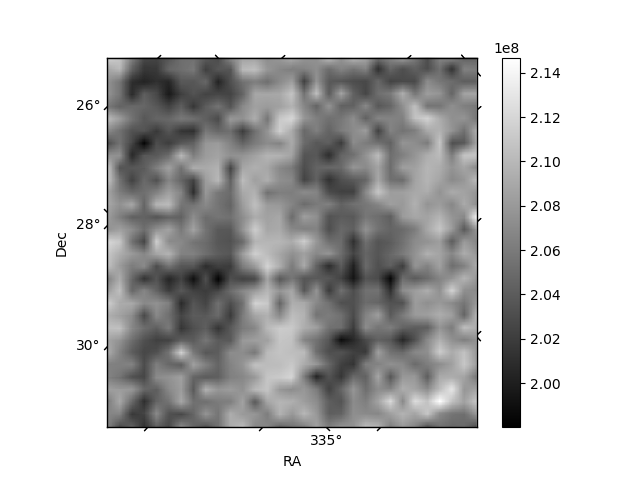
Histogram calculated using DETX and DETY for each event in the final _common_clean file
| Quadrant A | 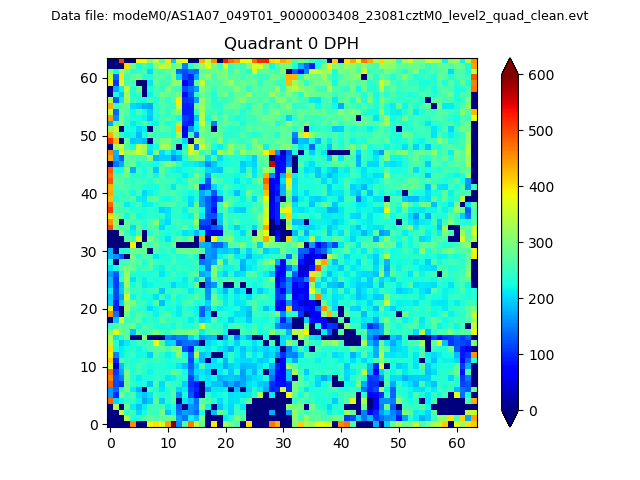 |
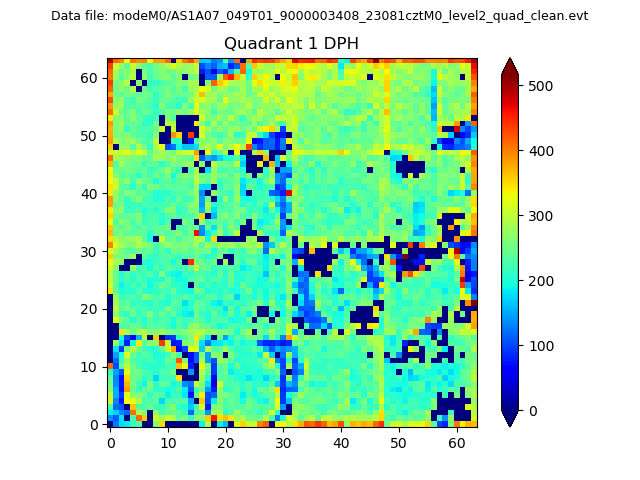 |
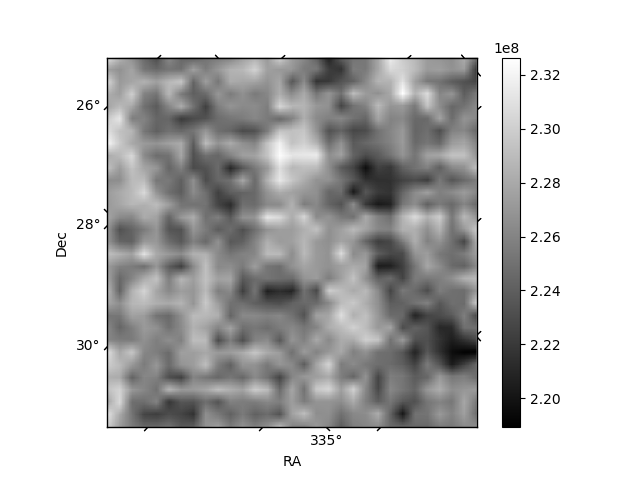
Quadrant B |
|---|---|---|---|
| Quadrant D | 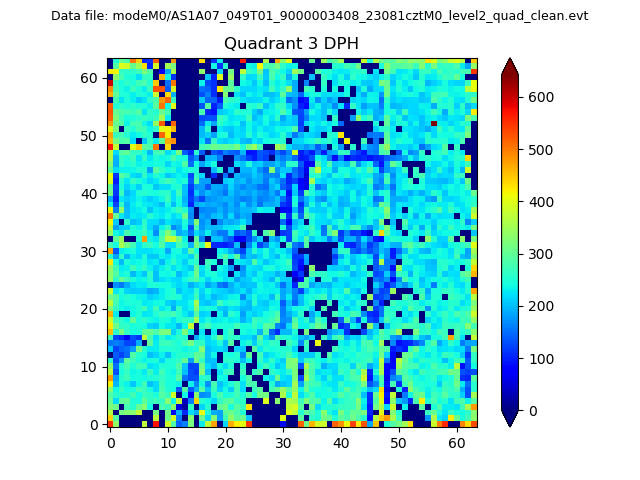 |
 |
Quadrant C |
| Plot type | Count rate plots | Images |
|---|---|---|
| Comparison with Poisson distribution Blue bars denote a histogram of data divided into 1 sec bins. Red curve is a Poisson curve with rate = median count rate of data. |
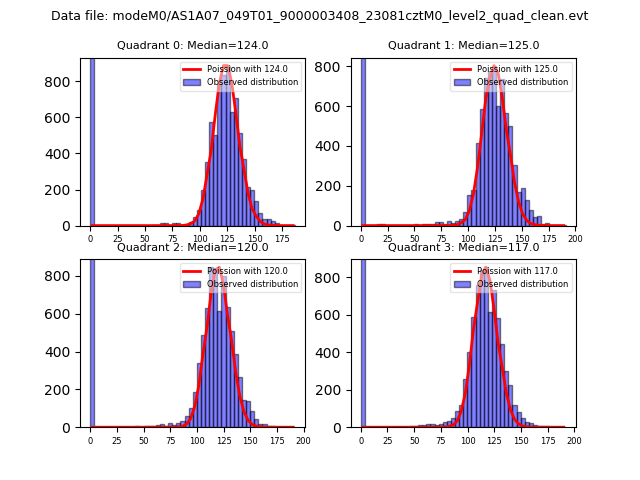 |
 |
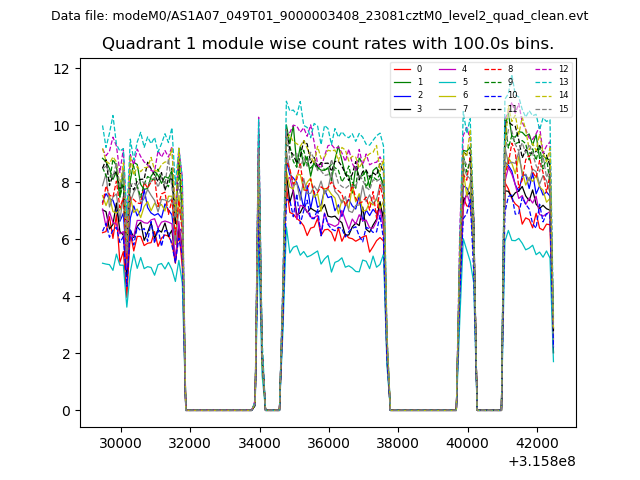
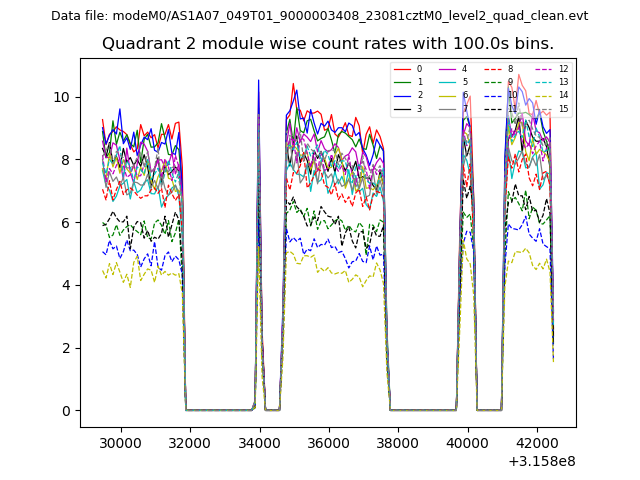
| Quadrant-wise count rates Data is divided into 100 sec bins |
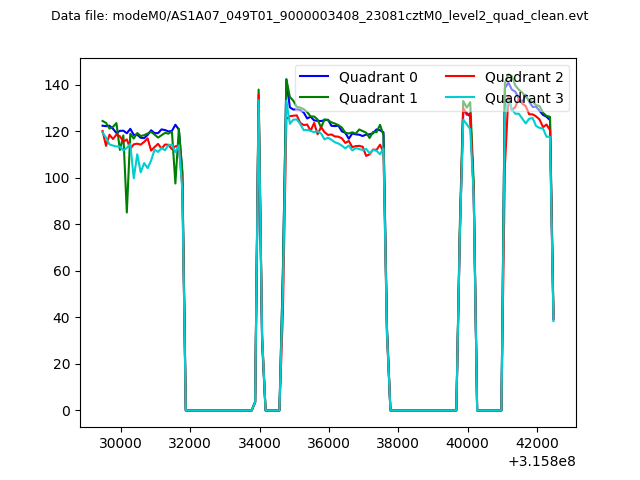 |
|
| Module-wise count rates for Quadrant A Data is divided into 100 sec bins |
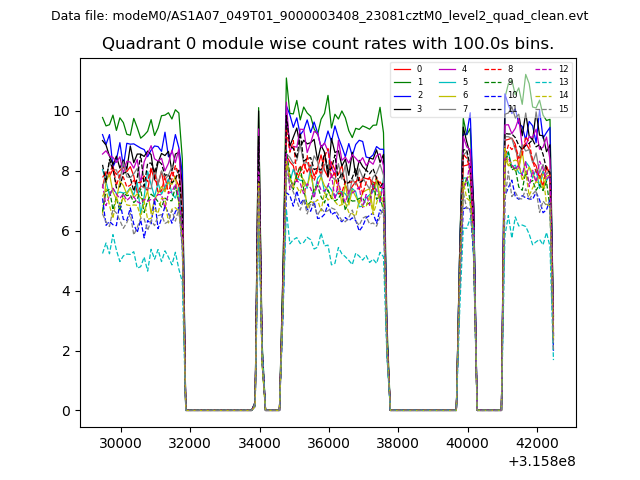 |
 |
| Module-wise count rates for Quadrant B Data is divided into 100 sec bins |
 |
 |
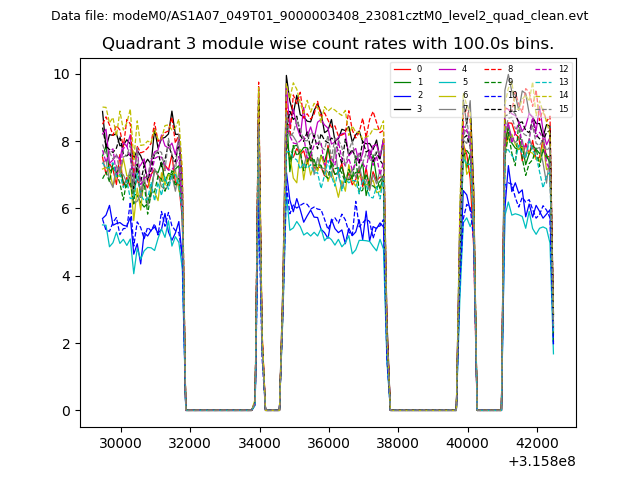
| Module-wise count rates for Quadrant C Data is divided into 100 sec bins |
 |
 |
| Module-wise count rates for Quadrant D Data is divided into 100 sec bins |
 |
 |
| Parameter | Plot |
|---|---|
| CZT HV Monitor | 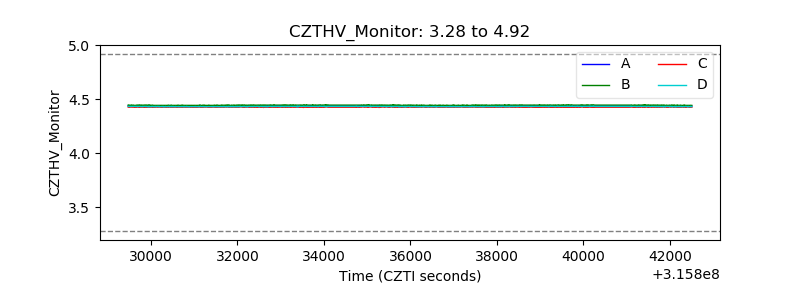 |
| D_VDD | 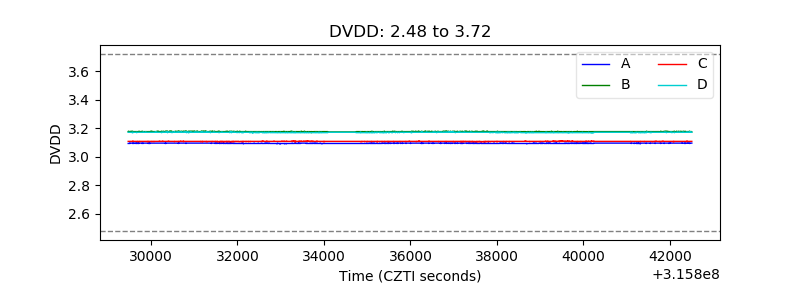 |
| Temperature 1 | 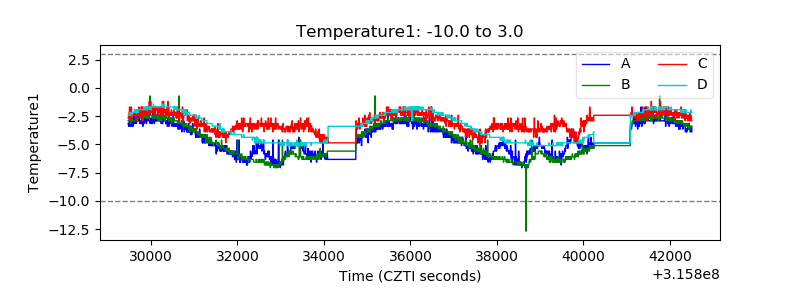 |
| Veto HV Monitor | 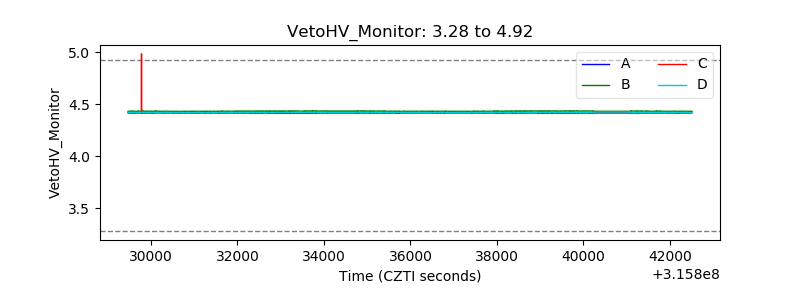 |
| Veto LLD | 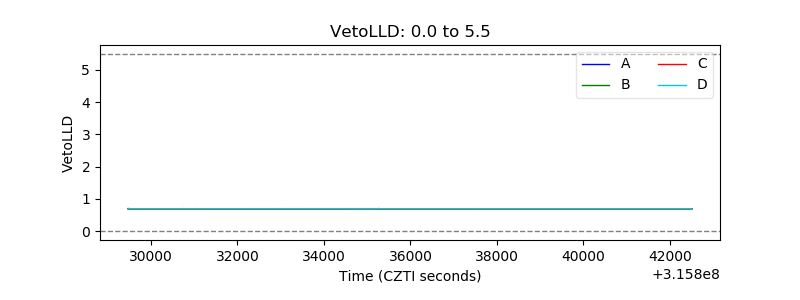 |
| Alpha Counter | 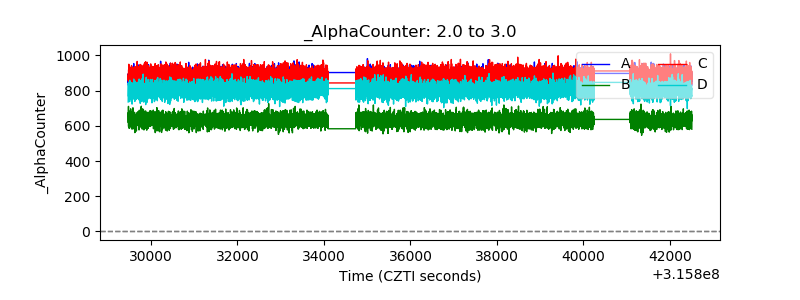 |
| _CPM_Rate | 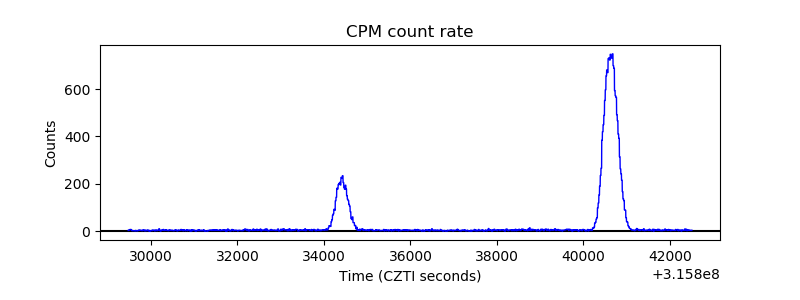 |
| CZT Counter | 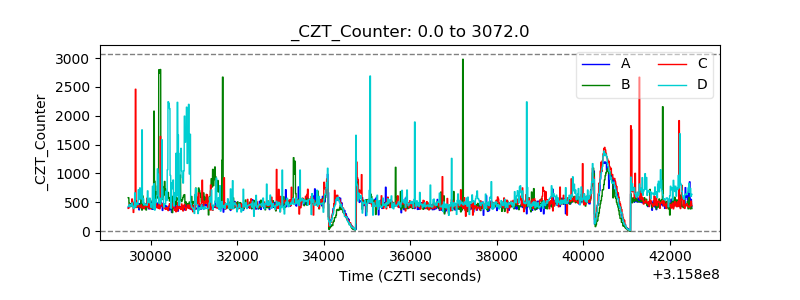 |
| +2.5 Volts monitor | 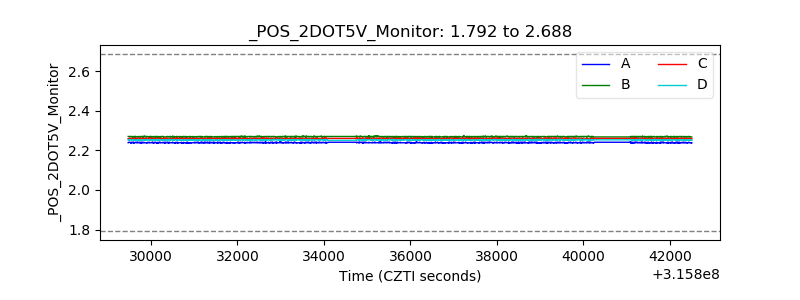 |
| +5 Volts monitor |  |
| _ROLL_ROT | 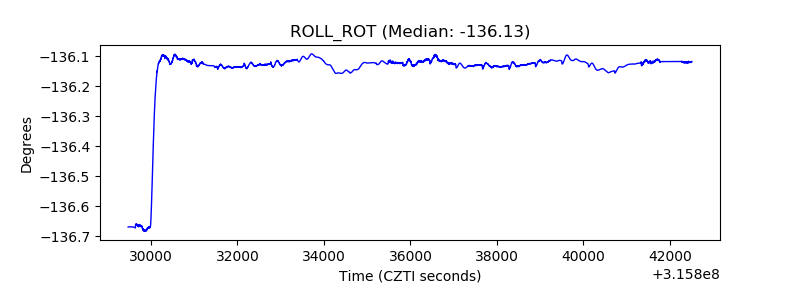 |
| _Roll_DEC | 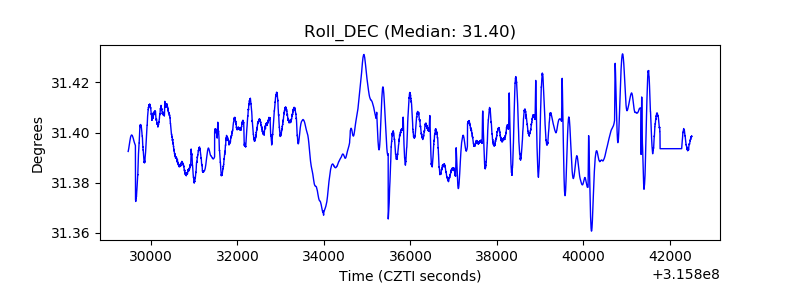 |
| _Roll_RA | 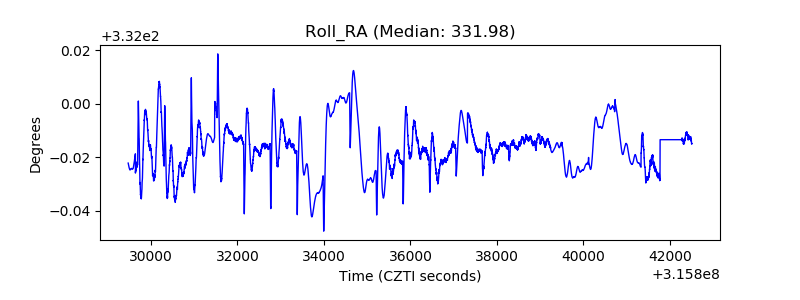 |
| Veto Counter | 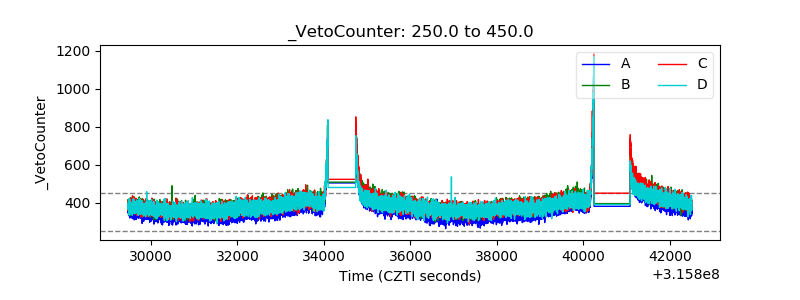 |