| Param | Original file | Final file |
|---|---|---|
| Filename | modeM0/AS1A07_049T01_9000003408_23082cztM0_level2.evt | modeM0/AS1A07_049T01_9000003408_23082cztM0_level2_quad_clean.evt |
| Size (bytes) | 433,771,200 | 84,487,680 |
| Size | 413.7 MB | 80.6 MB |
| Events in quadrant A | 2,992,540 | 538,554 |
| Events in quadrant B | 2,985,753 | 548,511 |
| Events in quadrant C | 3,161,759 | 523,300 |
| Events in quadrant D | 3,574,815 | 514,780 |
| Mode M0 | |||
|---|---|---|---|
| Quadrant | BADHDUFLAG | Total packets | Discarded packets |
| A | 0 | 12969 | 1 |
| B | 0 | 12869 | 1 |
| C | 0 | 13227 | 1 |
| D | 0 | 14697 | 1 |
| Mode M9 | |||
|---|---|---|---|
| Quadrant | BADHDUFLAG | Total packets | Discarded packets |
| A | 0 | 11 | 0 |
| B | 0 | 11 | 0 |
| C | 0 | 11 | 0 |
| D | 0 | 11 | 0 |
| Mode SS | |||
|---|---|---|---|
| Quadrant | BADHDUFLAG | Total packets | Discarded packets |
| A | 0 | 124 | 0 |
| B | 0 | 124 | 0 |
| C | 0 | 124 | 0 |
| D | 0 | 124 | 0 |
| Quadrant | Total seconds | Saturated seconds | Saturation percentage |
|---|---|---|---|
| A | 6215 | 49 | 0.788415% |
| B | 6215 | 62 | 0.997586% |
| C | 6215 | 108 | 1.737731% |
| D | 6215 | 61 | 0.981496% |
Noise dominated data is calculated using 1-second bins in cleaned event files. If a bin has >2000 counts, and if more than 50% of those come from <1% of pixels, then it is considered to be noise-dominated and hence unusable.
| Quadrant | # 1 sec bins | Bins with >0 counts | Bins with >2000 counts | High rate bins dominated by noise | Noise dominated (total time) | Noise dominated (detector-on time) | Marked lightcurve |
|---|---|---|---|---|---|---|---|
| A | 7225 | 6216 | 0 | 0 | 0.00% | 0.00% | 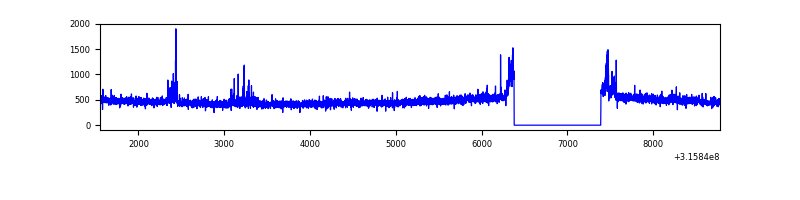 |
| B | 7225 | 6216 | 9 | 9 | 0.12% | 0.14% | 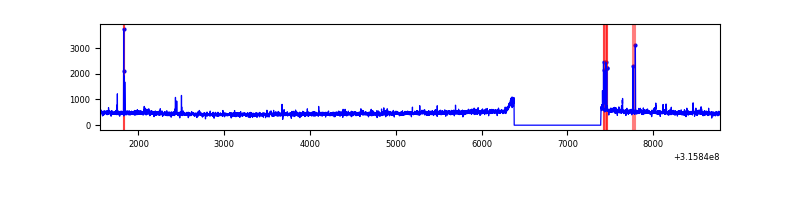 |
| C | 7225 | 6216 | 20 | 20 | 0.28% | 0.32% | 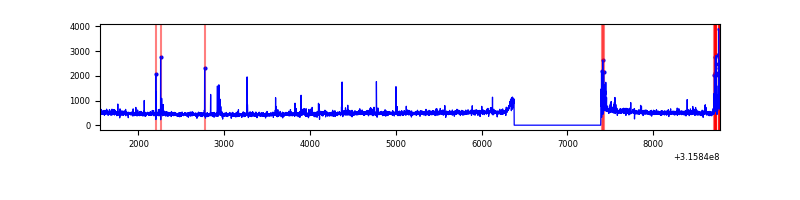 |
| D | 7225 | 6215 | 18 | 18 | 0.25% | 0.29% | 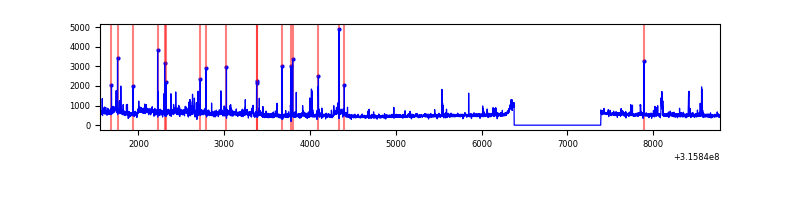 |
Top three noisy pixels from each quadrant. If the there are fewer than three noisy pixels in the level2.evt file, extra rows are filled as -1
| Pixel properties | Quadrant properties | ||||||
|---|---|---|---|---|---|---|---|
| Quadrant | DetID | PixID | Counts | Sigma | Mean | Median | Sigma |
| A | 6 | 16 | 118901 | 783.86 | 745 | 728 | 150.8 |
| A | 13 | 254 | 9057 | 55.25 | 745 | 728 | 150.8 |
| A | 3 | 137 | 6496 | 38.26 | 745 | 728 | 150.8 |
| B | 3 | 64 | 26056 | 177.81 | 741 | 722 | 142.5 |
| B | 4 | 216 | 24389 | 166.11 | 741 | 722 | 142.5 |
| B | 0 | 190 | 22853 | 155.33 | 741 | 722 | 142.5 |
| C | 0 | 10 | 154491 | 912.08 | 719 | 722 | 168.6 |
| C | 14 | 238 | 114334 | 673.89 | 719 | 722 | 168.6 |
| C | 10 | 187 | 32806 | 190.31 | 719 | 722 | 168.6 |
| D | 1 | 52 | 505875 | 2809.73 | 732 | 708 | 179.8 |
| D | 7 | 238 | 162049 | 897.37 | 732 | 708 | 179.8 |
| D | 12 | 227 | 77965 | 429.7 | 732 | 708 | 179.8 |
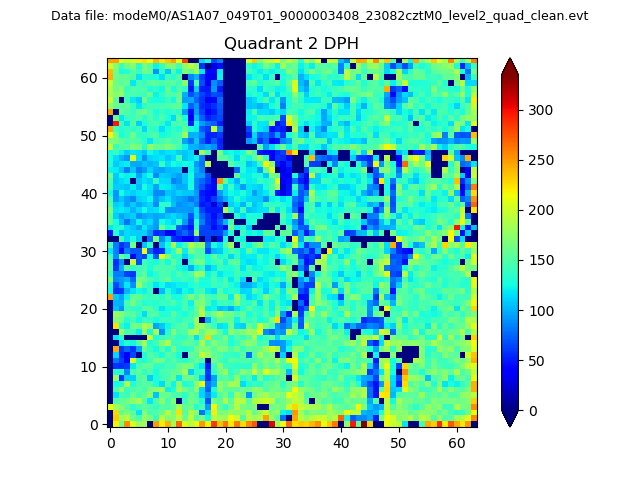
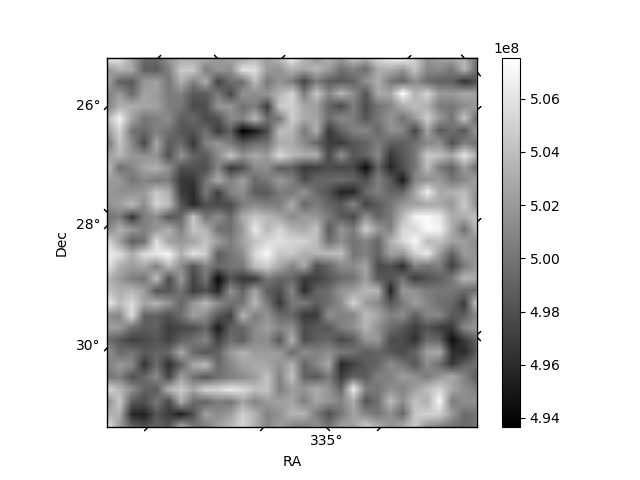
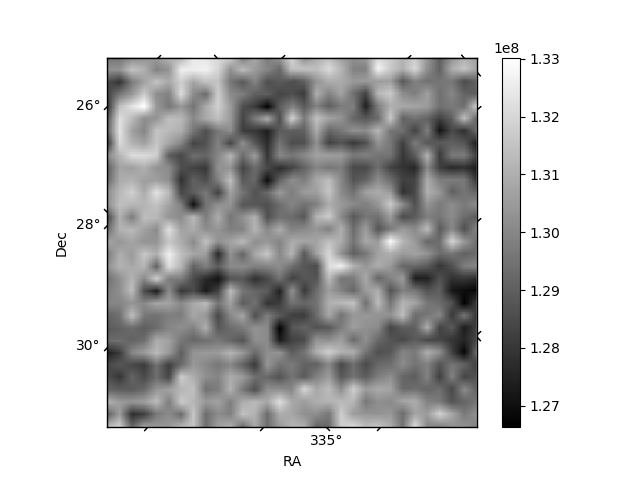
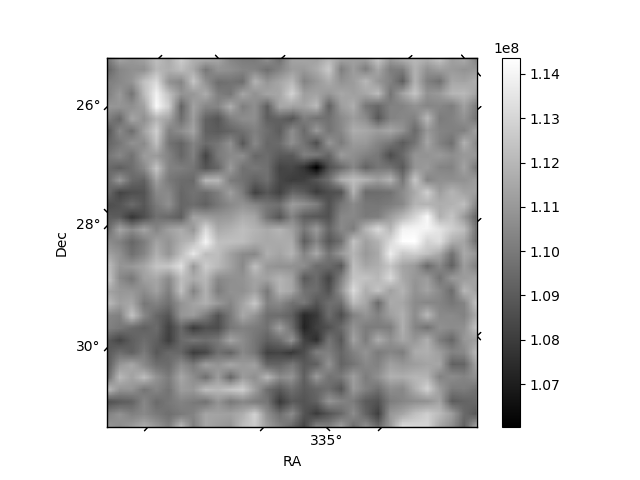
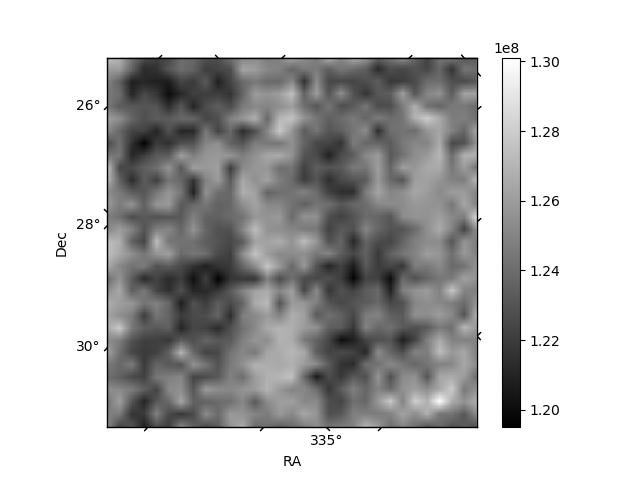
Histogram calculated using DETX and DETY for each event in the final _common_clean file
| Quadrant A | 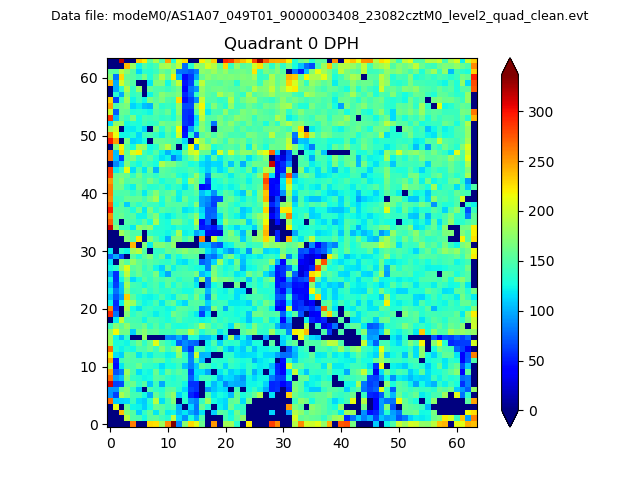 |
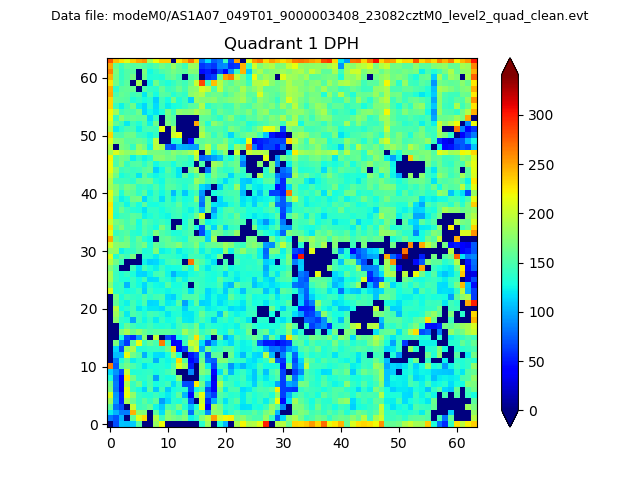 |
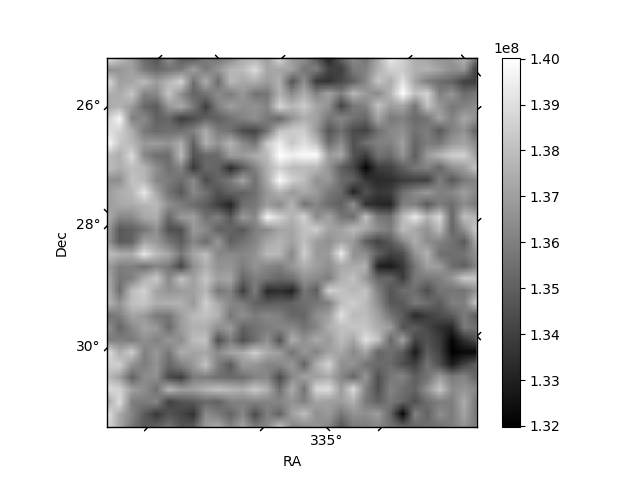
Quadrant B |
|---|---|---|---|
| Quadrant D | 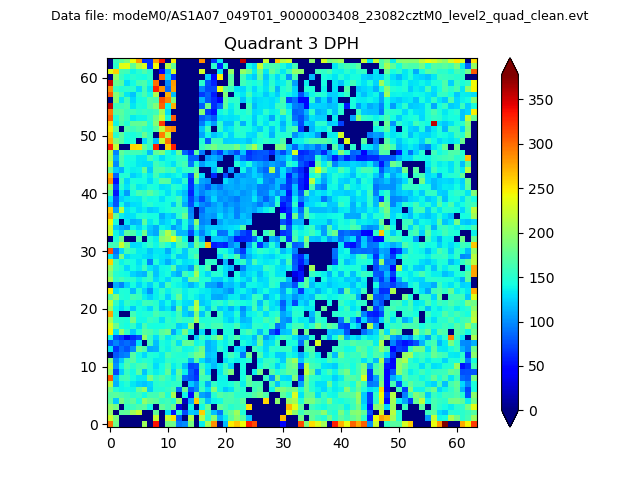 |
 |
Quadrant C |
| Plot type | Count rate plots | Images |
|---|---|---|
| Comparison with Poisson distribution Blue bars denote a histogram of data divided into 1 sec bins. Red curve is a Poisson curve with rate = median count rate of data. |
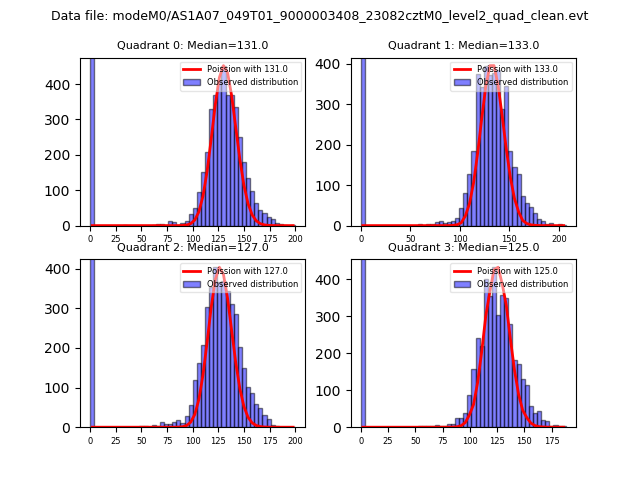 |
 |
| Quadrant-wise count rates Data is divided into 100 sec bins |
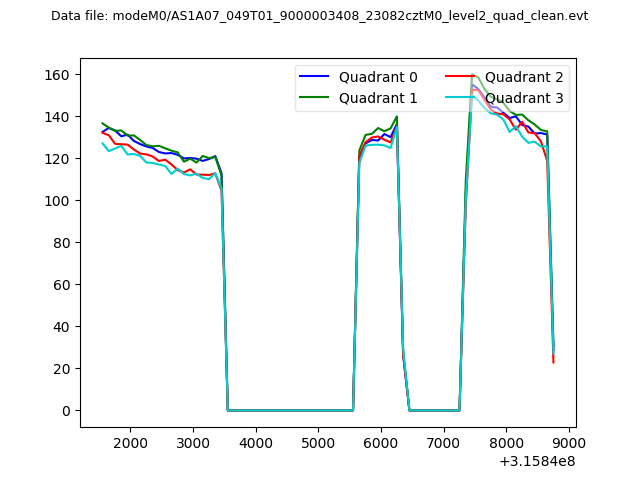 |
|
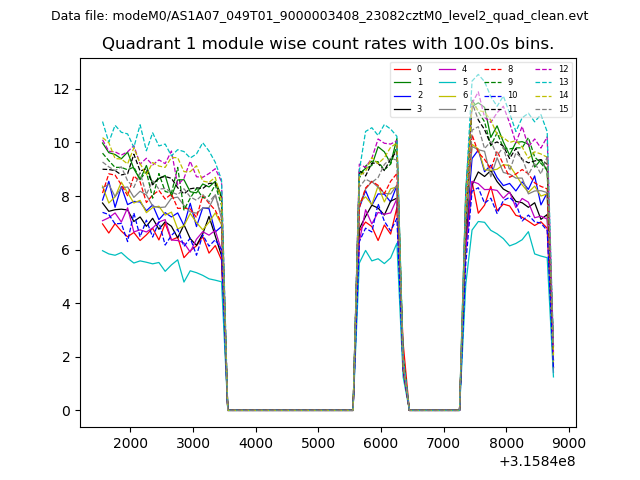
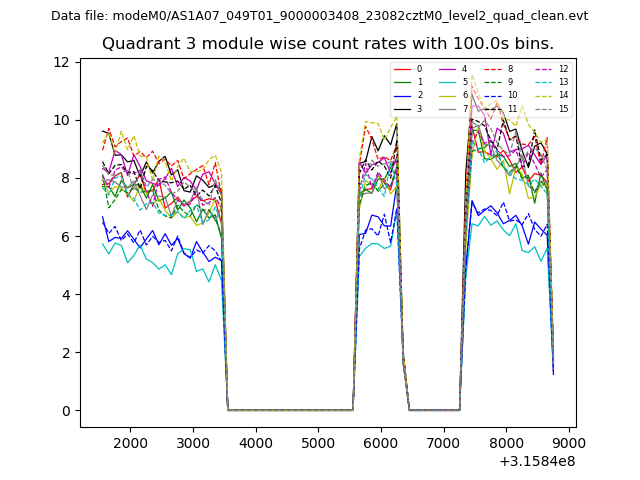
| Module-wise count rates for Quadrant A Data is divided into 100 sec bins |
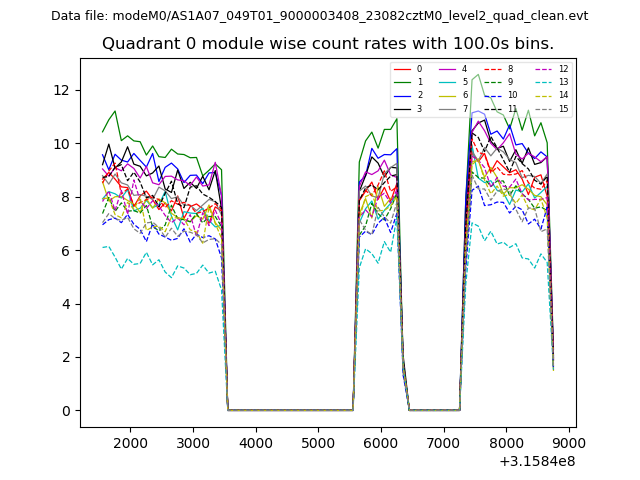 |
 |
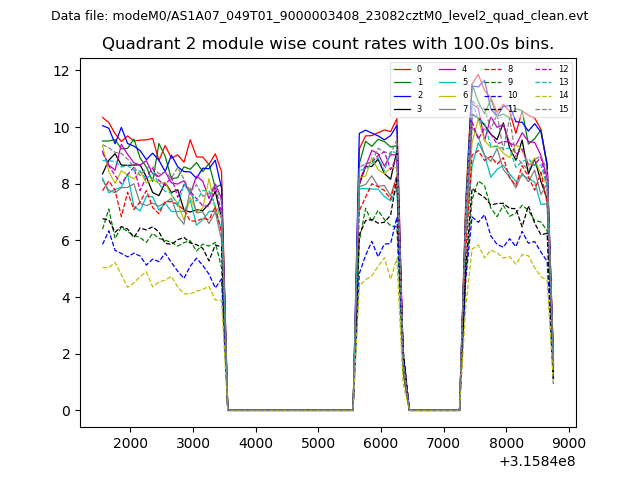
| Module-wise count rates for Quadrant B Data is divided into 100 sec bins |
 |
 |
| Module-wise count rates for Quadrant C Data is divided into 100 sec bins |
 |
 |
| Module-wise count rates for Quadrant D Data is divided into 100 sec bins |
 |
 |
| Parameter | Plot |
|---|---|
| CZT HV Monitor | 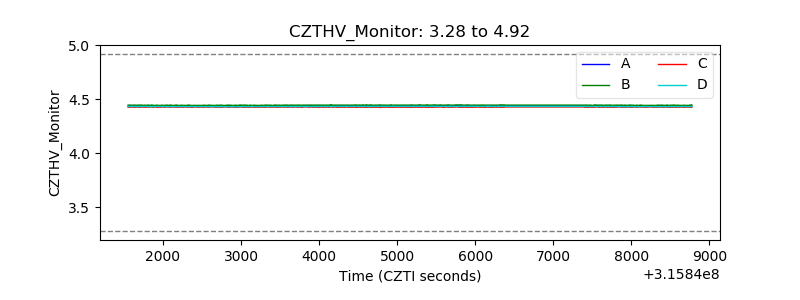 |
| D_VDD | 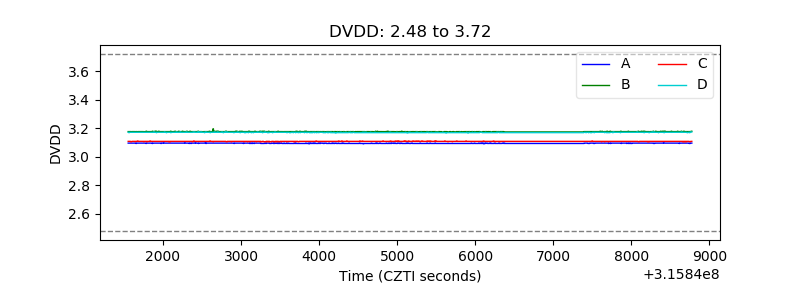 |
| Temperature 1 | 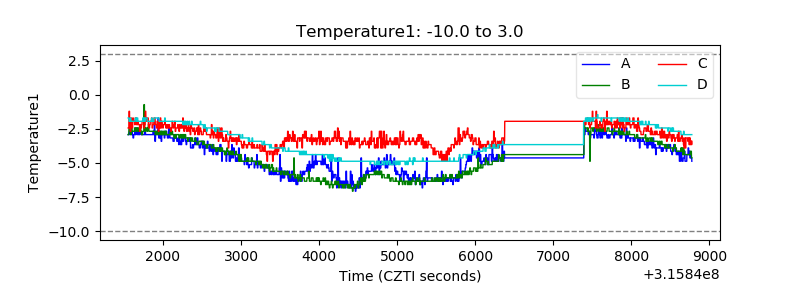 |
| Veto HV Monitor |  |
| Veto LLD | 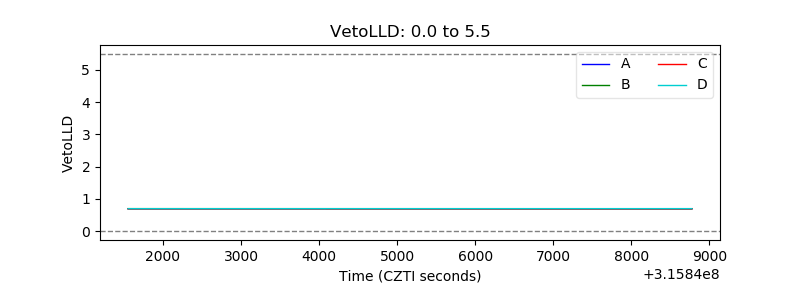 |
| Alpha Counter | 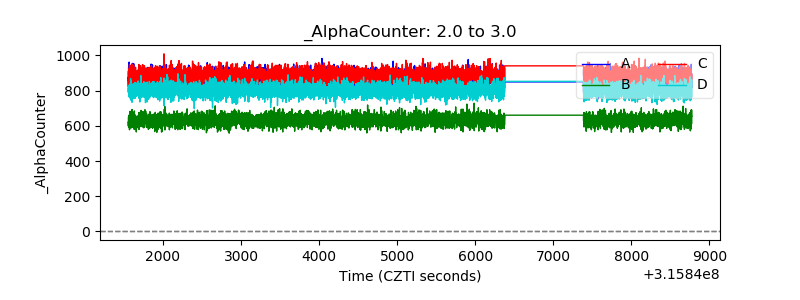 |
| _CPM_Rate | 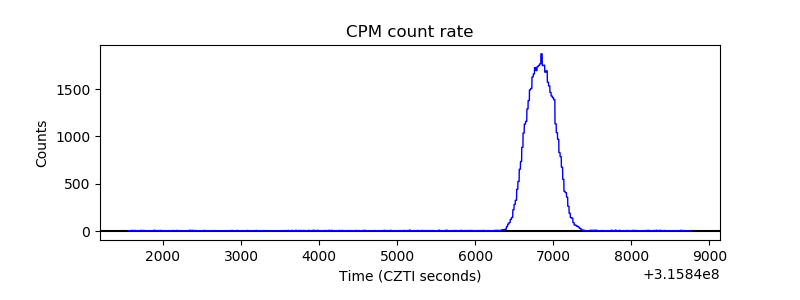 |
| CZT Counter | 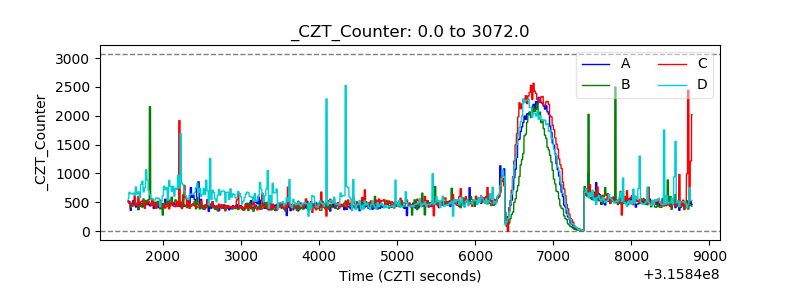 |
| +2.5 Volts monitor |  |
| +5 Volts monitor |  |
| _ROLL_ROT | 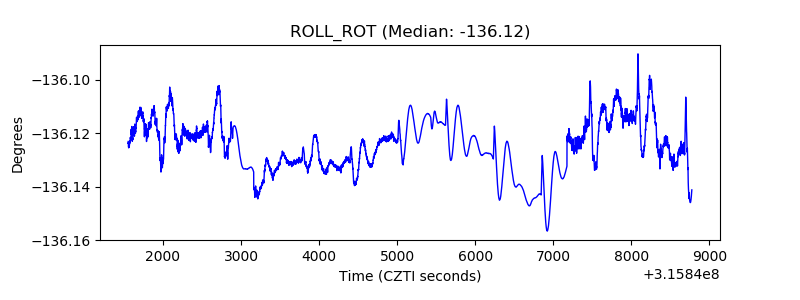 |
| _Roll_DEC | 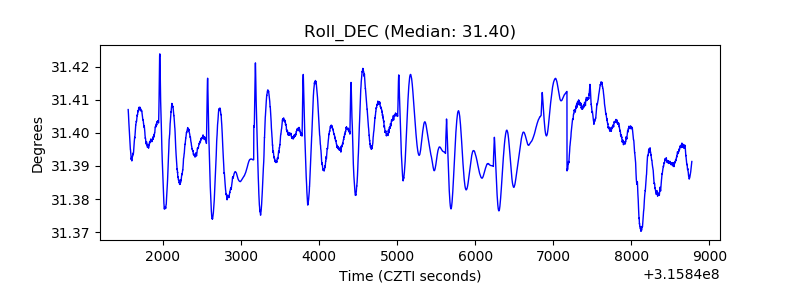 |
| _Roll_RA | 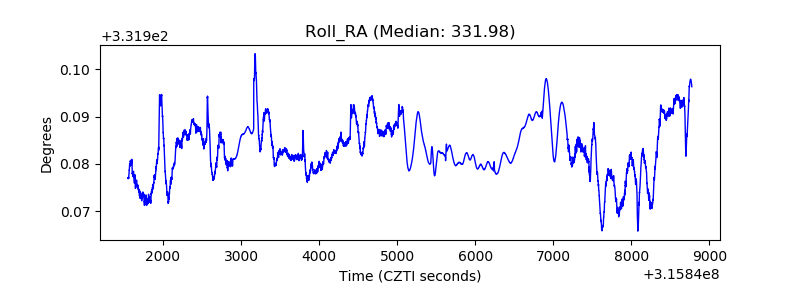 |
| Veto Counter | 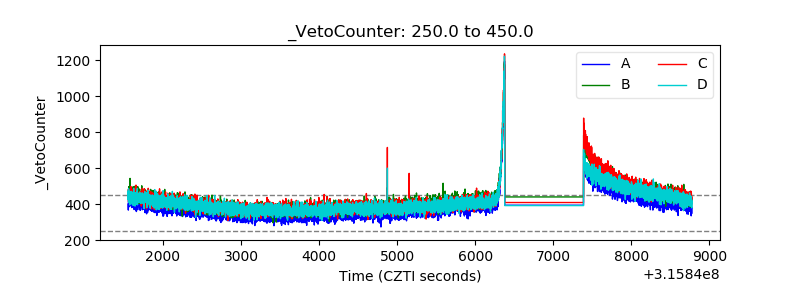 |