| Param | Original file | Final file |
|---|---|---|
| Filename | modeM0/AS1A07_049T01_9000003408_23084cztM0_level2.evt | modeM0/AS1A07_049T01_9000003408_23084cztM0_level2_quad_clean.evt |
| Size (bytes) | 447,022,080 | 88,692,480 |
| Size | 426.3 MB | 84.6 MB |
| Events in quadrant A | 3,109,203 | 567,785 |
| Events in quadrant B | 3,067,504 | 585,796 |
| Events in quadrant C | 3,429,801 | 554,465 |
| Events in quadrant D | 3,513,054 | 547,667 |
| Mode M0 | |||
|---|---|---|---|
| Quadrant | BADHDUFLAG | Total packets | Discarded packets |
| A | 0 | 13239 | 1 |
| B | 0 | 12980 | 1 |
| C | 0 | 13963 | 1 |
| D | 0 | 14354 | 3 |
| Mode M9 | |||
|---|---|---|---|
| Quadrant | BADHDUFLAG | Total packets | Discarded packets |
| A | 0 | 11 | 0 |
| B | 0 | 11 | 0 |
| C | 0 | 11 | 0 |
| D | 0 | 11 | 0 |
| Mode SS | |||
|---|---|---|---|
| Quadrant | BADHDUFLAG | Total packets | Discarded packets |
| A | 0 | 126 | 0 |
| B | 0 | 126 | 0 |
| C | 0 | 126 | 0 |
| D | 0 | 126 | 0 |
| Quadrant | Total seconds | Saturated seconds | Saturation percentage |
|---|---|---|---|
| A | 6157 | 31 | 0.503492% |
| B | 6158 | 43 | 0.698279% |
| C | 6158 | 159 | 2.582007% |
| D | 6157 | 74 | 1.201884% |
Noise dominated data is calculated using 1-second bins in cleaned event files. If a bin has >2000 counts, and if more than 50% of those come from <1% of pixels, then it is considered to be noise-dominated and hence unusable.
| Quadrant | # 1 sec bins | Bins with >0 counts | Bins with >2000 counts | High rate bins dominated by noise | Noise dominated (total time) | Noise dominated (detector-on time) | Marked lightcurve |
|---|---|---|---|---|---|---|---|
| A | 7292 | 6158 | 0 | 0 | 0.00% | 0.00% | 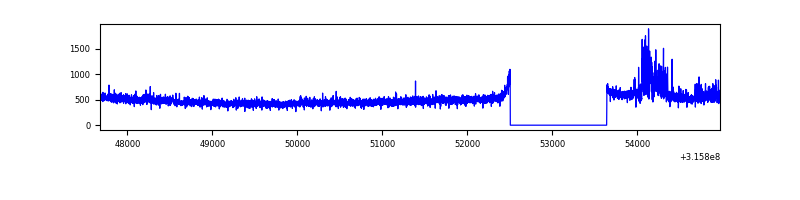 |
| B | 7293 | 6159 | 8 | 8 | 0.11% | 0.13% | 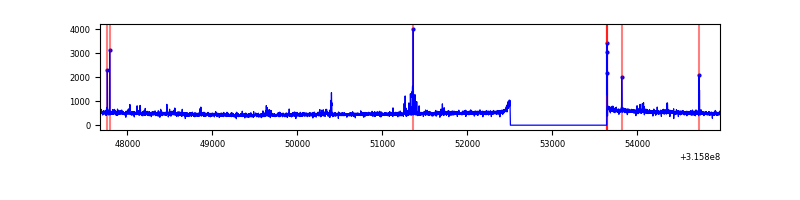 |
| C | 7293 | 6159 | 58 | 58 | 0.80% | 0.94% | 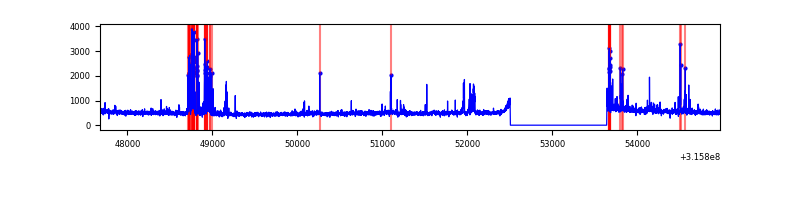 |
| D | 7292 | 6158 | 37 | 37 | 0.51% | 0.60% | 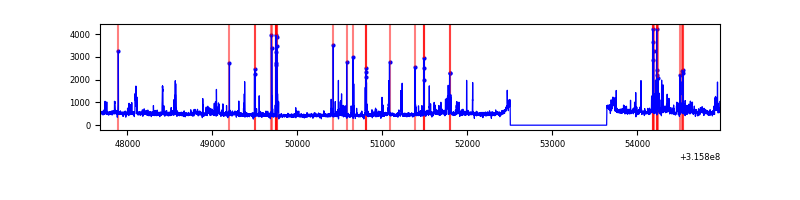 |
Top three noisy pixels from each quadrant. If the there are fewer than three noisy pixels in the level2.evt file, extra rows are filled as -1
| Pixel properties | Quadrant properties | ||||||
|---|---|---|---|---|---|---|---|
| Quadrant | DetID | PixID | Counts | Sigma | Mean | Median | Sigma |
| A | 6 | 16 | 183756 | 1192.66 | 759 | 741 | 153.5 |
| A | 13 | 254 | 8738 | 52.11 | 759 | 741 | 153.5 |
| A | 0 | 226 | 6578 | 38.04 | 759 | 741 | 153.5 |
| B | 4 | 173 | 33352 | 228.25 | 759 | 740 | 142.9 |
| B | 4 | 216 | 24125 | 163.67 | 759 | 740 | 142.9 |
| B | 12 | 111 | 17369 | 116.39 | 759 | 740 | 142.9 |
| C | 0 | 10 | 348963 | 2028.94 | 735 | 739 | 171.6 |
| C | 14 | 238 | 115984 | 671.48 | 735 | 739 | 171.6 |
| C | 2 | 16 | 59478 | 342.24 | 735 | 739 | 171.6 |
| D | 1 | 52 | 508899 | 2790.39 | 747 | 726 | 182.1 |
| D | 7 | 238 | 87308 | 475.42 | 747 | 726 | 182.1 |
| D | 9 | 85 | 52919 | 286.59 | 747 | 726 | 182.1 |
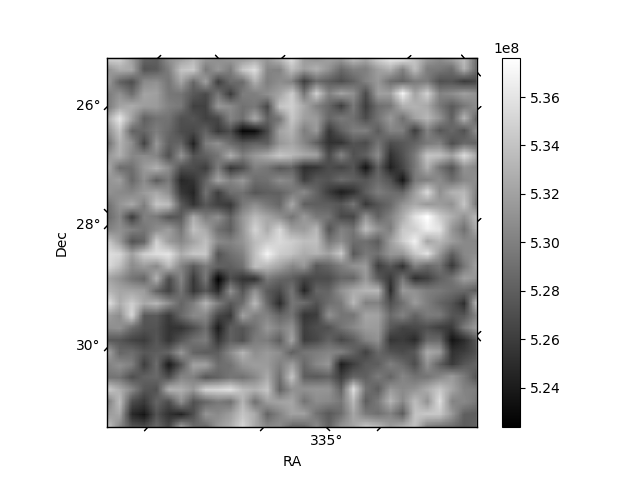
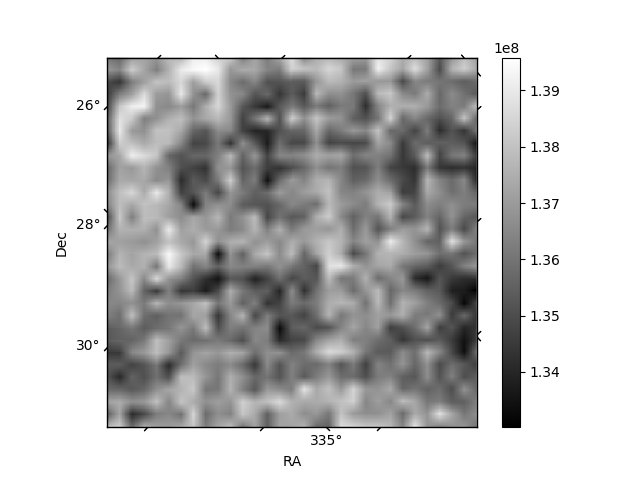
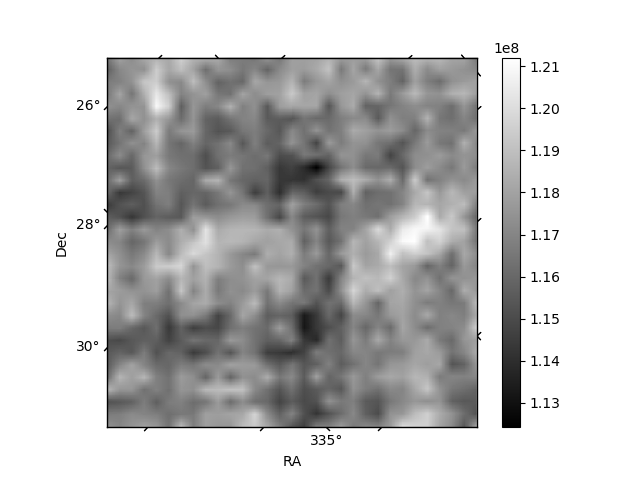
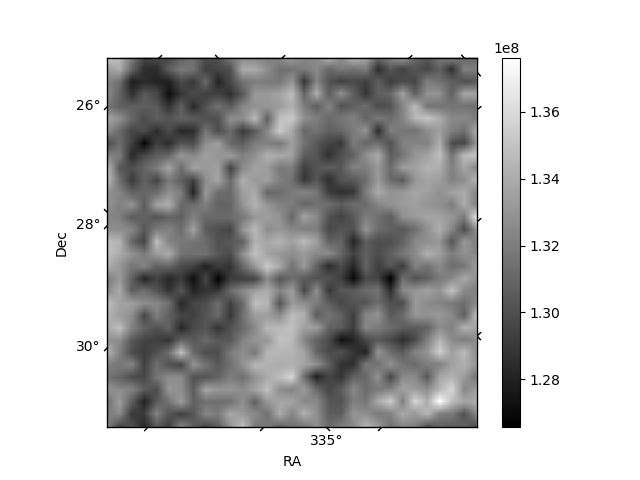
Histogram calculated using DETX and DETY for each event in the final _common_clean file
| Quadrant A | 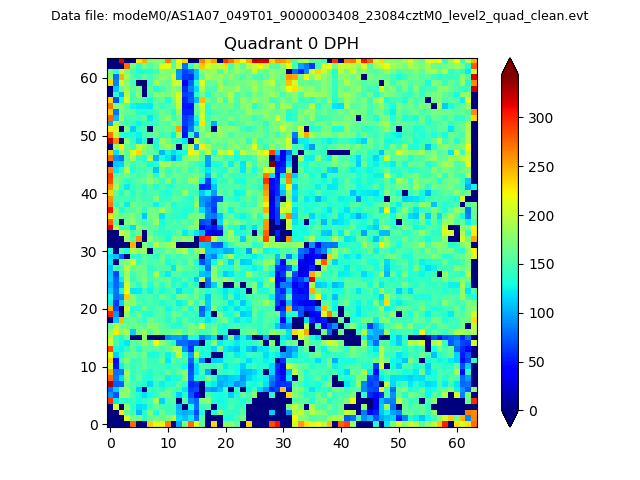 |
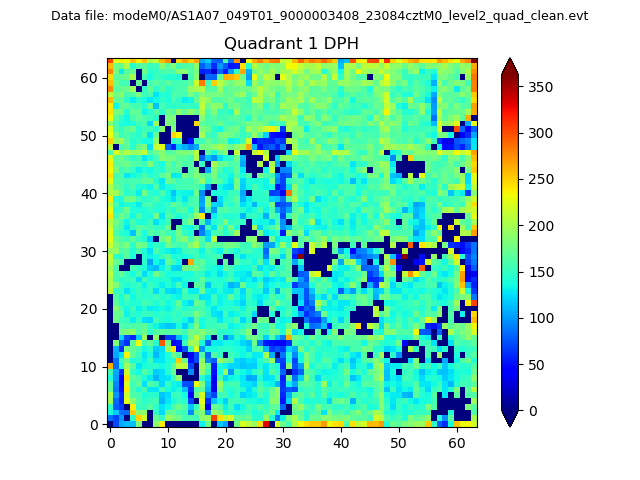 |
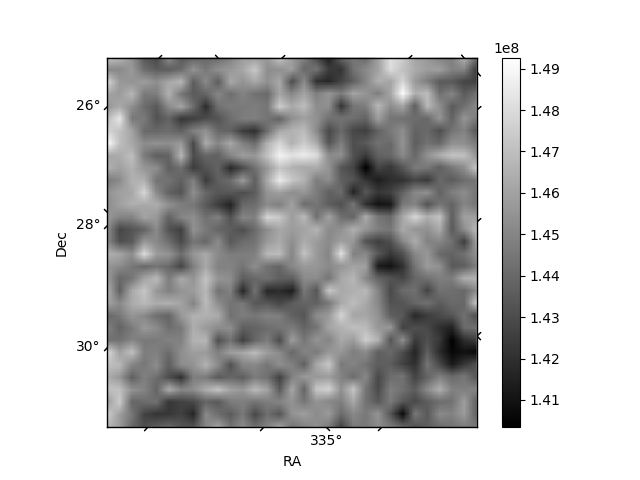
Quadrant B |
|---|---|---|---|
| Quadrant D | 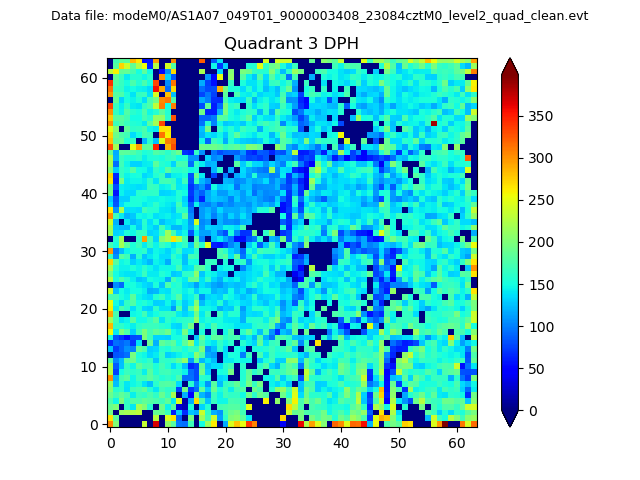 |
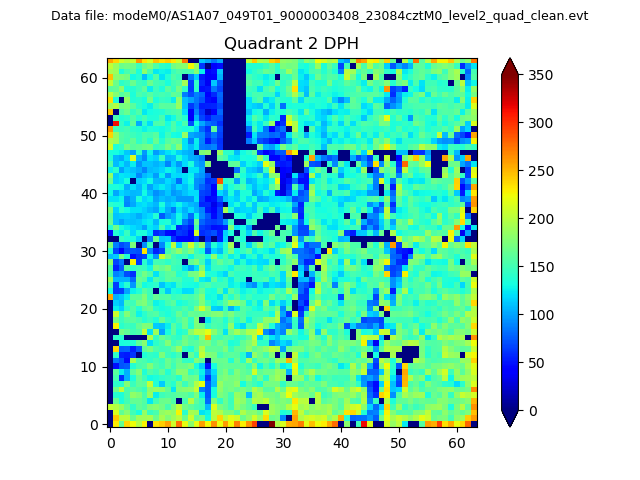 |
Quadrant C |
| Plot type | Count rate plots | Images |
|---|---|---|
| Comparison with Poisson distribution Blue bars denote a histogram of data divided into 1 sec bins. Red curve is a Poisson curve with rate = median count rate of data. |
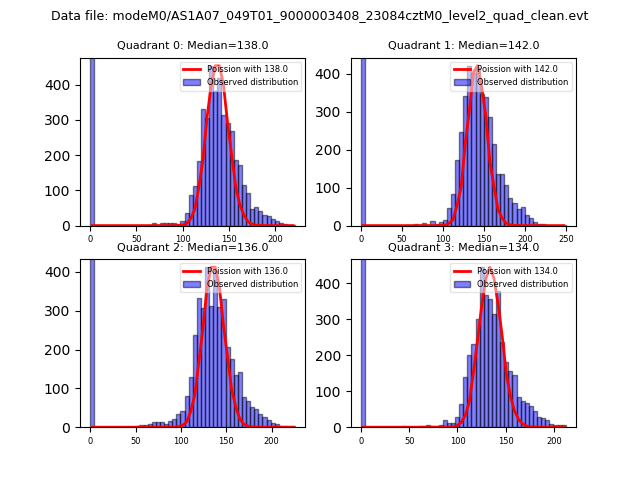 |
 |
| Quadrant-wise count rates Data is divided into 100 sec bins |
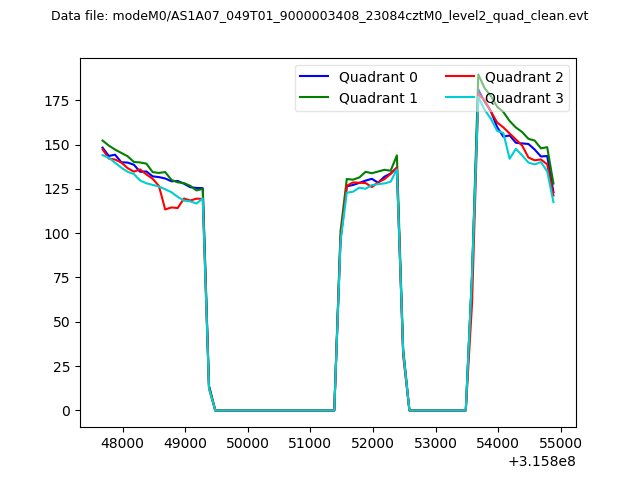 |
|
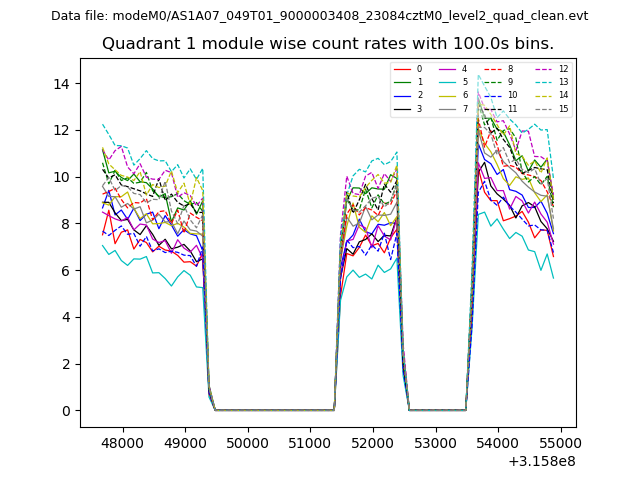
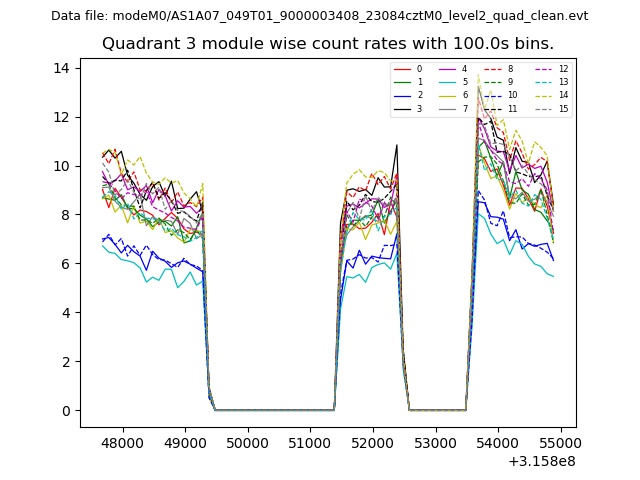
| Module-wise count rates for Quadrant A Data is divided into 100 sec bins |
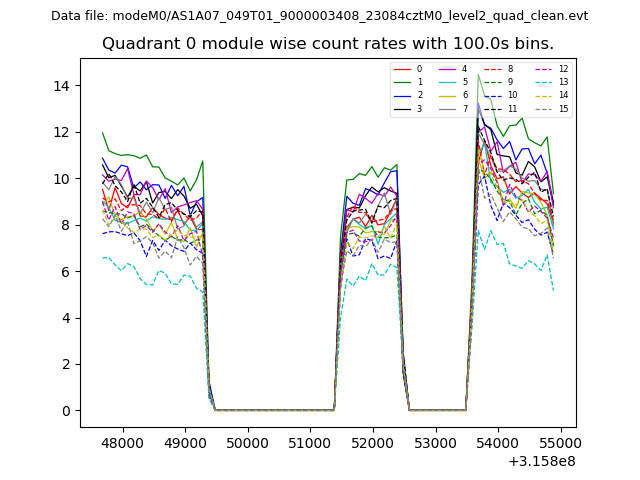 |
 |
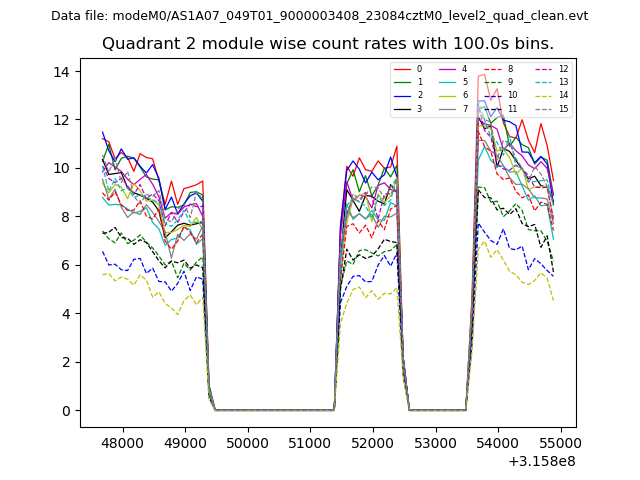
| Module-wise count rates for Quadrant B Data is divided into 100 sec bins |
 |
 |
| Module-wise count rates for Quadrant C Data is divided into 100 sec bins |
 |
 |
| Module-wise count rates for Quadrant D Data is divided into 100 sec bins |
 |
 |
| Parameter | Plot |
|---|---|
| CZT HV Monitor | 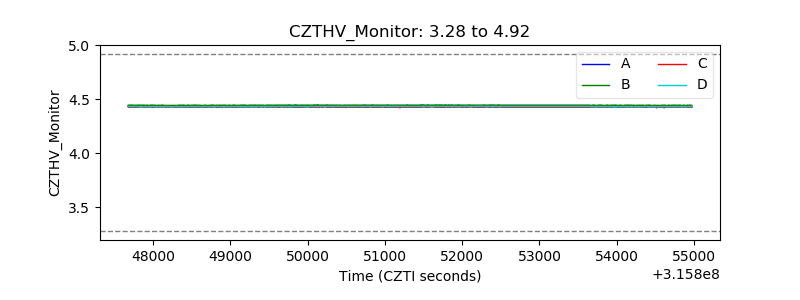 |
| D_VDD | 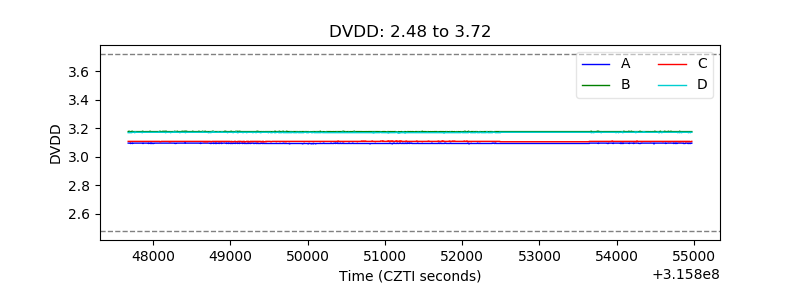 |
| Temperature 1 | 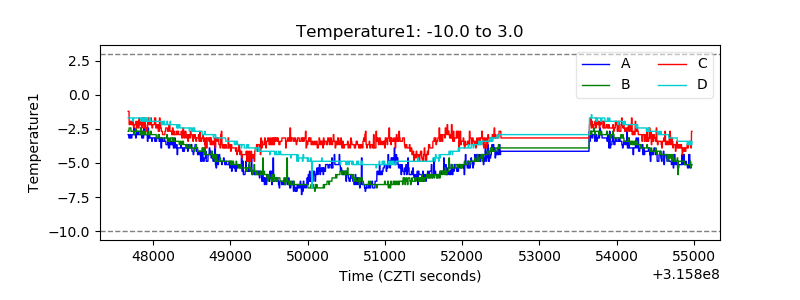 |
| Veto HV Monitor | 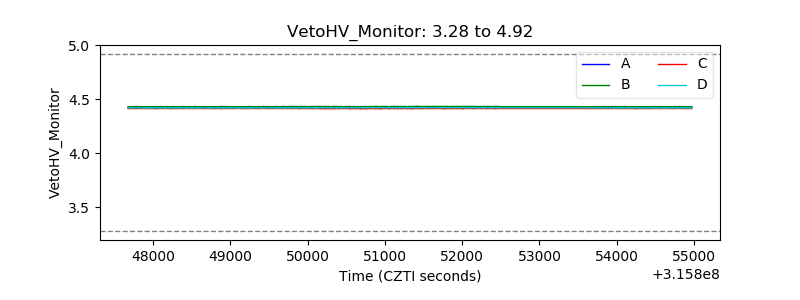 |
| Veto LLD | 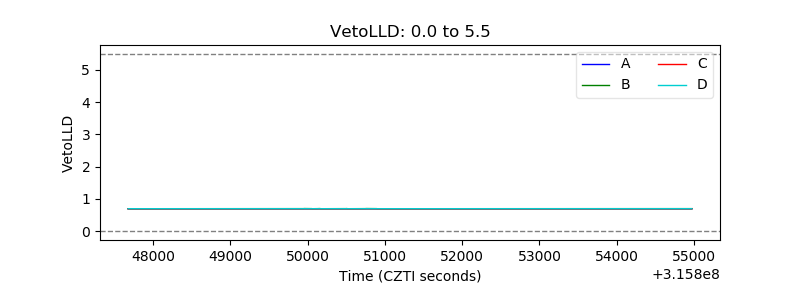 |
| Alpha Counter | 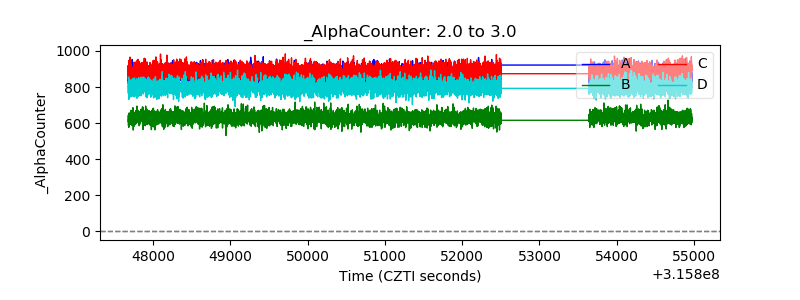 |
| _CPM_Rate | 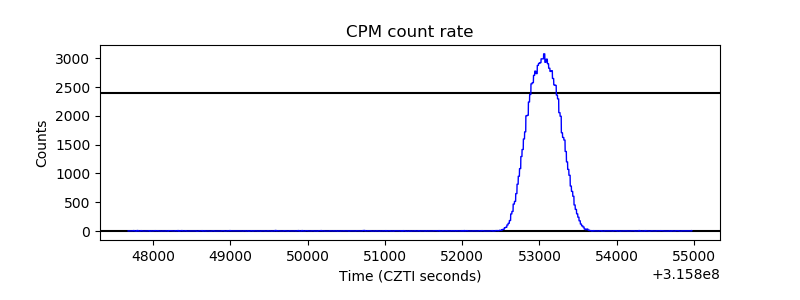 |
| CZT Counter | 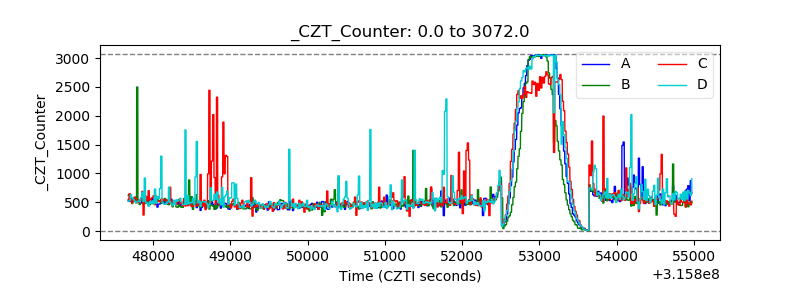 |
| +2.5 Volts monitor |  |
| +5 Volts monitor | 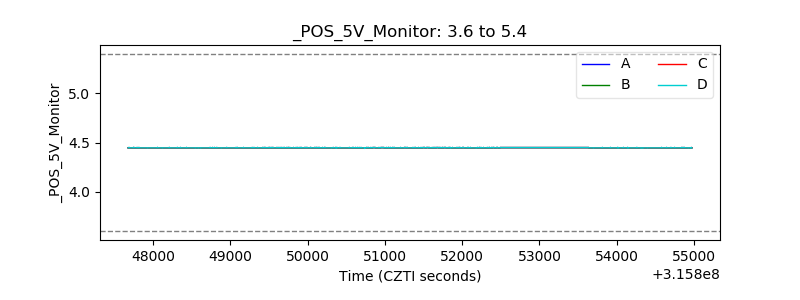 |
| _ROLL_ROT | 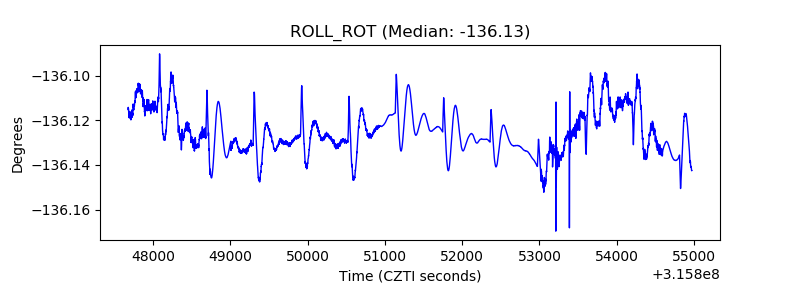 |
| _Roll_DEC | 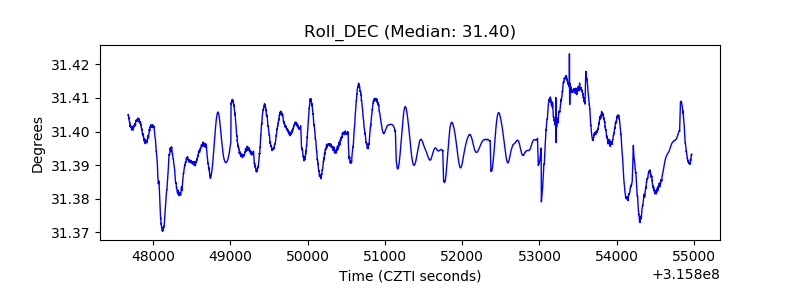 |
| _Roll_RA | 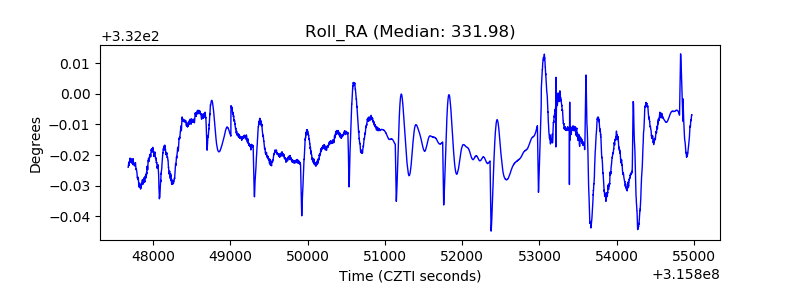 |
| Veto Counter | 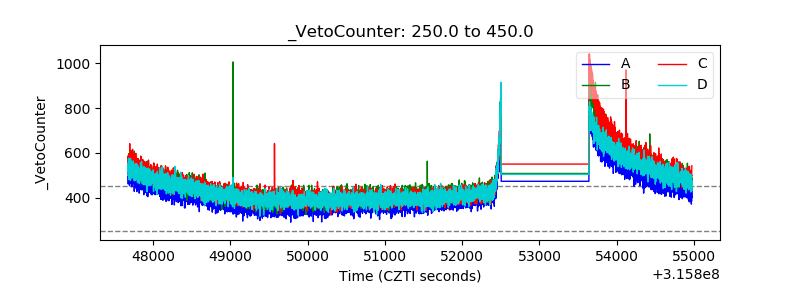 |