| Param | Original file | Final file |
|---|---|---|
| Filename | modeM0/AS1A07_049T01_9000003408_23086cztM0_level2.evt | modeM0/AS1A07_049T01_9000003408_23086cztM0_level2_quad_clean.evt |
| Size (bytes) | 500,270,400 | 87,635,520 |
| Size | 477.1 MB | 83.6 MB |
| Events in quadrant A | 3,348,934 | 553,687 |
| Events in quadrant B | 3,382,491 | 577,950 |
| Events in quadrant C | 4,434,596 | 541,961 |
| Events in quadrant D | 3,553,171 | 536,316 |
| Mode M0 | |||
|---|---|---|---|
| Quadrant | BADHDUFLAG | Total packets | Discarded packets |
| A | 0 | 13875 | 2 |
| B | 0 | 13892 | 2 |
| C | 0 | 17398 | 2 |
| D | 0 | 14591 | 2 |
| Mode M9 | |||
|---|---|---|---|
| Quadrant | BADHDUFLAG | Total packets | Discarded packets |
| A | 0 | 13 | 0 |
| B | 0 | 13 | 0 |
| C | 0 | 13 | 0 |
| D | 0 | 13 | 0 |
| Mode SS | |||
|---|---|---|---|
| Quadrant | BADHDUFLAG | Total packets | Discarded packets |
| A | 0 | 130 | 0 |
| B | 0 | 130 | 0 |
| C | 0 | 130 | 0 |
| D | 0 | 130 | 0 |
| Quadrant | Total seconds | Saturated seconds | Saturation percentage |
|---|---|---|---|
| A | 6359 | 31 | 0.487498% |
| B | 6359 | 45 | 0.707658% |
| C | 6360 | 222 | 3.490566% |
| D | 6360 | 33 | 0.518868% |
Noise dominated data is calculated using 1-second bins in cleaned event files. If a bin has >2000 counts, and if more than 50% of those come from <1% of pixels, then it is considered to be noise-dominated and hence unusable.
| Quadrant | # 1 sec bins | Bins with >0 counts | Bins with >2000 counts | High rate bins dominated by noise | Noise dominated (total time) | Noise dominated (detector-on time) | Marked lightcurve |
|---|---|---|---|---|---|---|---|
| A | 7729 | 6360 | 7 | 7 | 0.09% | 0.11% | 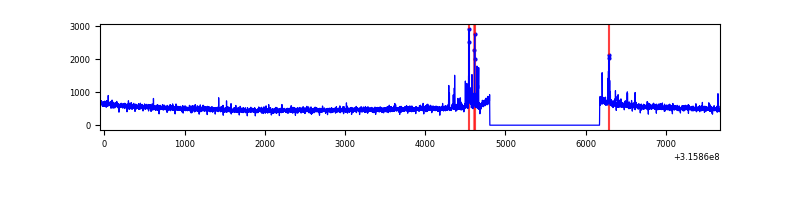 |
| B | 7729 | 6360 | 8 | 8 | 0.10% | 0.13% | 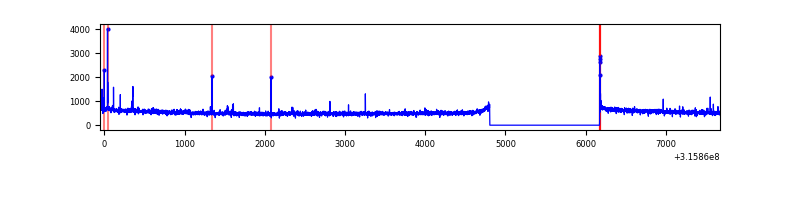 |
| C | 7730 | 6360 | 50 | 50 | 0.65% | 0.79% | 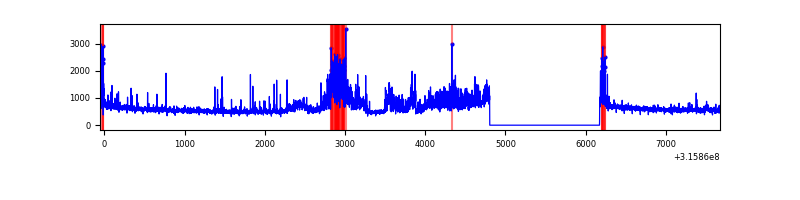 |
| D | 7730 | 6361 | 11 | 11 | 0.14% | 0.17% | 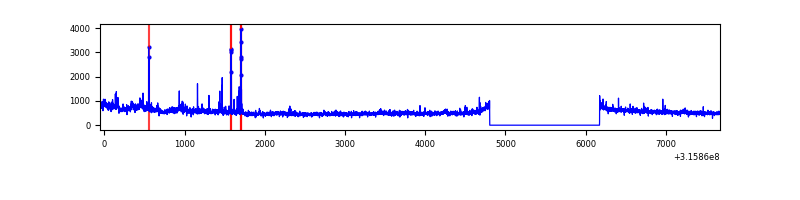 |
Top three noisy pixels from each quadrant. If the there are fewer than three noisy pixels in the level2.evt file, extra rows are filled as -1
| Pixel properties | Quadrant properties | ||||||
|---|---|---|---|---|---|---|---|
| Quadrant | DetID | PixID | Counts | Sigma | Mean | Median | Sigma |
| A | 6 | 16 | 107004 | 638.25 | 841 | 827 | 166.4 |
| A | 13 | 254 | 9966 | 54.94 | 841 | 827 | 166.4 |
| A | 0 | 226 | 7037 | 37.33 | 841 | 827 | 166.4 |
| B | 4 | 216 | 25306 | 155.25 | 848 | 830 | 157.7 |
| B | 12 | 111 | 18535 | 112.3 | 848 | 830 | 157.7 |
| B | 11 | 111 | 16332 | 98.33 | 848 | 830 | 157.7 |
| C | 10 | 187 | 882809 | 4622.75 | 825 | 834 | 190.8 |
| C | 0 | 10 | 179661 | 937.3 | 825 | 834 | 190.8 |
| C | 14 | 238 | 131035 | 682.43 | 825 | 834 | 190.8 |
| D | 1 | 52 | 174303 | 863.32 | 836 | 814 | 201.0 |
| D | 7 | 238 | 150317 | 743.96 | 836 | 814 | 201.0 |
| D | 12 | 227 | 26100 | 125.83 | 836 | 814 | 201.0 |
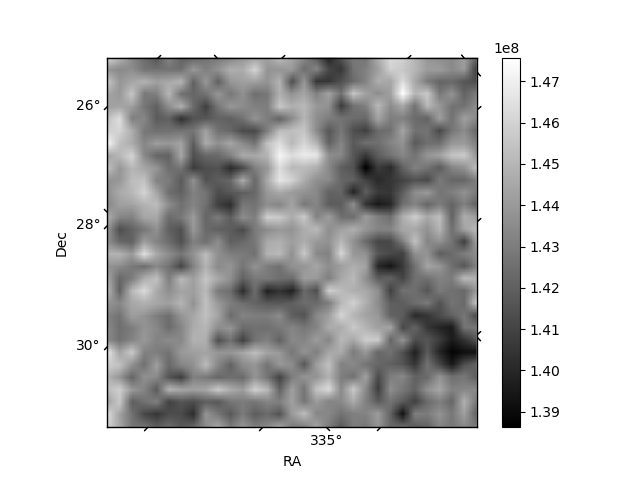
Histogram calculated using DETX and DETY for each event in the final _common_clean file
| Quadrant A | 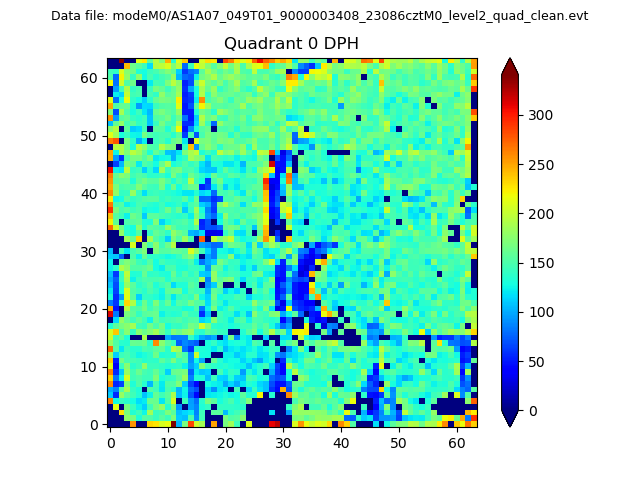 |
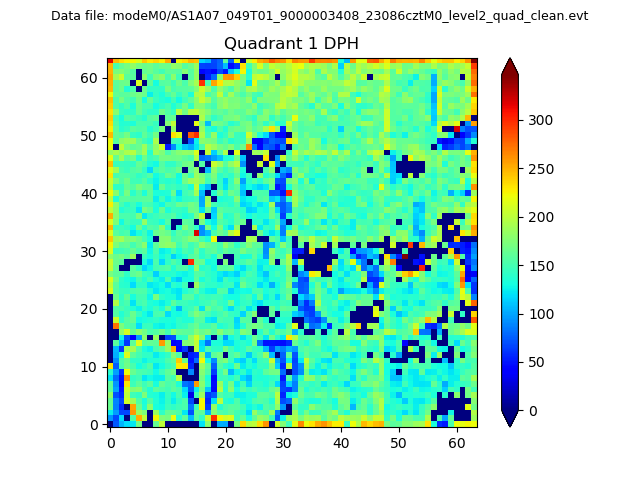 |
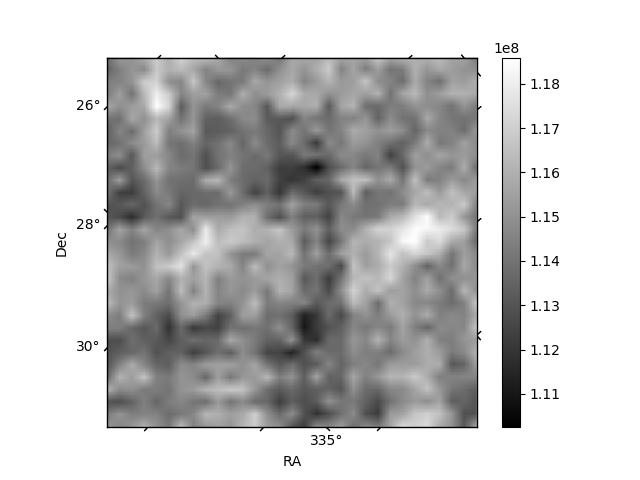
Quadrant B |
|---|---|---|---|
| Quadrant D | 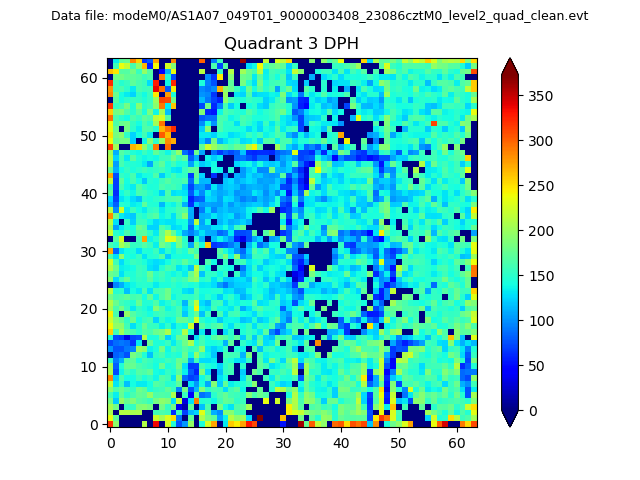 |
 |
Quadrant C |
| Plot type | Count rate plots | Images |
|---|---|---|
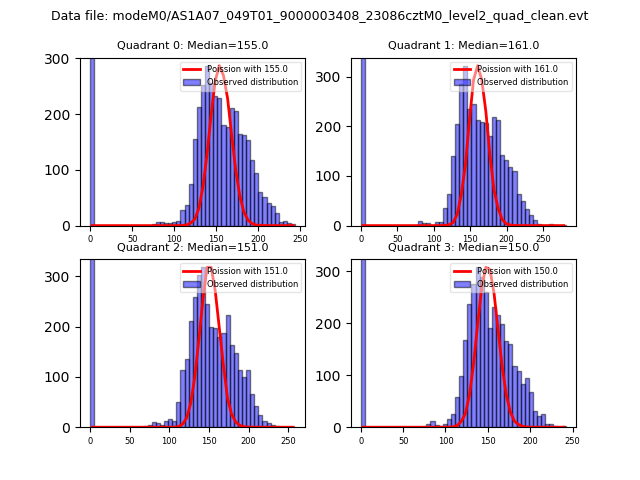
| Comparison with Poisson distribution Blue bars denote a histogram of data divided into 1 sec bins. Red curve is a Poisson curve with rate = median count rate of data. |
 |
 |
| Quadrant-wise count rates Data is divided into 100 sec bins |
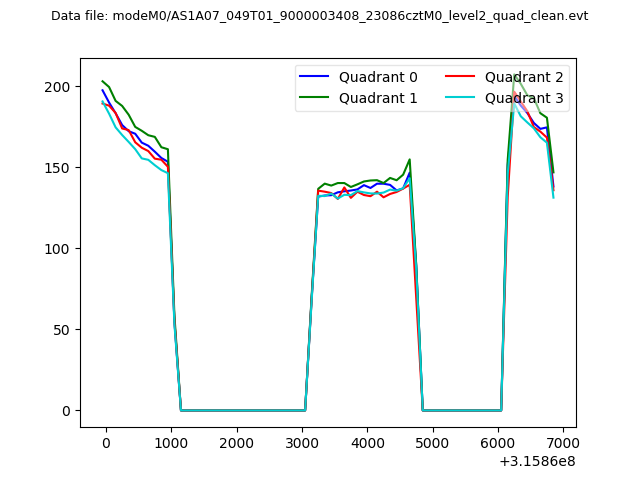 |
|
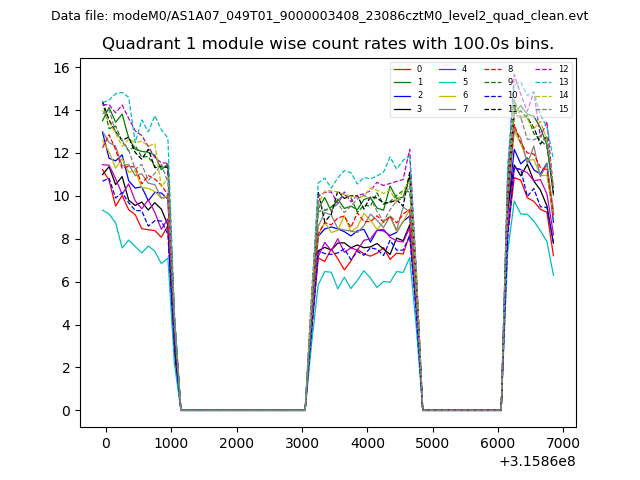
| Module-wise count rates for Quadrant A Data is divided into 100 sec bins |
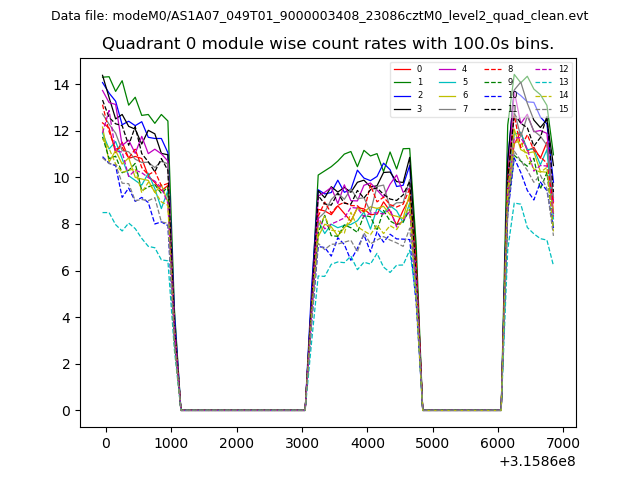 |
 |
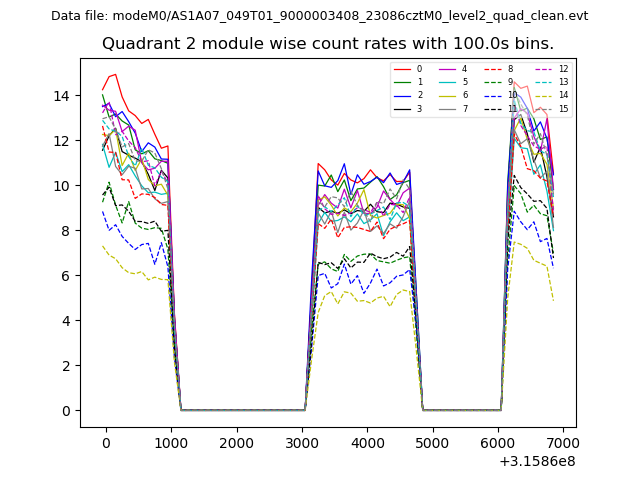
| Module-wise count rates for Quadrant B Data is divided into 100 sec bins |
 |
 |
| Module-wise count rates for Quadrant C Data is divided into 100 sec bins |
 |
 |
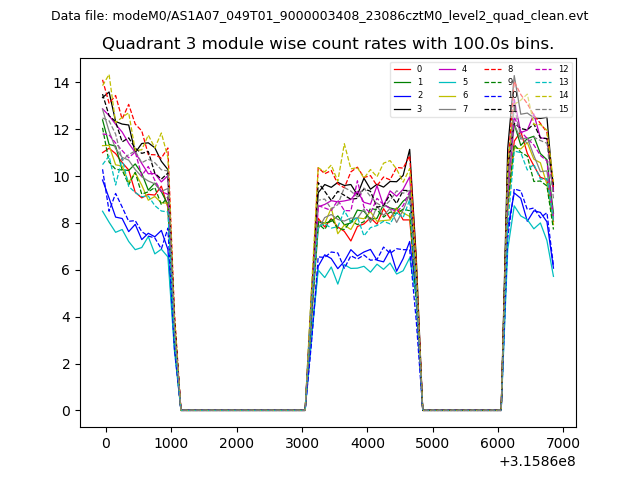
| Module-wise count rates for Quadrant D Data is divided into 100 sec bins |
 |
 |
| Parameter | Plot |
|---|---|
| CZT HV Monitor | 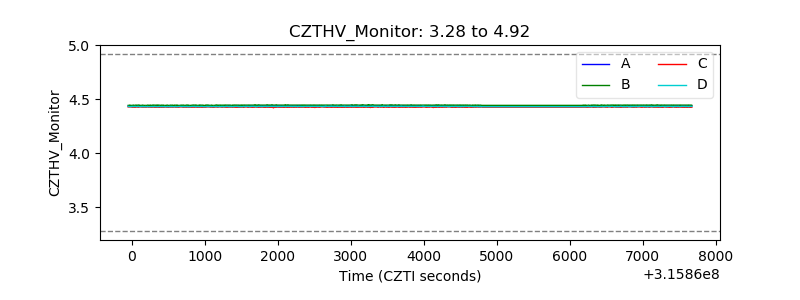 |
| D_VDD | 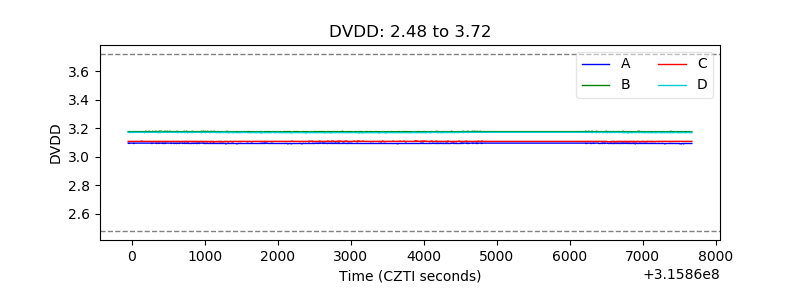 |
| Temperature 1 | 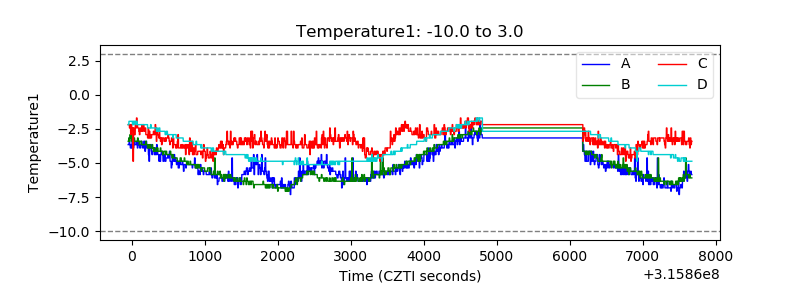 |
| Veto HV Monitor | 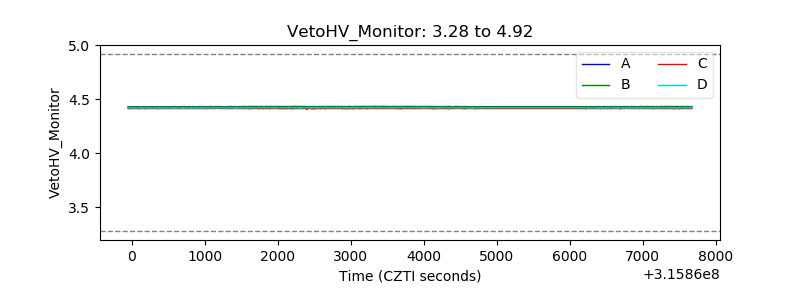 |
| Veto LLD | 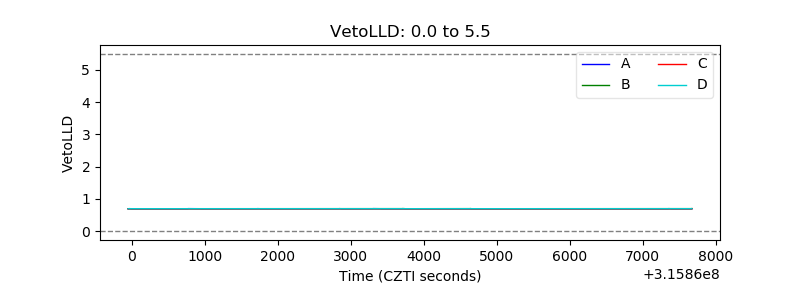 |
| Alpha Counter | 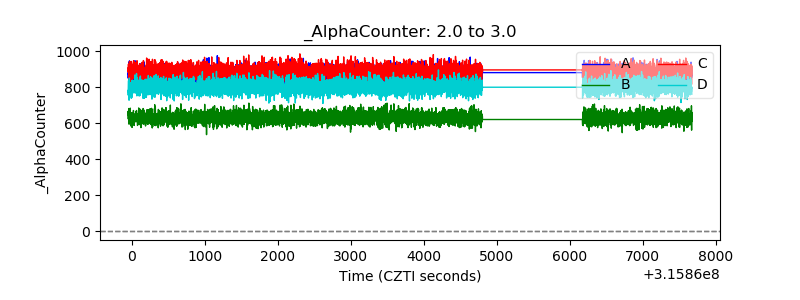 |
| _CPM_Rate | 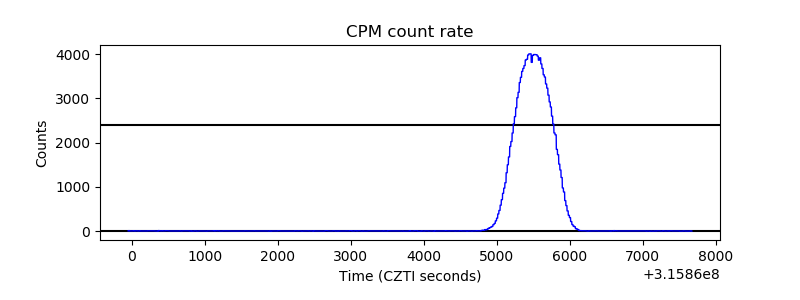 |
| CZT Counter | 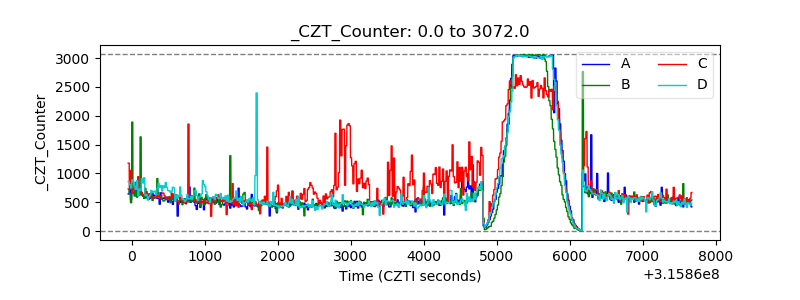 |
| +2.5 Volts monitor |  |
| +5 Volts monitor | 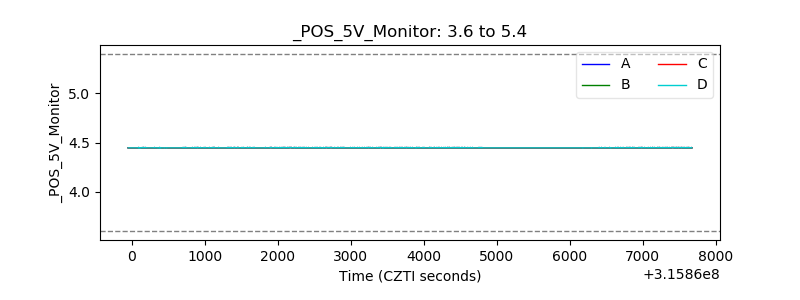 |
| _ROLL_ROT | 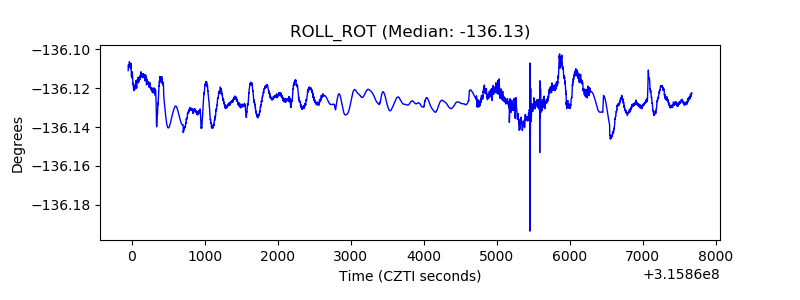 |
| _Roll_DEC |  |
| _Roll_RA | 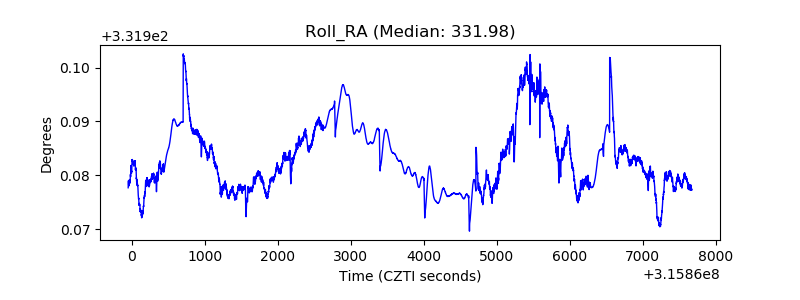 |
| Veto Counter | 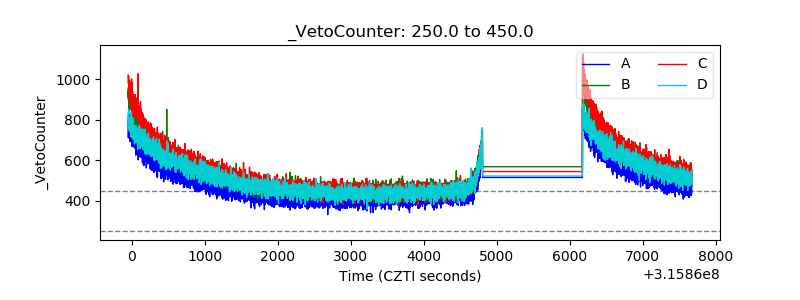 |