| Param | Original file | Final file |
|---|---|---|
| Filename | modeM0/AS1A07_049T01_9000003408_23089cztM0_level2.evt | modeM0/AS1A07_049T01_9000003408_23089cztM0_level2_quad_clean.evt |
| Size (bytes) | 771,969,600 | 62,735,040 |
| Size | 736.2 MB | 59.8 MB |
| Events in quadrant A | 10,973,943 | 224,141 |
| Events in quadrant B | 3,400,644 | 422,083 |
| Events in quadrant C | 4,239,370 | 399,811 |
| Events in quadrant D | 4,322,246 | 395,237 |
| Mode M0 | |||
|---|---|---|---|
| Quadrant | BADHDUFLAG | Total packets | Discarded packets |
| A | 0 | 36903 | 3 |
| B | 0 | 14007 | 2 |
| C | 0 | 16679 | 2 |
| D | 0 | 17058 | 2 |
| Mode M9 | |||
|---|---|---|---|
| Quadrant | BADHDUFLAG | Total packets | Discarded packets |
| A | 0 | 16 | 0 |
| B | 0 | 17 | 0 |
| C | 0 | 17 | 0 |
| D | 0 | 17 | 0 |
| Mode SS | |||
|---|---|---|---|
| Quadrant | BADHDUFLAG | Total packets | Discarded packets |
| A | 0 | 132 | 0 |
| B | 0 | 132 | 0 |
| C | 0 | 132 | 0 |
| D | 0 | 132 | 0 |
| Quadrant | Total seconds | Saturated seconds | Saturation percentage |
|---|---|---|---|
| A | 6557 | 3146 | 47.979259% |
| B | 6557 | 118 | 1.799603% |
| C | 6557 | 272 | 4.148239% |
| D | 6557 | 320 | 4.880281% |
Noise dominated data is calculated using 1-second bins in cleaned event files. If a bin has >2000 counts, and if more than 50% of those come from <1% of pixels, then it is considered to be noise-dominated and hence unusable.
| Quadrant | # 1 sec bins | Bins with >0 counts | Bins with >2000 counts | High rate bins dominated by noise | Noise dominated (total time) | Noise dominated (detector-on time) | Marked lightcurve |
|---|---|---|---|---|---|---|---|
| A | 7642 | 6557 | 2741 | 2741 | 35.87% | 41.80% | 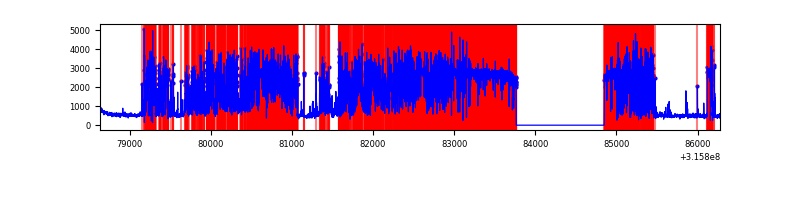 |
| B | 7642 | 6558 | 15 | 15 | 0.20% | 0.23% | 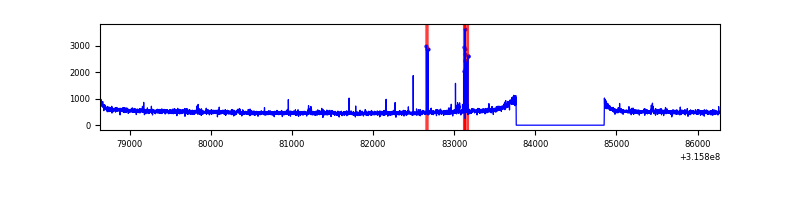 |
| C | 7642 | 6557 | 62 | 62 | 0.81% | 0.95% | 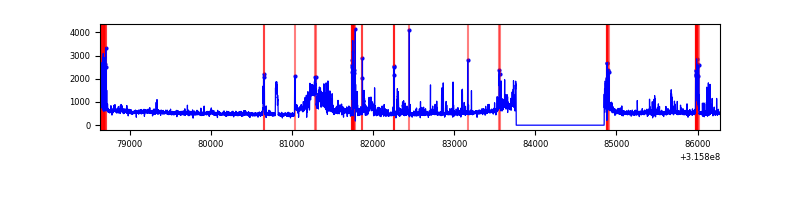 |
| D | 7642 | 6557 | 186 | 186 | 2.43% | 2.84% | 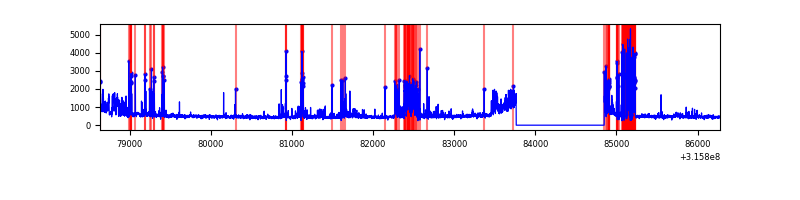 |
Top three noisy pixels from each quadrant. If the there are fewer than three noisy pixels in the level2.evt file, extra rows are filled as -1
| Pixel properties | Quadrant properties | ||||||
|---|---|---|---|---|---|---|---|
| Quadrant | DetID | PixID | Counts | Sigma | Mean | Median | Sigma |
| A | 6 | 16 | 8599608 | 70715.79 | 612 | 602 | 121.6 |
| A | 2 | 79 | 16451 | 130.34 | 612 | 602 | 121.6 |
| A | 13 | 254 | 7133 | 53.71 | 612 | 602 | 121.6 |
| B | 15 | 36 | 39871 | 245.51 | 844 | 822 | 159.0 |
| B | 12 | 111 | 19540 | 117.68 | 844 | 822 | 159.0 |
| B | 11 | 111 | 17311 | 103.67 | 844 | 822 | 159.0 |
| C | 10 | 187 | 566344 | 3020.68 | 806 | 814 | 187.2 |
| C | 0 | 10 | 341428 | 1819.33 | 806 | 814 | 187.2 |
| C | 14 | 238 | 127317 | 675.69 | 806 | 814 | 187.2 |
| D | 1 | 52 | 728292 | 3717.78 | 810 | 788 | 195.7 |
| D | 13 | 172 | 487688 | 2488.22 | 810 | 788 | 195.7 |
| D | 1 | 239 | 43339 | 217.45 | 810 | 788 | 195.7 |
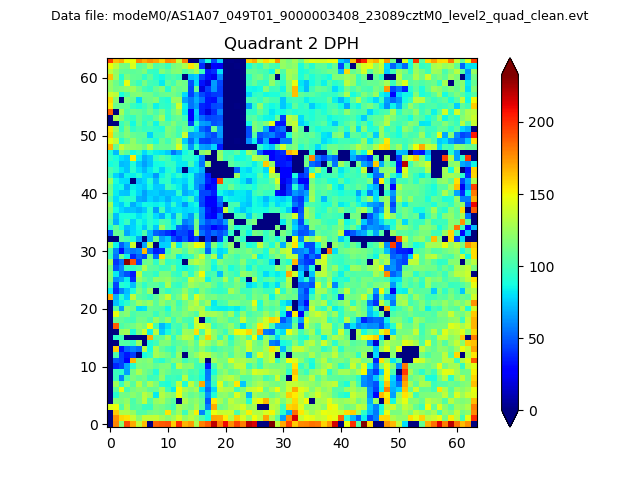
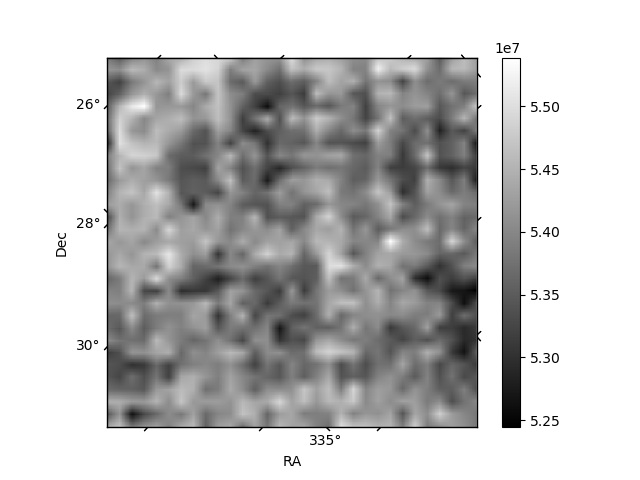
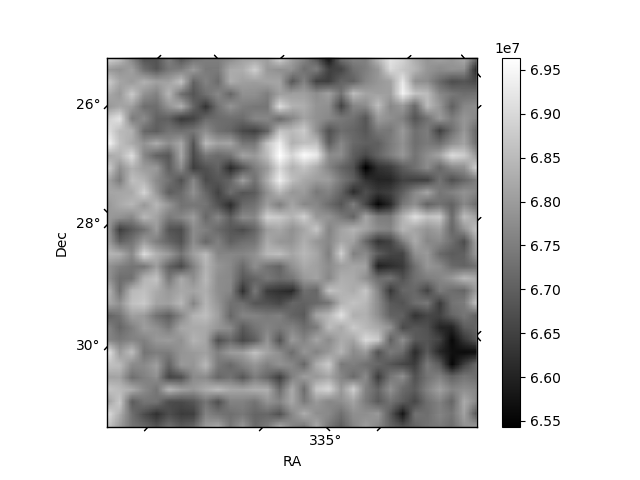
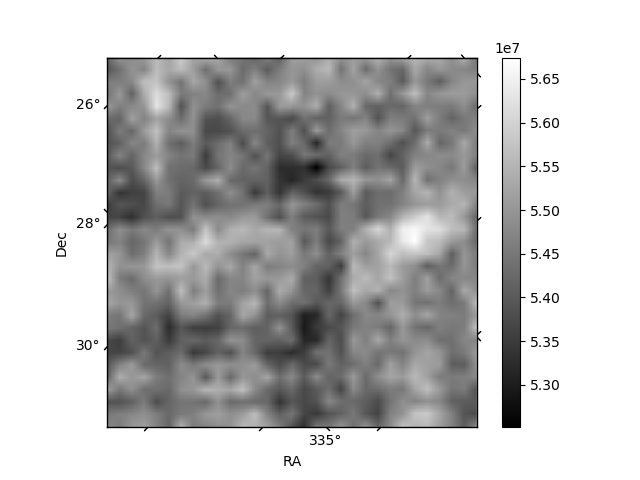
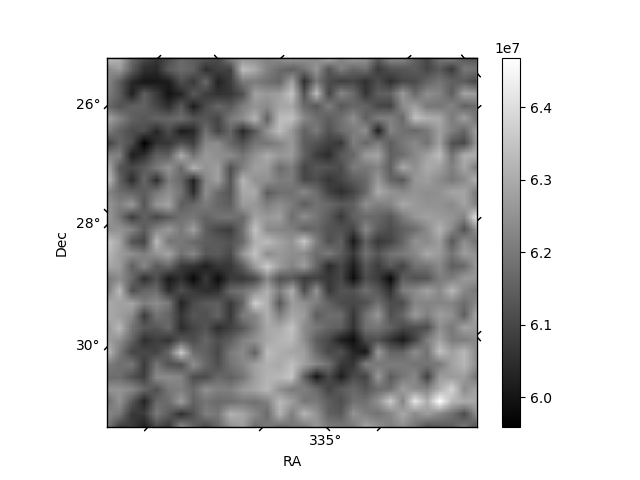
Histogram calculated using DETX and DETY for each event in the final _common_clean file
| Quadrant A | 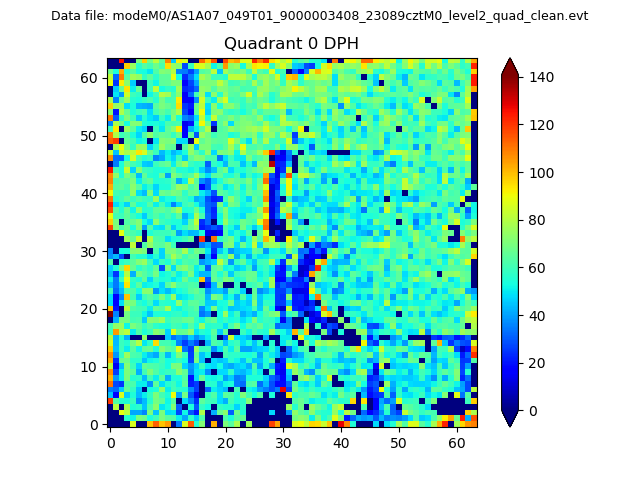 |
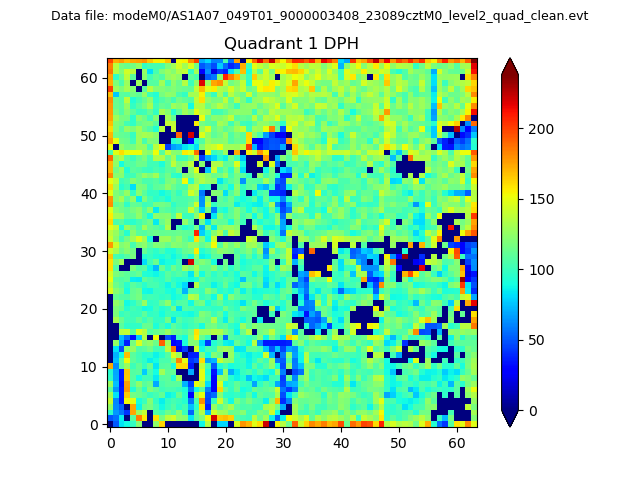 |
Quadrant B |
|---|---|---|---|
| Quadrant D | 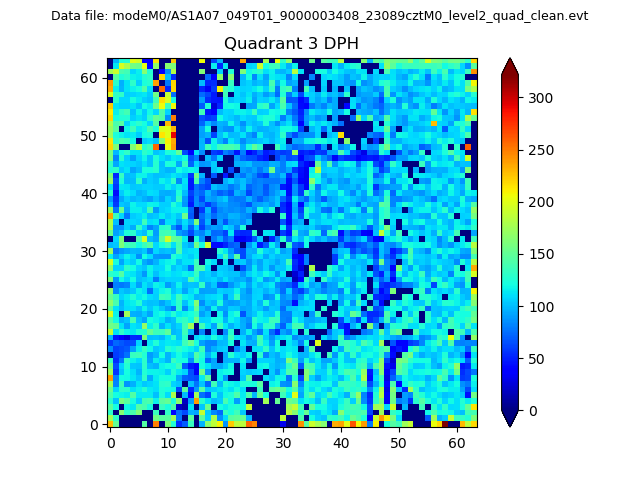 |
 |
Quadrant C |
| Plot type | Count rate plots | Images |
|---|---|---|
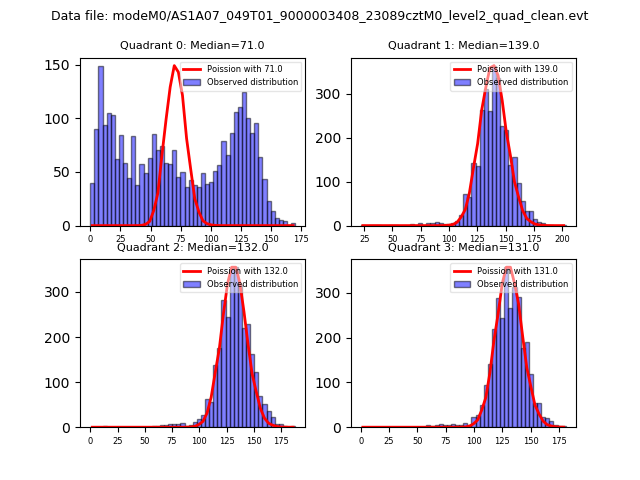
| Comparison with Poisson distribution Blue bars denote a histogram of data divided into 1 sec bins. Red curve is a Poisson curve with rate = median count rate of data. |
 |
 |
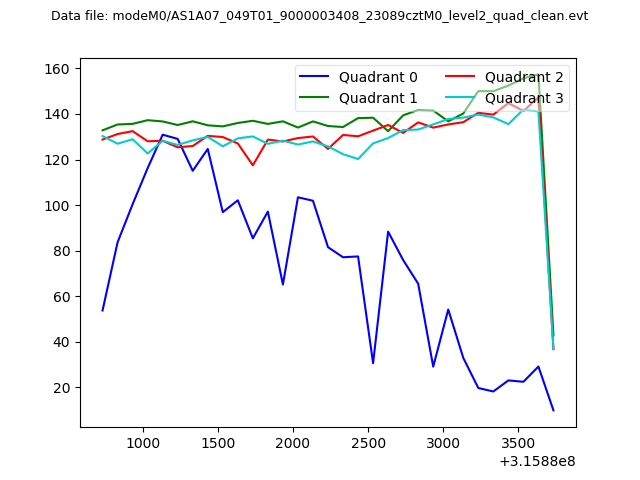
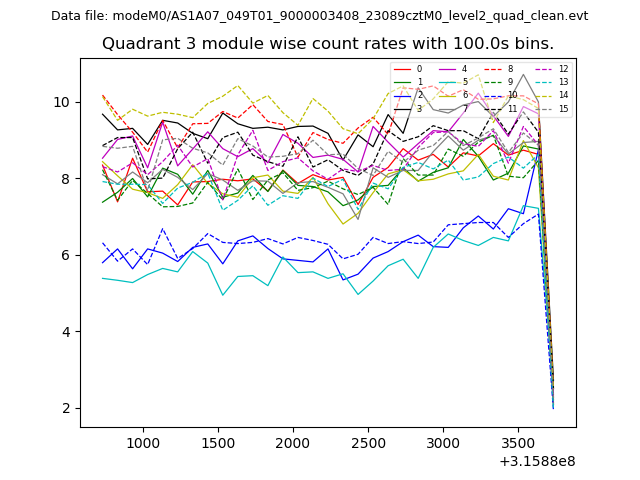
| Quadrant-wise count rates Data is divided into 100 sec bins |
 |
|
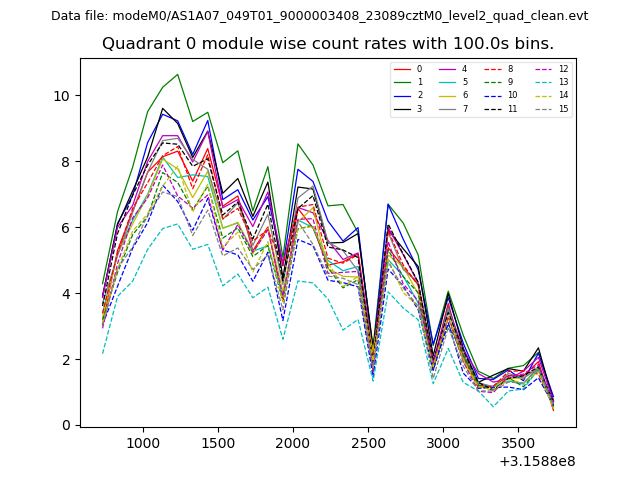
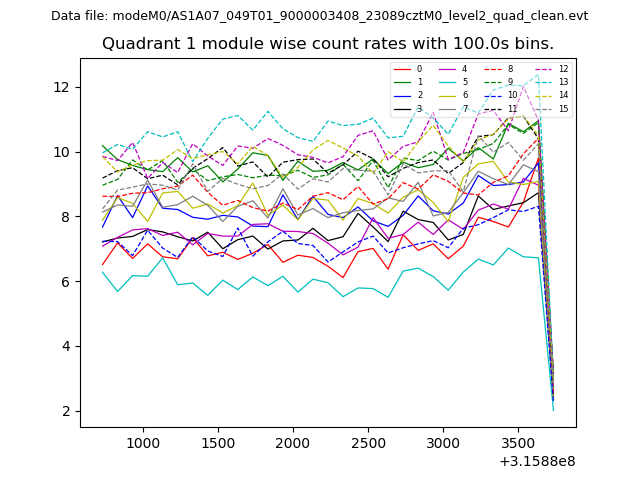
| Module-wise count rates for Quadrant A Data is divided into 100 sec bins |
 |
 |
| Module-wise count rates for Quadrant B Data is divided into 100 sec bins |
 |
 |
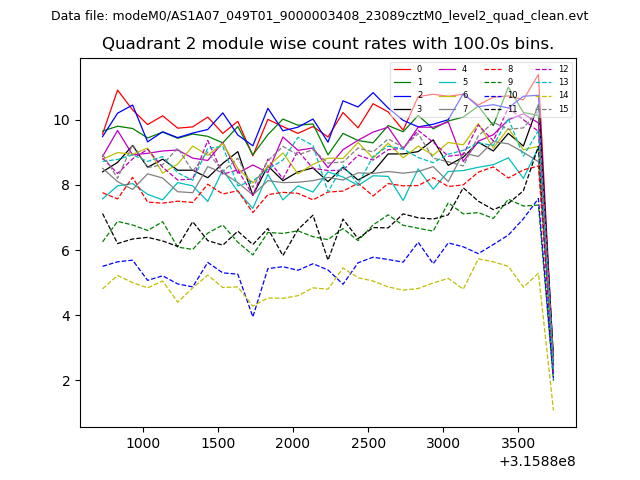
| Module-wise count rates for Quadrant C Data is divided into 100 sec bins |
 |
 |
| Module-wise count rates for Quadrant D Data is divided into 100 sec bins |
 |
 |
| Parameter | Plot |
|---|---|
| CZT HV Monitor | 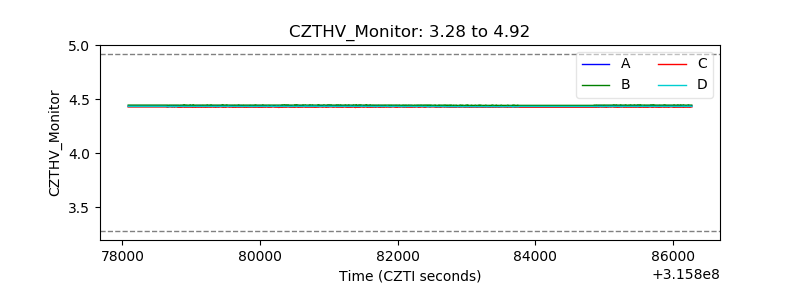 |
| D_VDD |  |
| Temperature 1 | 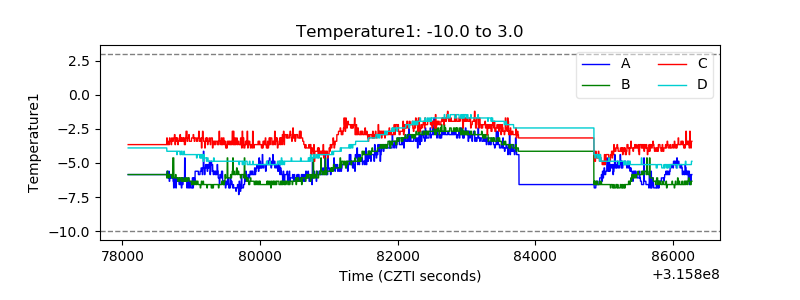 |
| Veto HV Monitor | 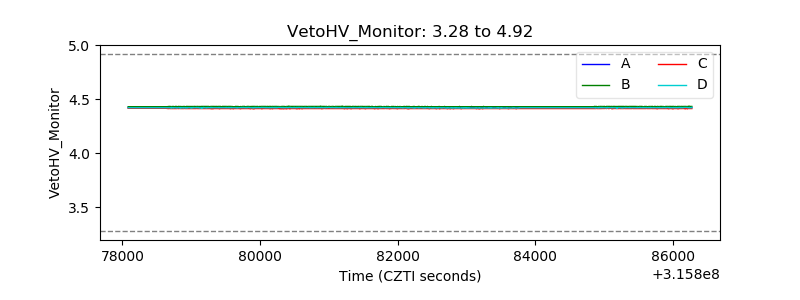 |
| Veto LLD | 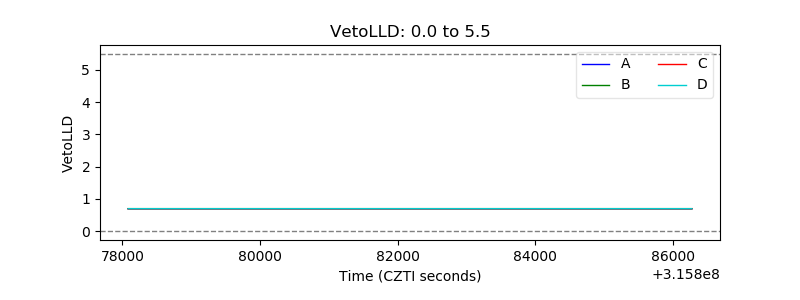 |
| Alpha Counter | 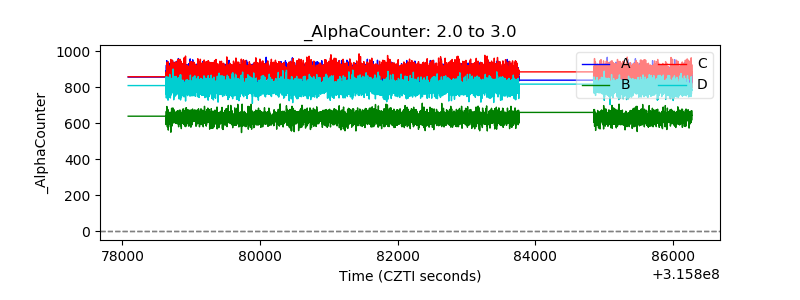 |
| _CPM_Rate | 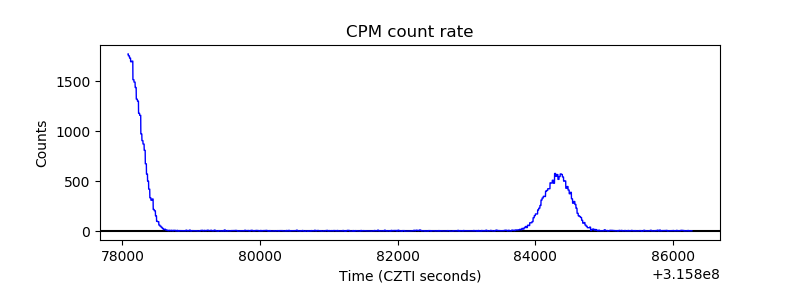 |
| CZT Counter | 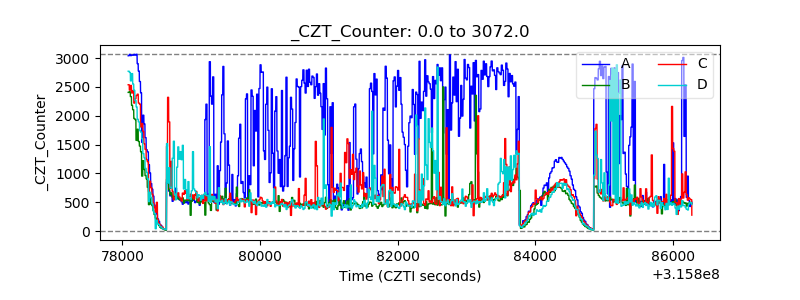 |
| +2.5 Volts monitor |  |
| +5 Volts monitor |  |
| _ROLL_ROT | 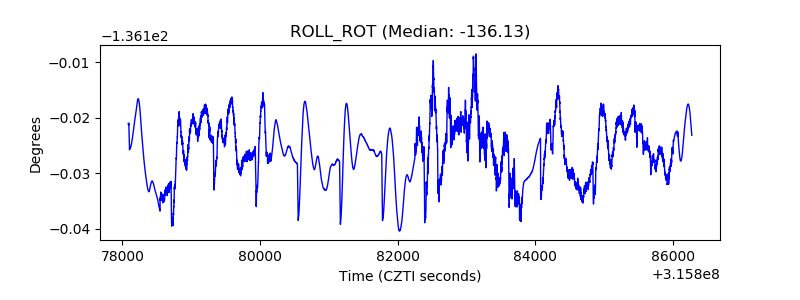 |
| _Roll_DEC | 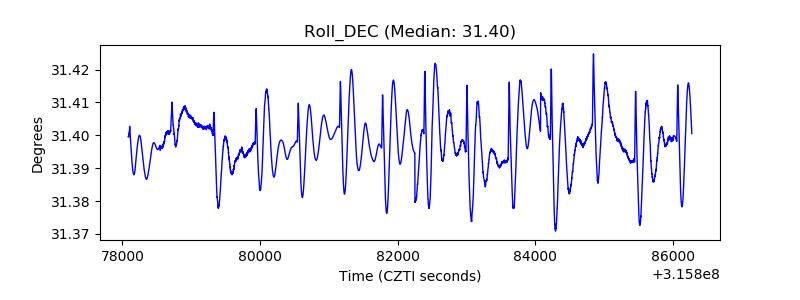 |
| _Roll_RA | 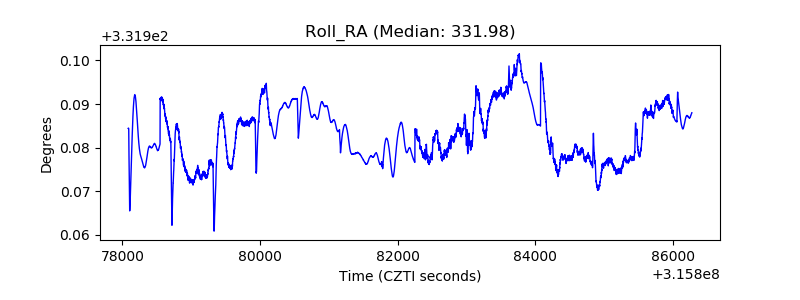 |
| Veto Counter | 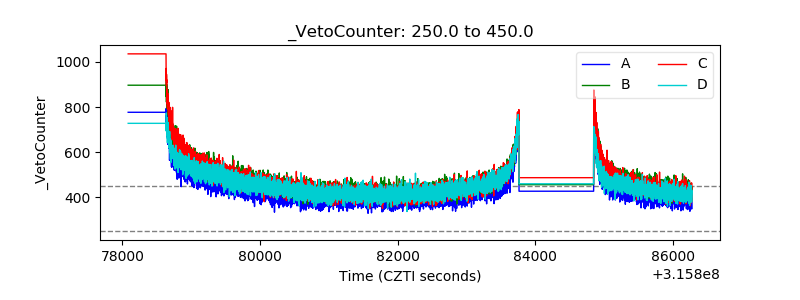 |