| Param | Original file | Final file |
|---|---|---|
| Filename | modeM0/AS1A07_049T01_9000003408_23093cztM0_level2.evt | modeM0/AS1A07_049T01_9000003408_23093cztM0_level2_quad_clean.evt |
| Size (bytes) | 701,968,320 | 95,221,440 |
| Size | 669.4 MB | 90.8 MB |
| Events in quadrant A | 10,112,474 | 460,691 |
| Events in quadrant B | 3,519,576 | 658,490 |
| Events in quadrant C | 3,522,317 | 631,631 |
| Events in quadrant D | 3,609,912 | 623,522 |
| Mode M0 | |||
|---|---|---|---|
| Quadrant | BADHDUFLAG | Total packets | Discarded packets |
| A | 0 | 34845 | 1 |
| B | 0 | 15249 | 1 |
| C | 0 | 15232 | 1 |
| D | 0 | 15704 | 2 |
| Mode M9 | |||
|---|---|---|---|
| Quadrant | BADHDUFLAG | Total packets | Discarded packets |
| A | 0 | 4 | 0 |
| B | 0 | 4 | 0 |
| C | 0 | 4 | 0 |
| D | 0 | 4 | 0 |
| Mode SS | |||
|---|---|---|---|
| Quadrant | BADHDUFLAG | Total packets | Discarded packets |
| A | 0 | 146 | 0 |
| B | 0 | 146 | 0 |
| C | 0 | 146 | 0 |
| D | 0 | 146 | 0 |
| Quadrant | Total seconds | Saturated seconds | Saturation percentage |
|---|---|---|---|
| A | 7308 | 2782 | 38.067871% |
| B | 7309 | 130 | 1.778629% |
| C | 7309 | 131 | 1.792311% |
| D | 7308 | 70 | 0.957854% |
Noise dominated data is calculated using 1-second bins in cleaned event files. If a bin has >2000 counts, and if more than 50% of those come from <1% of pixels, then it is considered to be noise-dominated and hence unusable.
| Quadrant | # 1 sec bins | Bins with >0 counts | Bins with >2000 counts | High rate bins dominated by noise | Noise dominated (total time) | Noise dominated (detector-on time) | Marked lightcurve |
|---|---|---|---|---|---|---|---|
| A | 7632 | 7307 | 2329 | 2329 | 30.52% | 31.87% | 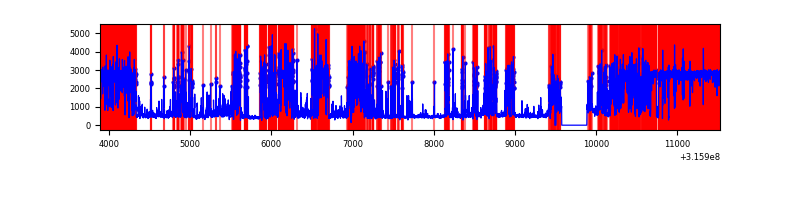 |
| B | 7634 | 7311 | 3 | 3 | 0.04% | 0.04% | 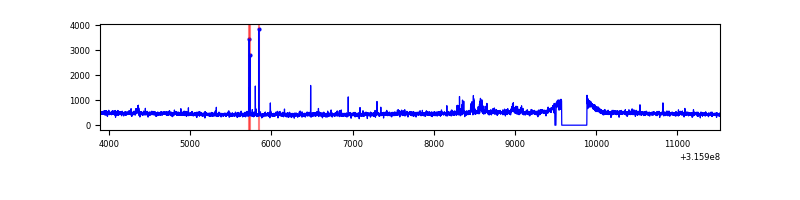 |
| C | 7634 | 7311 | 3 | 3 | 0.04% | 0.04% | 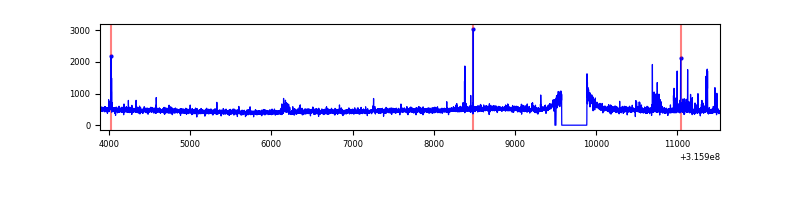 |
| D | 7633 | 7310 | 8 | 8 | 0.10% | 0.11% | 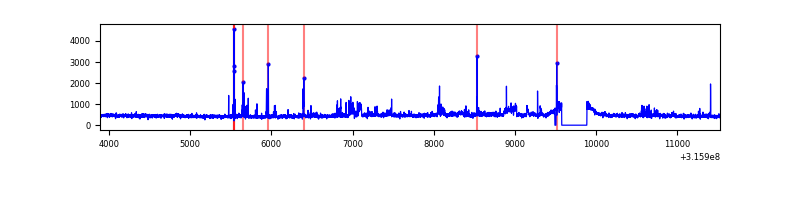 |
Top three noisy pixels from each quadrant. If the there are fewer than three noisy pixels in the level2.evt file, extra rows are filled as -1
| Pixel properties | Quadrant properties | ||||||
|---|---|---|---|---|---|---|---|
| Quadrant | DetID | PixID | Counts | Sigma | Mean | Median | Sigma |
| A | 6 | 16 | 7432327 | 52486.01 | 694 | 679 | 141.6 |
| A | 13 | 254 | 7848 | 50.63 | 694 | 679 | 141.6 |
| A | 3 | 137 | 6225 | 39.17 | 694 | 679 | 141.6 |
| B | 0 | 183 | 41082 | 237.66 | 871 | 847 | 169.3 |
| B | 0 | 189 | 23949 | 136.46 | 871 | 847 | 169.3 |
| B | 12 | 111 | 21091 | 119.58 | 871 | 847 | 169.3 |
| C | 14 | 238 | 130165 | 655.58 | 838 | 842 | 197.3 |
| C | 0 | 10 | 75166 | 376.77 | 838 | 842 | 197.3 |
| C | 0 | 207 | 38665 | 191.74 | 838 | 842 | 197.3 |
| D | 12 | 227 | 138269 | 658.46 | 853 | 828 | 208.7 |
| D | 13 | 172 | 115965 | 551.61 | 853 | 828 | 208.7 |
| D | 1 | 52 | 89398 | 424.33 | 853 | 828 | 208.7 |
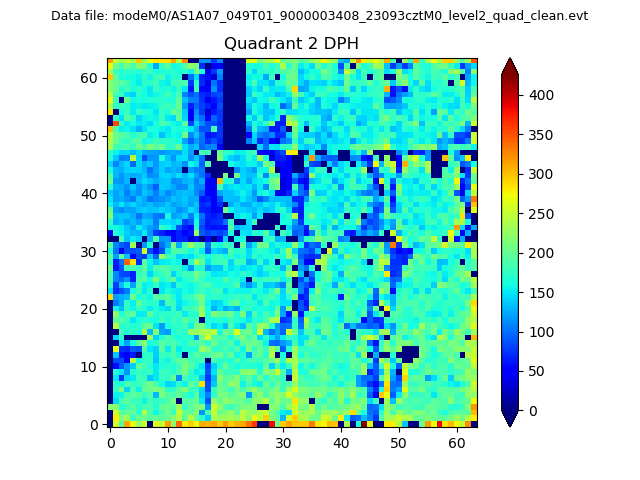
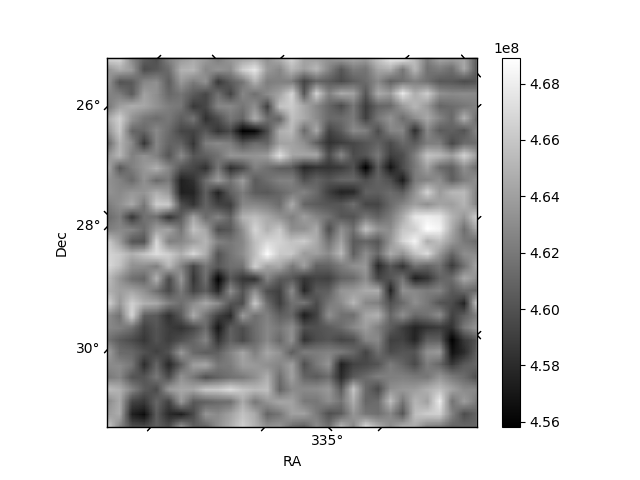
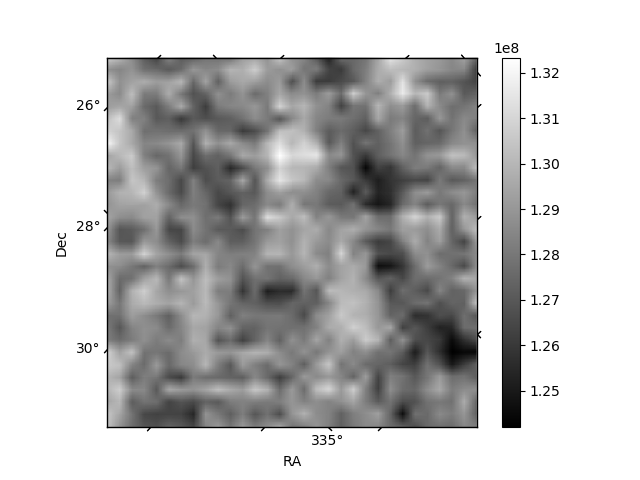
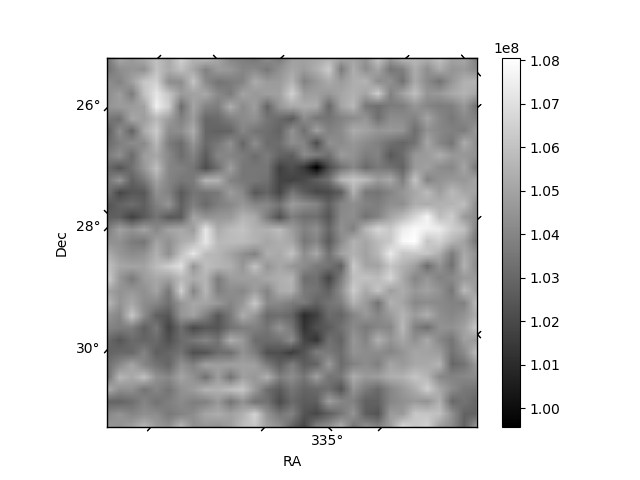
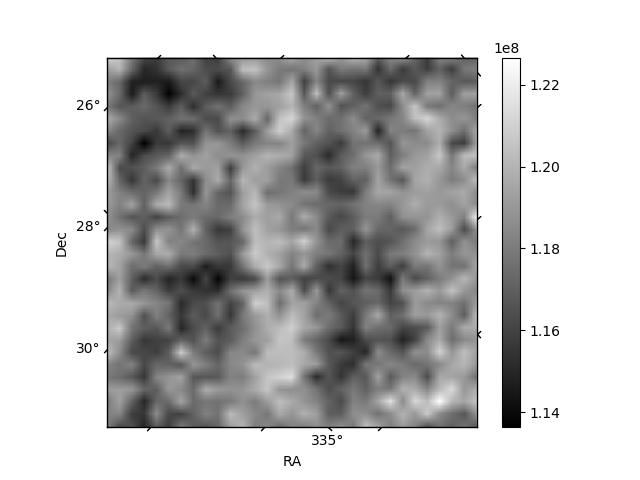
Histogram calculated using DETX and DETY for each event in the final _common_clean file
| Quadrant A | 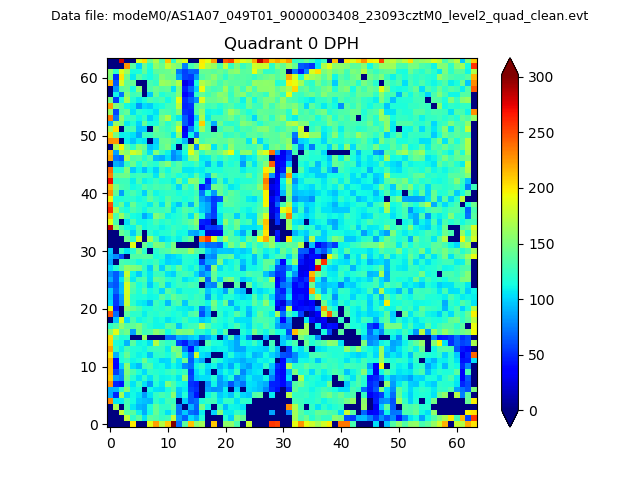 |
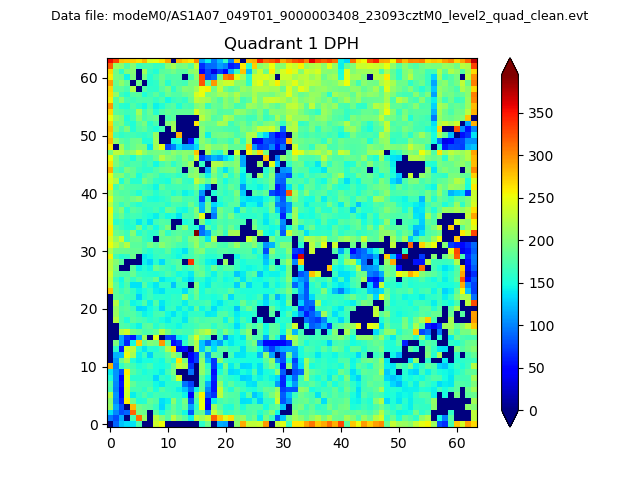 |
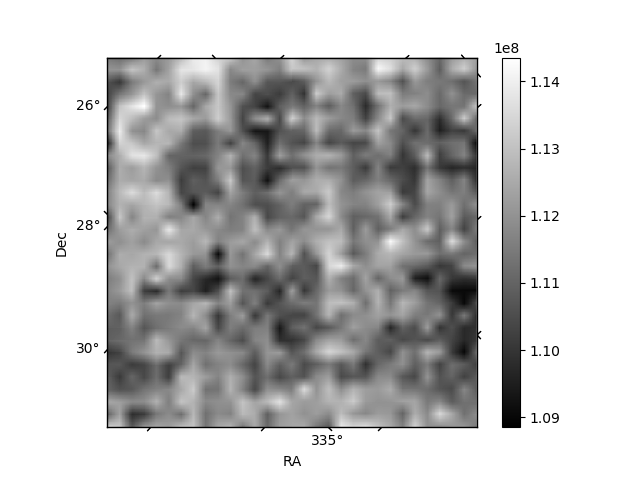
Quadrant B |
|---|---|---|---|
| Quadrant D | 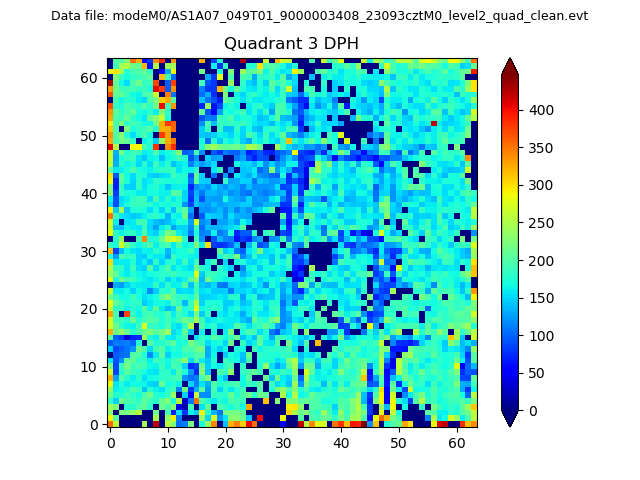 |
 |
Quadrant C |
| Plot type | Count rate plots | Images |
|---|---|---|
| Comparison with Poisson distribution Blue bars denote a histogram of data divided into 1 sec bins. Red curve is a Poisson curve with rate = median count rate of data. |
 |
 |
| Quadrant-wise count rates Data is divided into 100 sec bins |
 |
|
| Module-wise count rates for Quadrant A Data is divided into 100 sec bins |
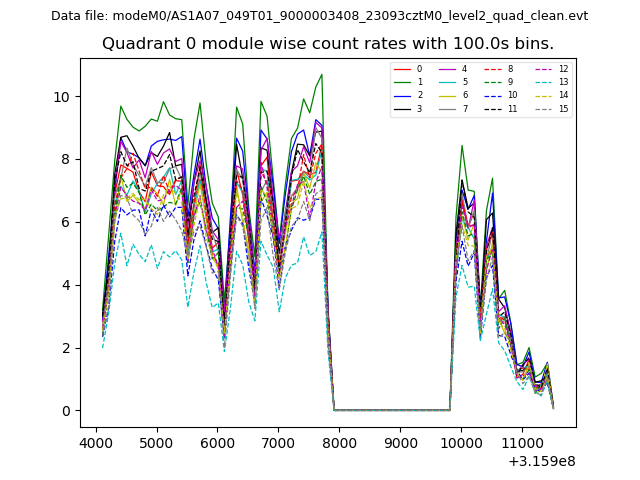 |
 |
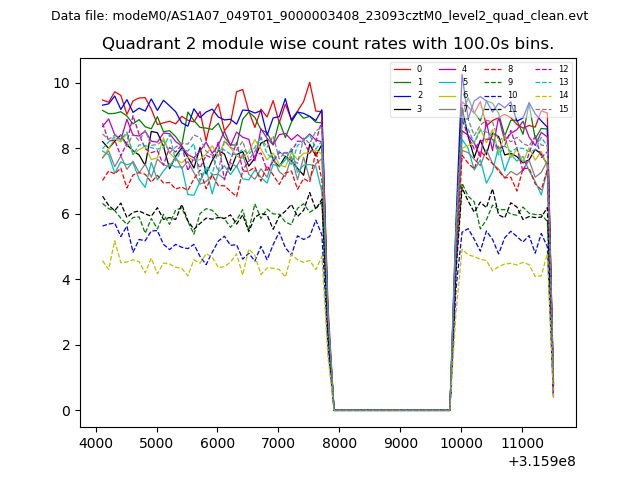
| Module-wise count rates for Quadrant B Data is divided into 100 sec bins |
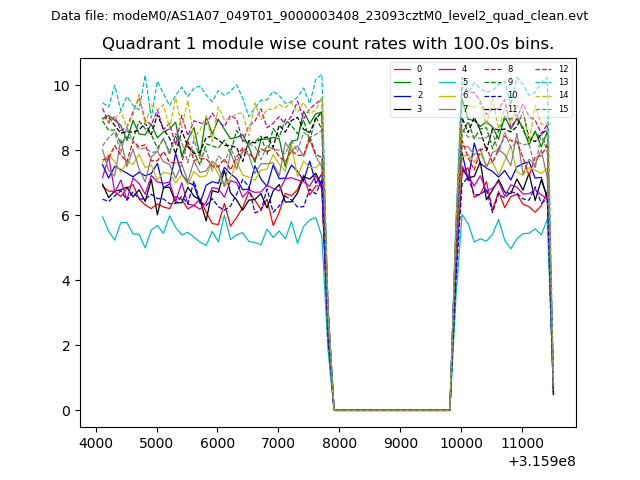 |
 |
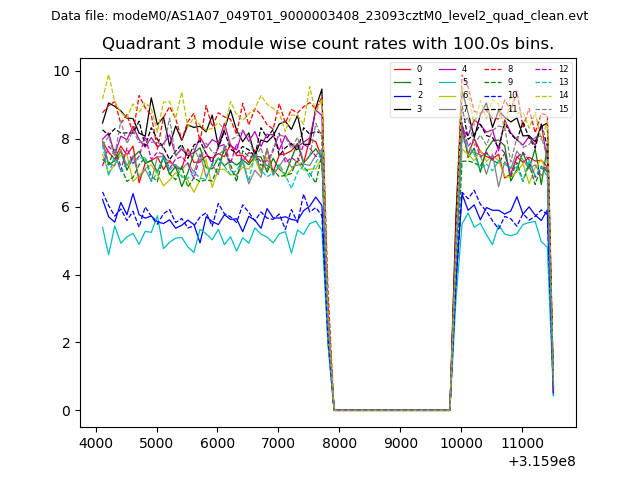
| Module-wise count rates for Quadrant C Data is divided into 100 sec bins |
 |
 |
| Module-wise count rates for Quadrant D Data is divided into 100 sec bins |
 |
 |
| Parameter | Plot |
|---|---|
| CZT HV Monitor | 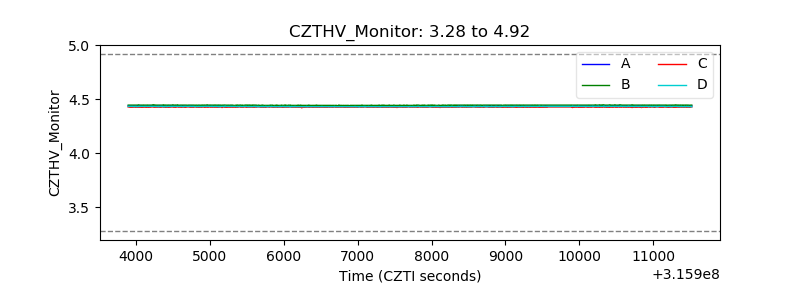 |
| D_VDD | 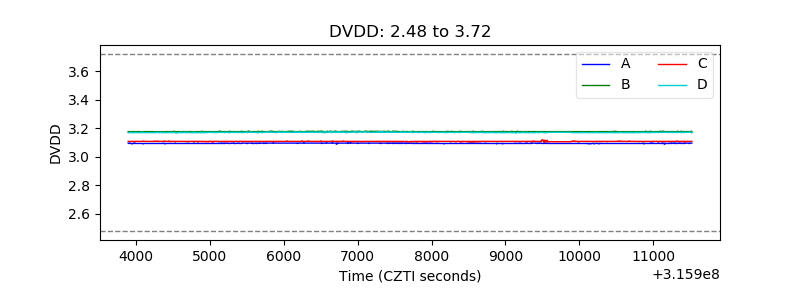 |
| Temperature 1 | 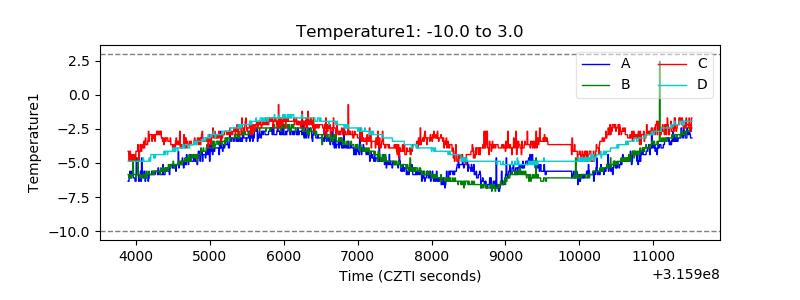 |
| Veto HV Monitor | 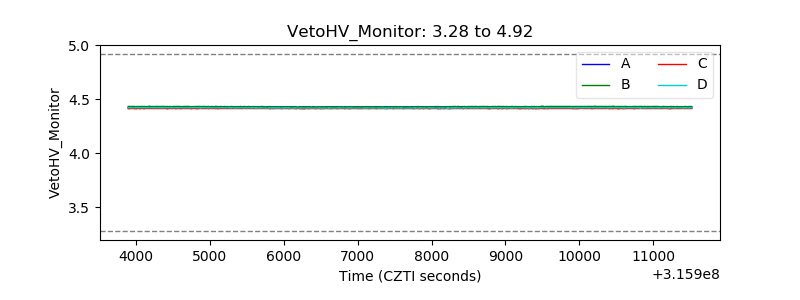 |
| Veto LLD | 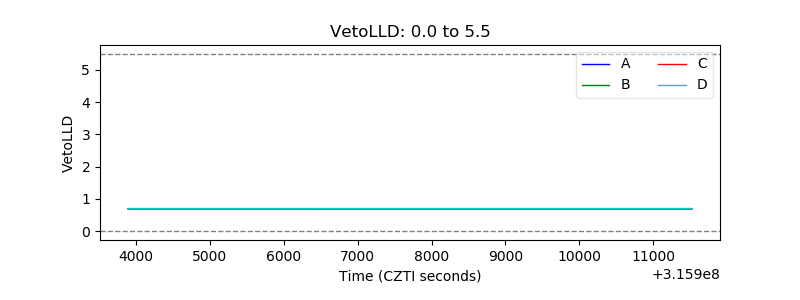 |
| Alpha Counter |  |
| _CPM_Rate |  |
| CZT Counter | 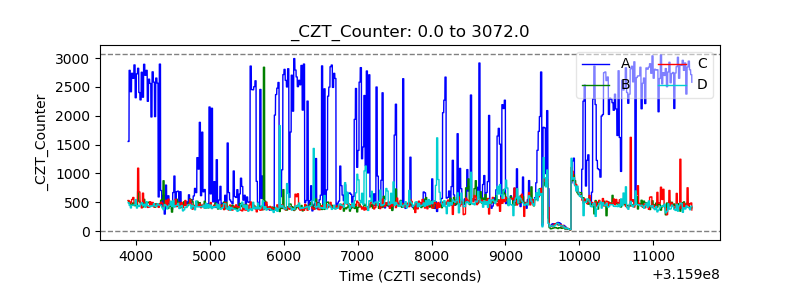 |
| +2.5 Volts monitor |  |
| +5 Volts monitor |  |
| _ROLL_ROT | 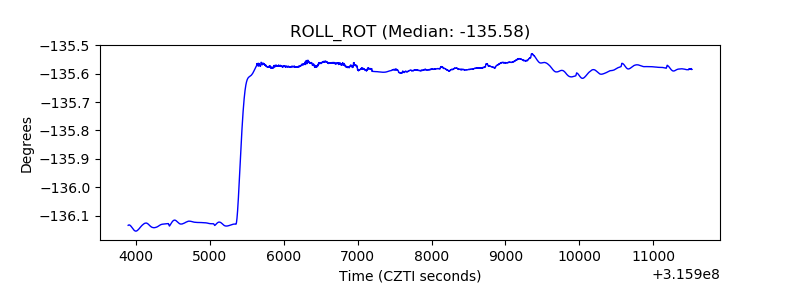 |
| _Roll_DEC | 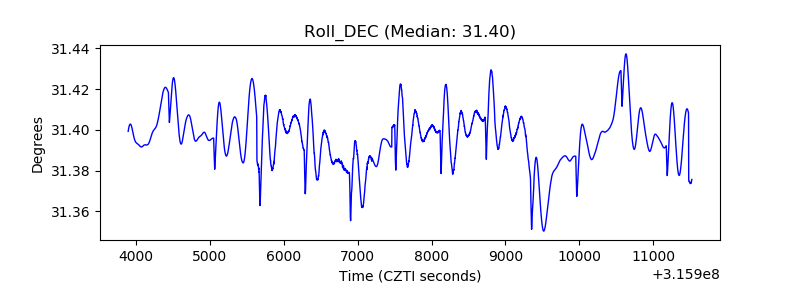 |
| _Roll_RA | 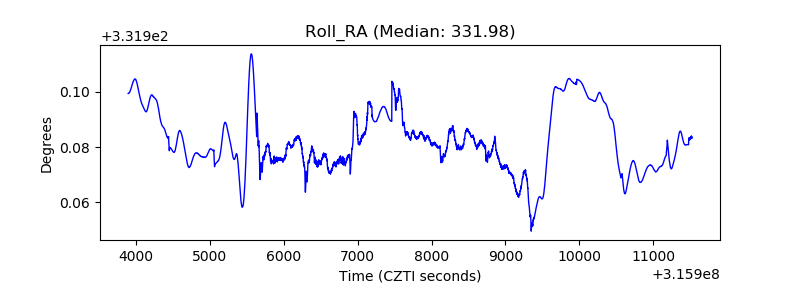 |
| Veto Counter | 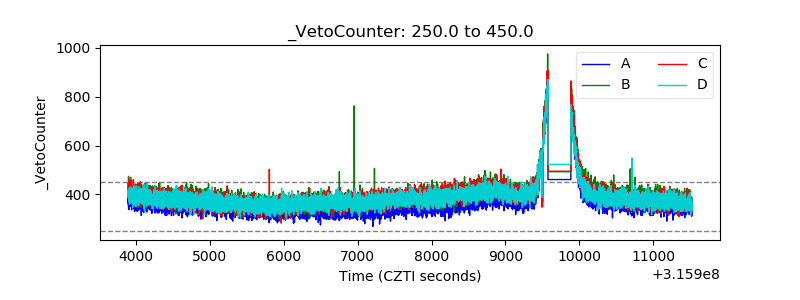 |