| Param | Original file | Final file |
|---|---|---|
| Filename | modeM0/AS1A07_049T01_9000003408_23095cztM0_level2.evt | modeM0/AS1A07_049T01_9000003408_23095cztM0_level2_quad_clean.evt |
| Size (bytes) | 1,320,770,880 | 150,120,000 |
| Size | 1.2 GB | 143.2 MB |
| Events in quadrant A | 14,862,722 | 730,137 |
| Events in quadrant B | 5,877,099 | 1,043,186 |
| Events in quadrant C | 6,545,495 | 994,306 |
| Events in quadrant D | 11,869,495 | 911,215 |
| Mode M0 | |||
|---|---|---|---|
| Quadrant | BADHDUFLAG | Total packets | Discarded packets |
| A | 0 | 52414 | 2 |
| B | 0 | 25724 | 2 |
| C | 0 | 27787 | 2 |
| D | 0 | 43952 | 2 |
| Mode M9 | |||
|---|---|---|---|
| Quadrant | BADHDUFLAG | Total packets | Discarded packets |
| A | 0 | 12 | 0 |
| B | 0 | 12 | 0 |
| C | 0 | 12 | 0 |
| D | 0 | 12 | 0 |
| Mode SS | |||
|---|---|---|---|
| Quadrant | BADHDUFLAG | Total packets | Discarded packets |
| A | 0 | 256 | 0 |
| B | 0 | 256 | 0 |
| C | 0 | 256 | 0 |
| D | 0 | 256 | 0 |
| Quadrant | Total seconds | Saturated seconds | Saturation percentage |
|---|---|---|---|
| A | 12507 | 3714 | 29.695371% |
| B | 12508 | 122 | 0.975376% |
| C | 12507 | 240 | 1.918925% |
| D | 12507 | 2524 | 20.180699% |
Noise dominated data is calculated using 1-second bins in cleaned event files. If a bin has >2000 counts, and if more than 50% of those come from <1% of pixels, then it is considered to be noise-dominated and hence unusable.
| Quadrant | # 1 sec bins | Bins with >0 counts | Bins with >2000 counts | High rate bins dominated by noise | Noise dominated (total time) | Noise dominated (detector-on time) | Marked lightcurve |
|---|---|---|---|---|---|---|---|
| A | 13782 | 12509 | 3279 | 3279 | 23.79% | 26.21% | 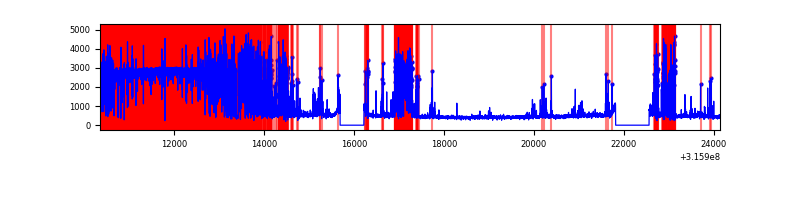 |
| B | 13783 | 12510 | 6 | 6 | 0.04% | 0.05% | 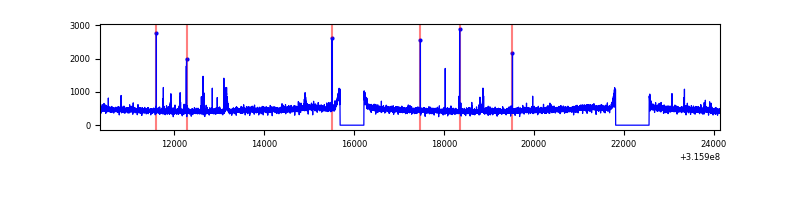 |
| C | 13782 | 12509 | 36 | 36 | 0.26% | 0.29% | 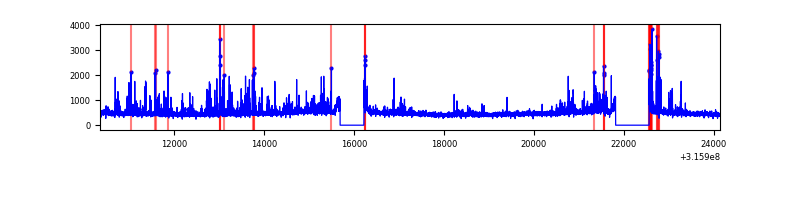 |
| D | 13782 | 12509 | 2476 | 2476 | 17.97% | 19.79% | 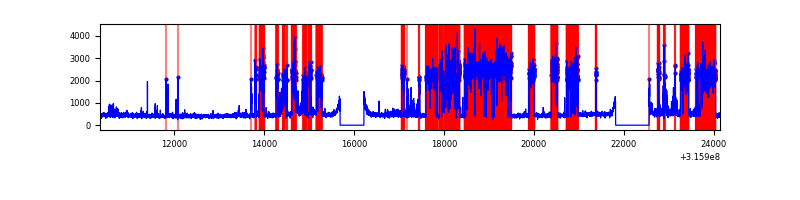 |
Top three noisy pixels from each quadrant. If the there are fewer than three noisy pixels in the level2.evt file, extra rows are filled as -1
| Pixel properties | Quadrant properties | ||||||
|---|---|---|---|---|---|---|---|
| Quadrant | DetID | PixID | Counts | Sigma | Mean | Median | Sigma |
| A | 6 | 16 | 10139287 | 40857.48 | 1222 | 1191 | 248.1 |
| A | 13 | 254 | 15264 | 56.72 | 1222 | 1191 | 248.1 |
| A | 5 | 98 | 13590 | 49.97 | 1222 | 1191 | 248.1 |
| B | 6 | 36 | 40264 | 138.12 | 1468 | 1432 | 281.2 |
| B | 12 | 111 | 35131 | 119.86 | 1468 | 1432 | 281.2 |
| B | 11 | 111 | 32184 | 109.38 | 1468 | 1432 | 281.2 |
| C | 0 | 10 | 706282 | 2132.27 | 1413 | 1422 | 330.6 |
| C | 14 | 238 | 222802 | 669.7 | 1413 | 1422 | 330.6 |
| C | 0 | 207 | 66235 | 196.07 | 1413 | 1422 | 330.6 |
| D | 7 | 238 | 6226981 | 18626.35 | 1377 | 1339 | 334.2 |
| D | 1 | 52 | 216835 | 644.74 | 1377 | 1339 | 334.2 |
| D | 12 | 233 | 125634 | 371.88 | 1377 | 1339 | 334.2 |
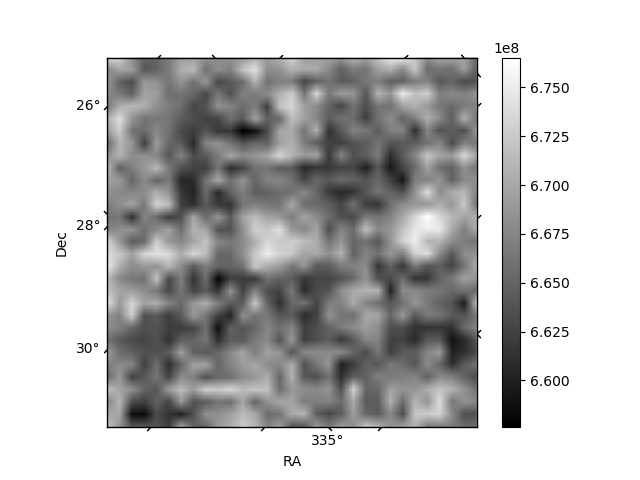
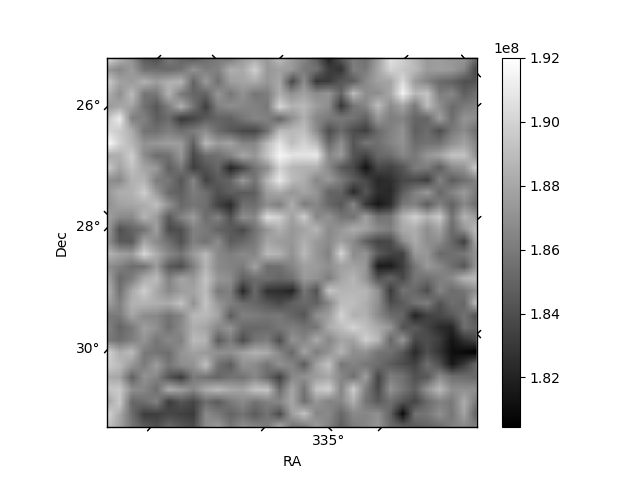
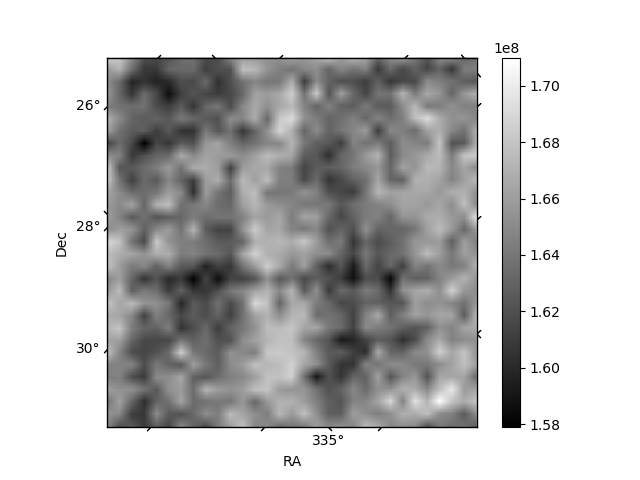
Histogram calculated using DETX and DETY for each event in the final _common_clean file
| Quadrant A | 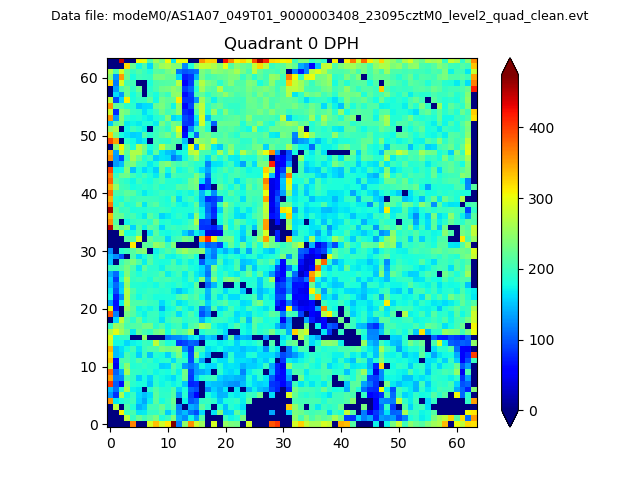 |
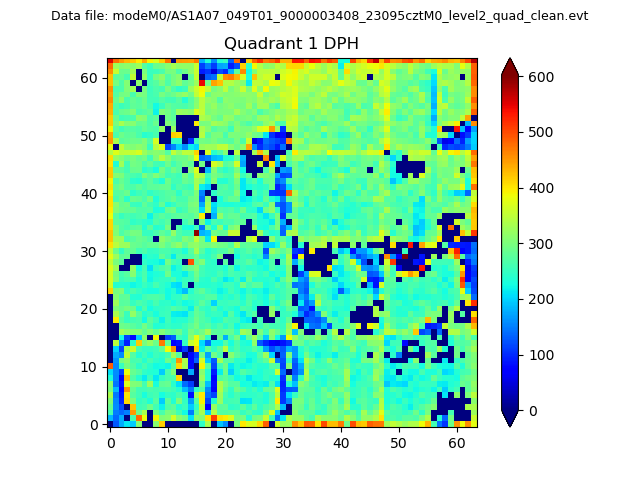 |
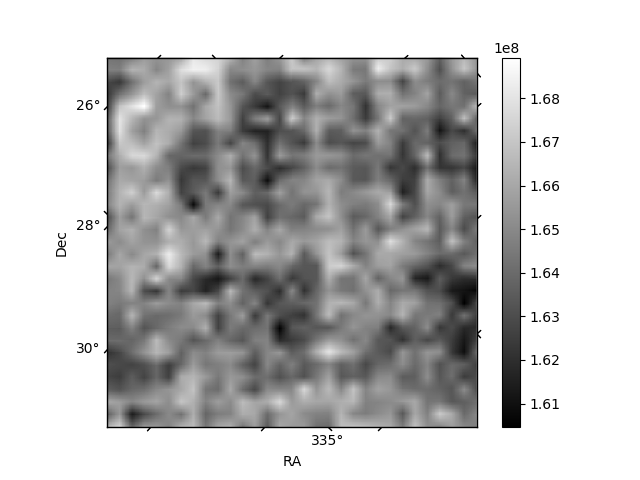
Quadrant B |
|---|---|---|---|
| Quadrant D | 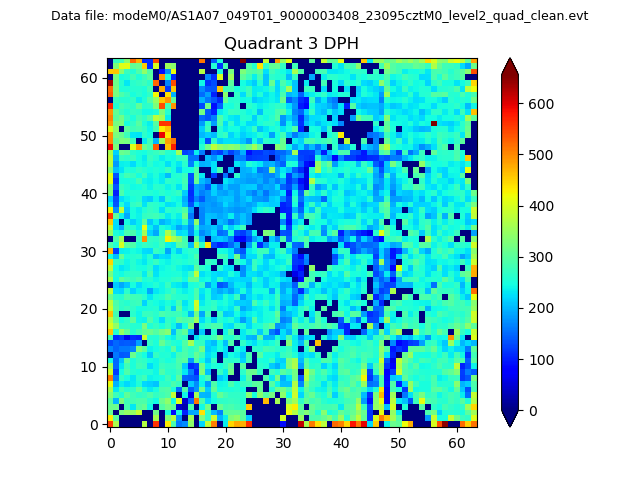 |
 |
Quadrant C |
| Plot type | Count rate plots | Images |
|---|---|---|
| Comparison with Poisson distribution Blue bars denote a histogram of data divided into 1 sec bins. Red curve is a Poisson curve with rate = median count rate of data. |
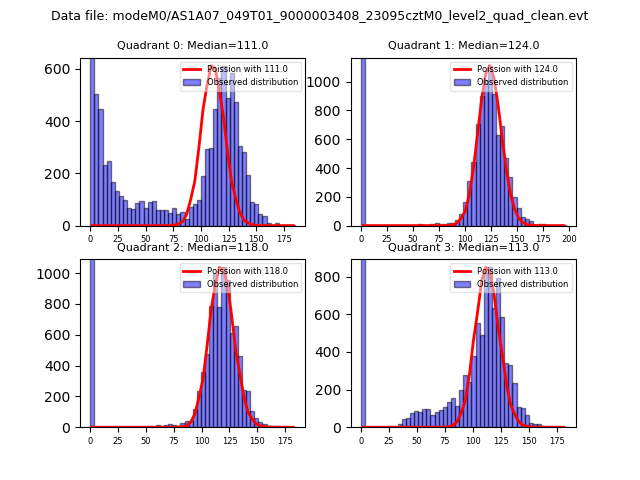 |
 |
| Quadrant-wise count rates Data is divided into 100 sec bins |
 |
|
| Module-wise count rates for Quadrant A Data is divided into 100 sec bins |
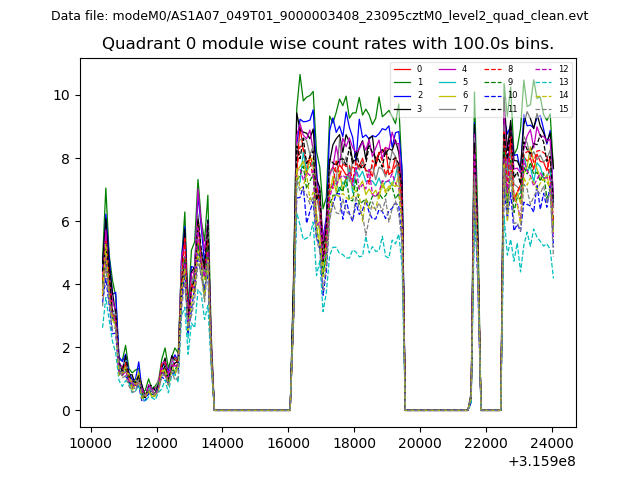 |
 |
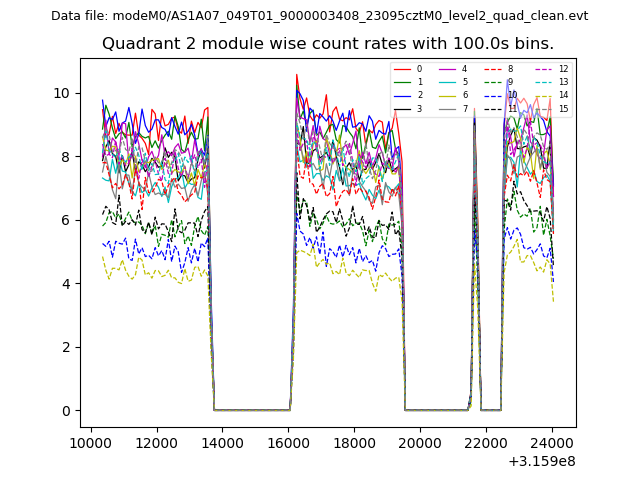
| Module-wise count rates for Quadrant B Data is divided into 100 sec bins |
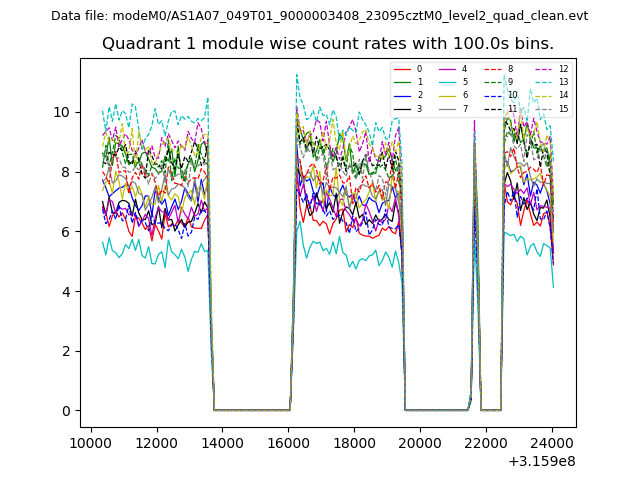 |
 |
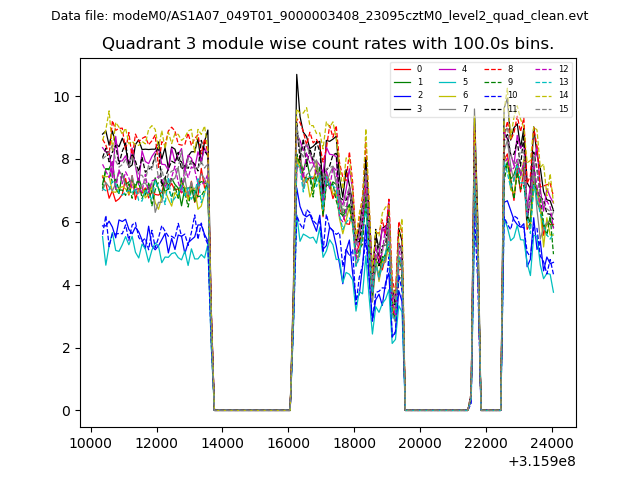
| Module-wise count rates for Quadrant C Data is divided into 100 sec bins |
 |
 |
| Module-wise count rates for Quadrant D Data is divided into 100 sec bins |
 |
 |
| Parameter | Plot |
|---|---|
| CZT HV Monitor | 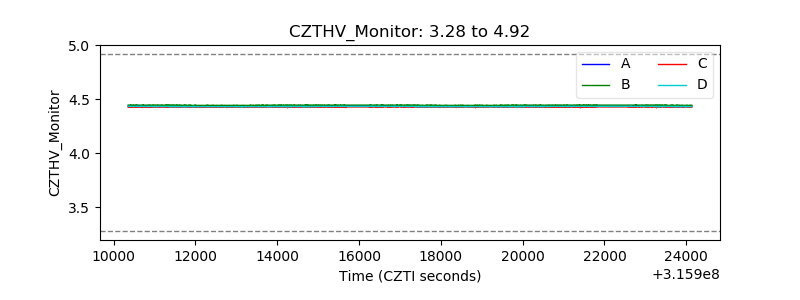 |
| D_VDD | 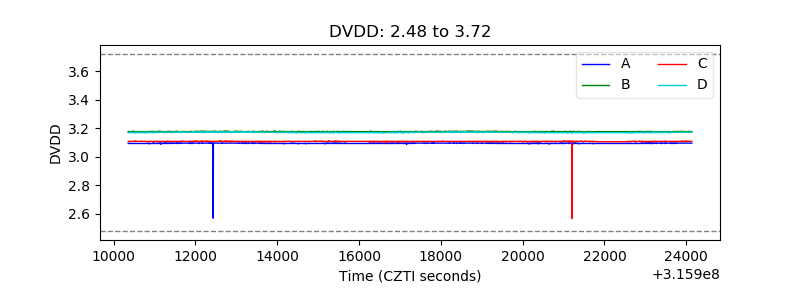 |
| Temperature 1 | 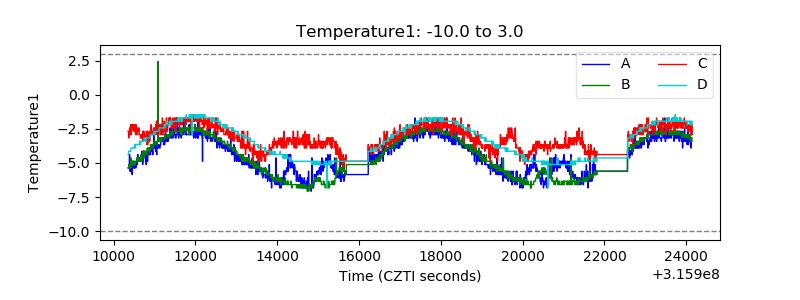 |
| Veto HV Monitor |  |
| Veto LLD | 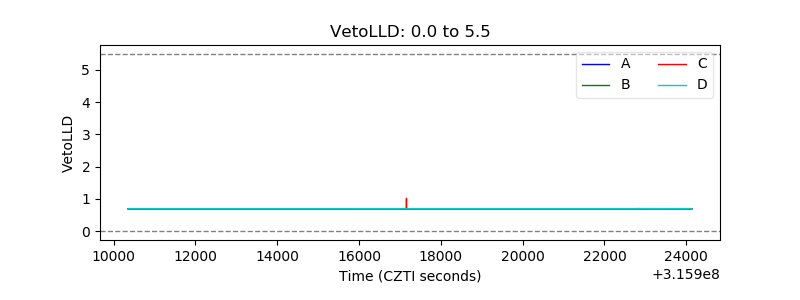 |
| Alpha Counter | 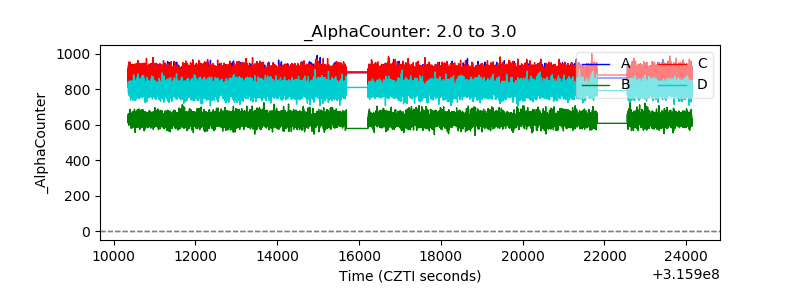 |
| _CPM_Rate | 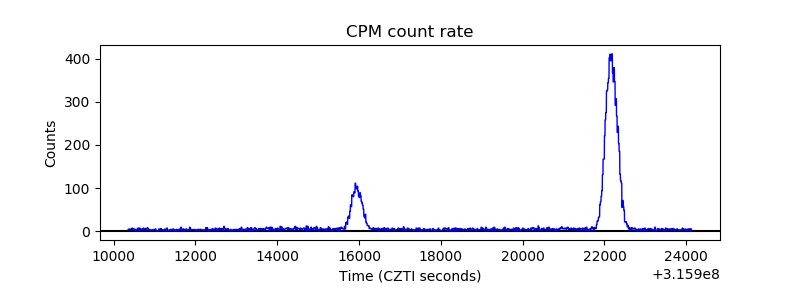 |
| CZT Counter | 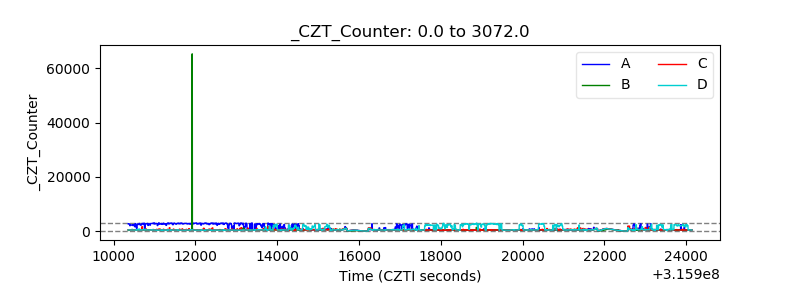 |
| +2.5 Volts monitor |  |
| +5 Volts monitor |  |
| _ROLL_ROT | 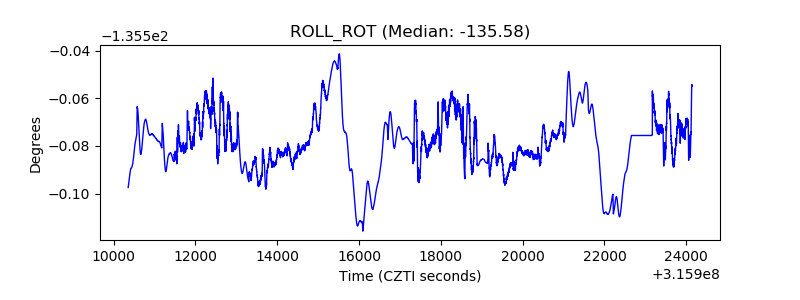 |
| _Roll_DEC | 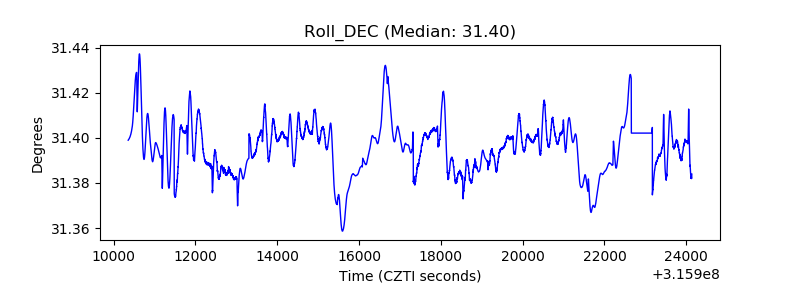 |
| _Roll_RA | 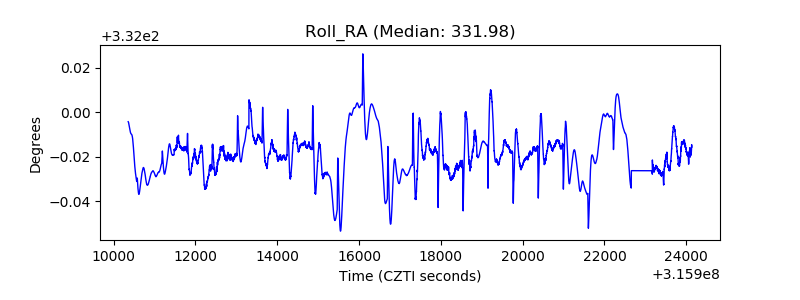 |
| Veto Counter | 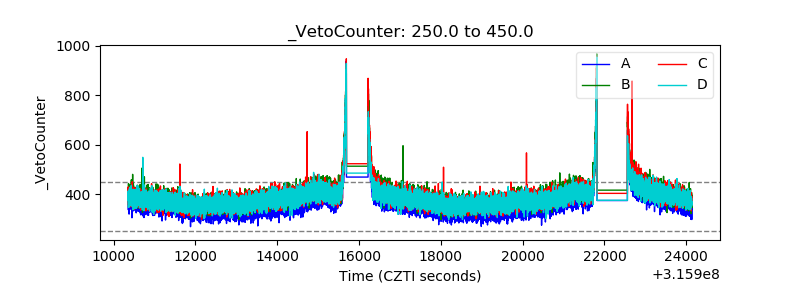 |