| Param | Original file | Final file |
|---|---|---|
| Filename | modeM0/AS1A07_049T01_9000003408_23096cztM0_level2.evt | modeM0/AS1A07_049T01_9000003408_23096cztM0_level2_quad_clean.evt |
| Size (bytes) | 584,786,880 | 84,205,440 |
| Size | 557.7 MB | 80.3 MB |
| Events in quadrant A | 4,042,181 | 533,125 |
| Events in quadrant B | 2,995,573 | 556,004 |
| Events in quadrant C | 3,183,573 | 528,950 |
| Events in quadrant D | 7,055,251 | 485,141 |
| Mode M0 | |||
|---|---|---|---|
| Quadrant | BADHDUFLAG | Total packets | Discarded packets |
| A | 0 | 16336 | 1 |
| B | 0 | 13112 | 1 |
| C | 0 | 13634 | 1 |
| D | 0 | 25337 | 1 |
| Mode M9 | |||
|---|---|---|---|
| Quadrant | BADHDUFLAG | Total packets | Discarded packets |
| A | 0 | 9 | 0 |
| B | 0 | 9 | 0 |
| C | 0 | 9 | 0 |
| D | 0 | 9 | 0 |
| Mode SS | |||
|---|---|---|---|
| Quadrant | BADHDUFLAG | Total packets | Discarded packets |
| A | 0 | 130 | 0 |
| B | 0 | 130 | 0 |
| C | 0 | 130 | 0 |
| D | 0 | 130 | 0 |
| Quadrant | Total seconds | Saturated seconds | Saturation percentage |
|---|---|---|---|
| A | 6395 | 273 | 4.268960% |
| B | 6396 | 51 | 0.797373% |
| C | 6396 | 104 | 1.626016% |
| D | 6396 | 1428 | 22.326454% |
Noise dominated data is calculated using 1-second bins in cleaned event files. If a bin has >2000 counts, and if more than 50% of those come from <1% of pixels, then it is considered to be noise-dominated and hence unusable.
| Quadrant | # 1 sec bins | Bins with >0 counts | Bins with >2000 counts | High rate bins dominated by noise | Noise dominated (total time) | Noise dominated (detector-on time) | Marked lightcurve |
|---|---|---|---|---|---|---|---|
| A | 7310 | 6396 | 155 | 155 | 2.12% | 2.42% | 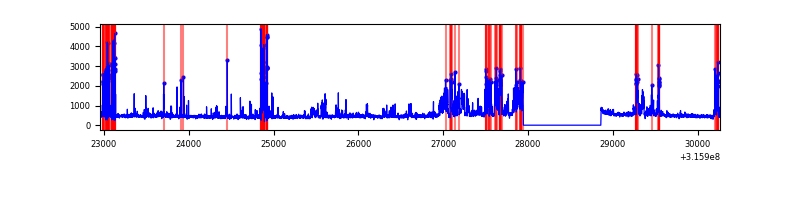 |
| B | 7311 | 6397 | 3 | 3 | 0.04% | 0.05% | 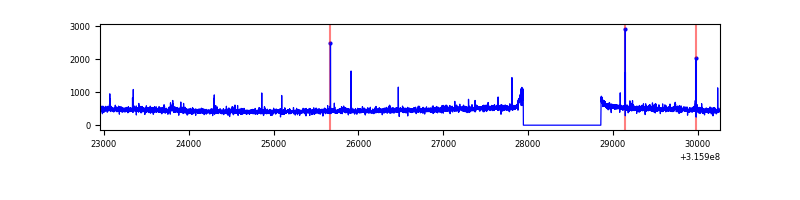 |
| C | 7311 | 6397 | 29 | 29 | 0.40% | 0.45% | 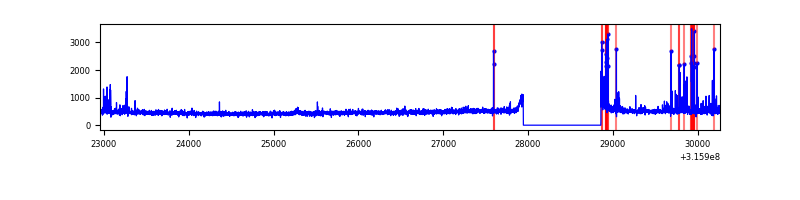 |
| D | 7310 | 6396 | 1343 | 1343 | 18.37% | 21.00% | 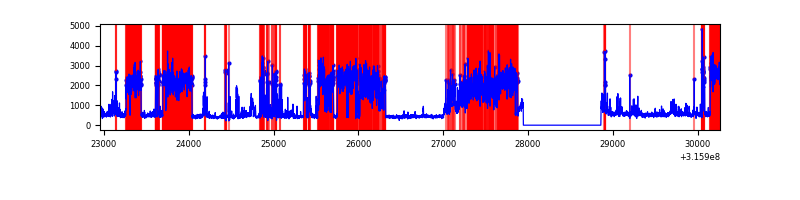 |
Top three noisy pixels from each quadrant. If the there are fewer than three noisy pixels in the level2.evt file, extra rows are filled as -1
| Pixel properties | Quadrant properties | ||||||
|---|---|---|---|---|---|---|---|
| Quadrant | DetID | PixID | Counts | Sigma | Mean | Median | Sigma |
| A | 6 | 16 | 1168892 | 7729.59 | 745 | 729 | 151.1 |
| A | 13 | 254 | 8849 | 53.73 | 745 | 729 | 151.1 |
| A | 3 | 137 | 6584 | 38.74 | 745 | 729 | 151.1 |
| B | 12 | 111 | 18119 | 119.28 | 754 | 735 | 145.7 |
| B | 11 | 111 | 15952 | 104.42 | 754 | 735 | 145.7 |
| B | 4 | 216 | 15429 | 100.83 | 754 | 735 | 145.7 |
| C | 0 | 10 | 191845 | 1117.91 | 727 | 733 | 171.0 |
| C | 14 | 238 | 114768 | 667.05 | 727 | 733 | 171.0 |
| C | 0 | 207 | 28641 | 163.25 | 727 | 733 | 171.0 |
| D | 7 | 238 | 3560766 | 20704.43 | 702 | 680 | 171.9 |
| D | 12 | 233 | 316516 | 1836.81 | 702 | 680 | 171.9 |
| D | 1 | 52 | 263447 | 1528.18 | 702 | 680 | 171.9 |
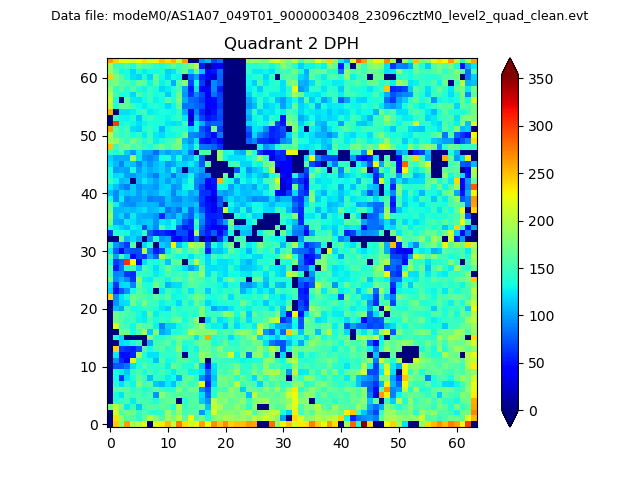
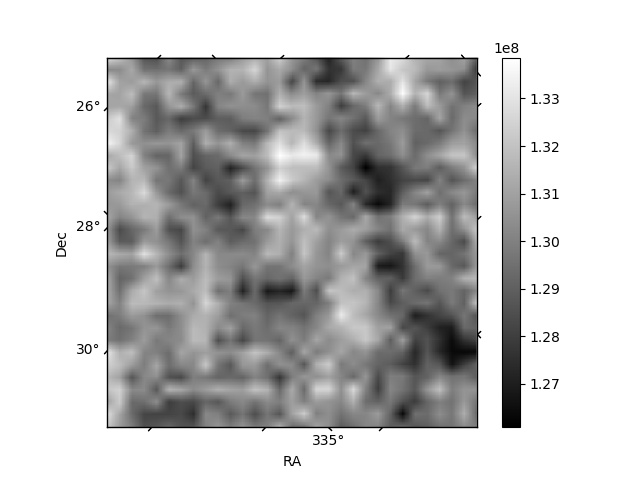
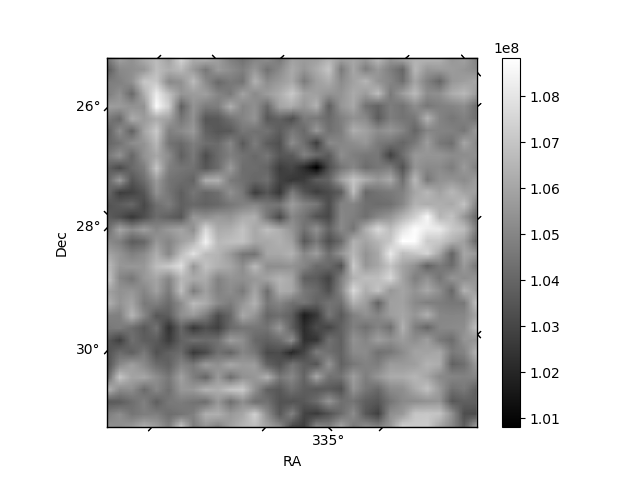
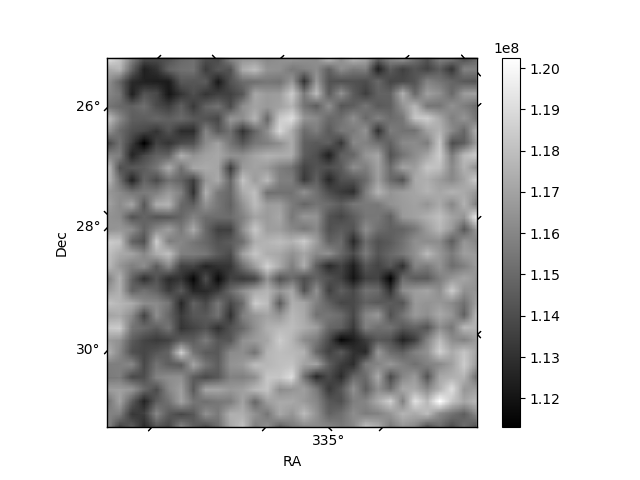
Histogram calculated using DETX and DETY for each event in the final _common_clean file
| Quadrant A | 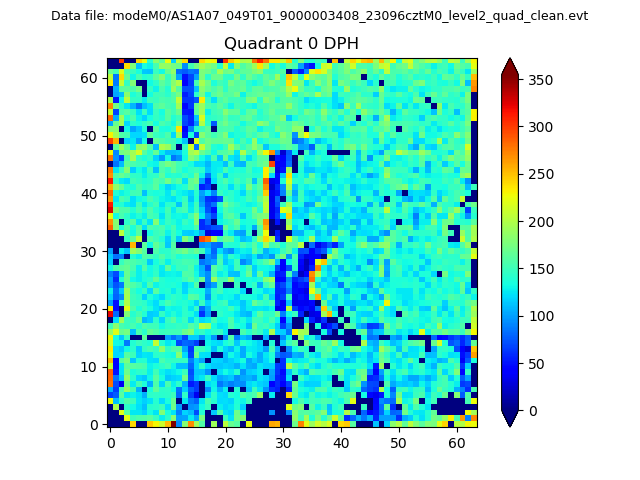 |
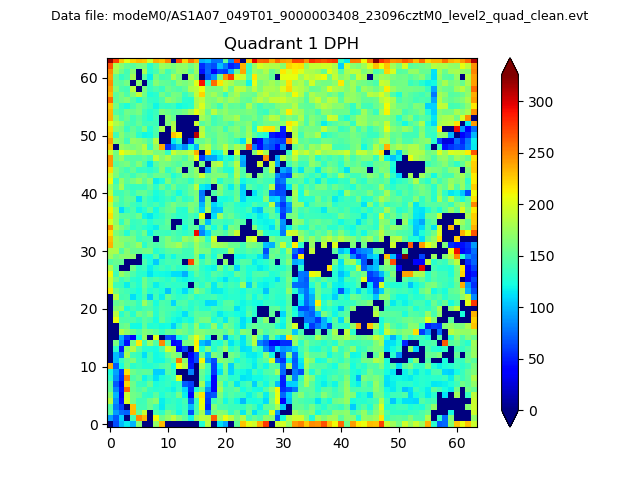 |
Quadrant B |
|---|---|---|---|
| Quadrant D | 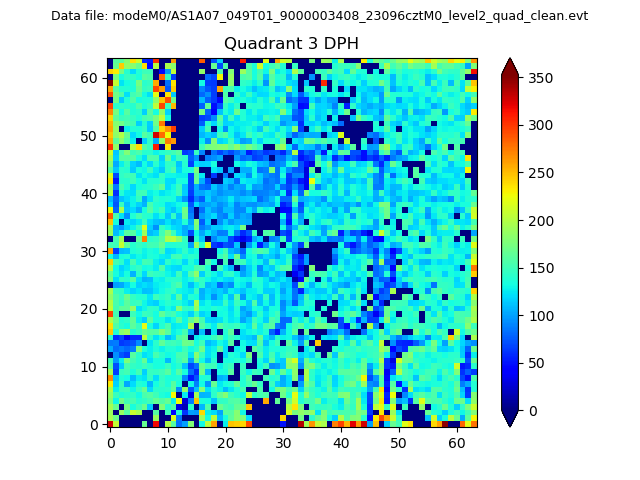 |
 |
Quadrant C |
| Plot type | Count rate plots | Images |
|---|---|---|
| Comparison with Poisson distribution Blue bars denote a histogram of data divided into 1 sec bins. Red curve is a Poisson curve with rate = median count rate of data. |
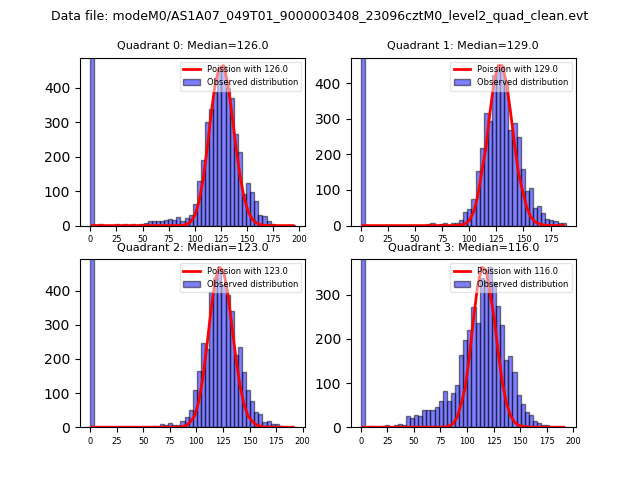 |
 |
| Quadrant-wise count rates Data is divided into 100 sec bins |
 |
|
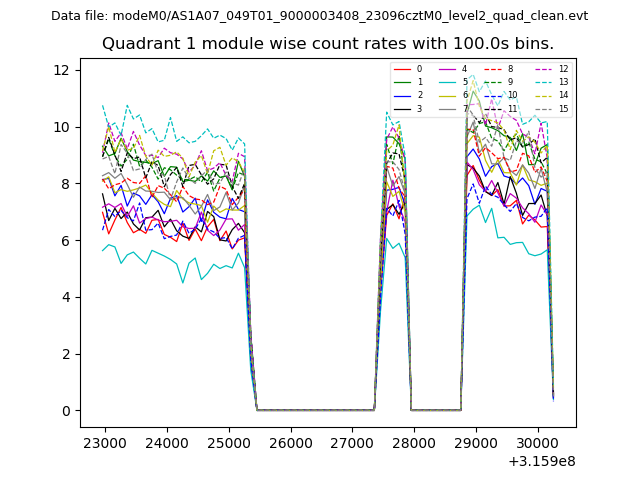
| Module-wise count rates for Quadrant A Data is divided into 100 sec bins |
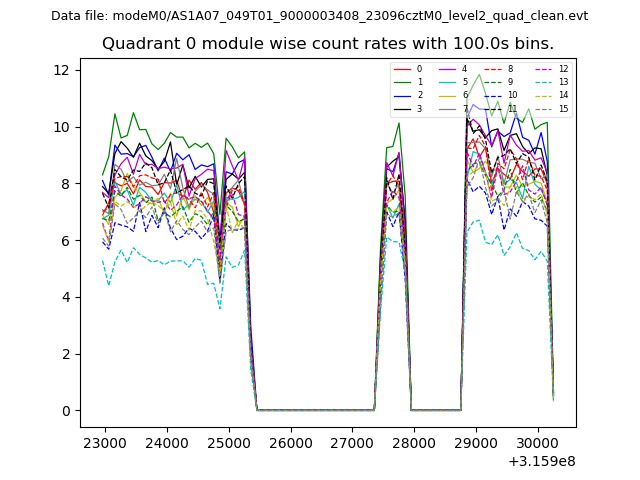 |
 |
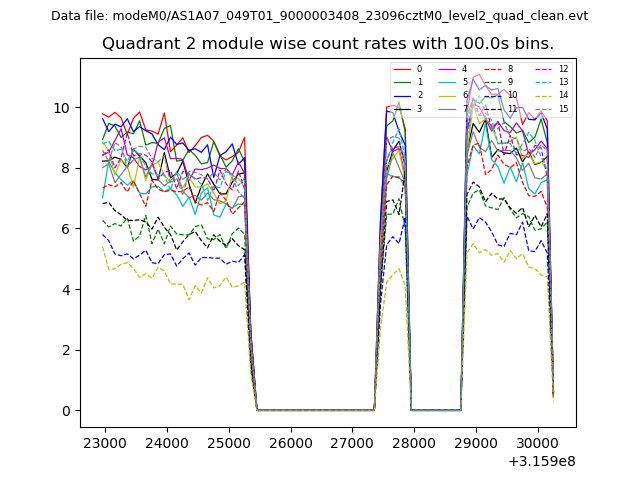
| Module-wise count rates for Quadrant B Data is divided into 100 sec bins |
 |
 |
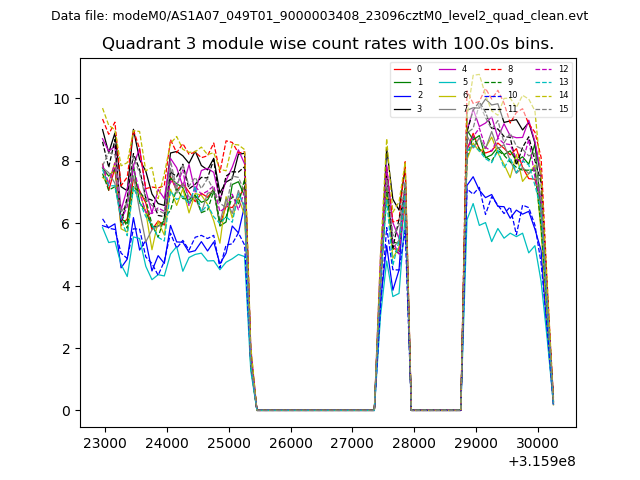
| Module-wise count rates for Quadrant C Data is divided into 100 sec bins |
 |
 |
| Module-wise count rates for Quadrant D Data is divided into 100 sec bins |
 |
 |
| Parameter | Plot |
|---|---|
| CZT HV Monitor | 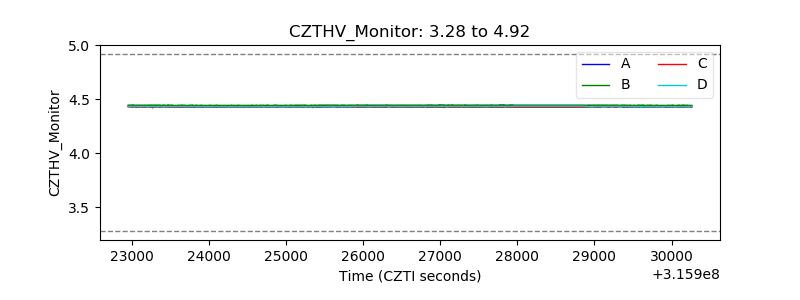 |
| D_VDD | 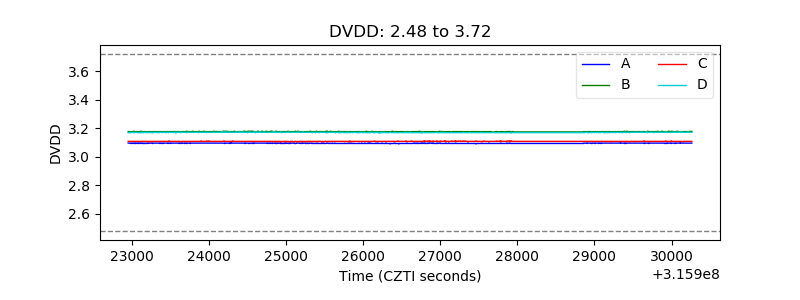 |
| Temperature 1 | 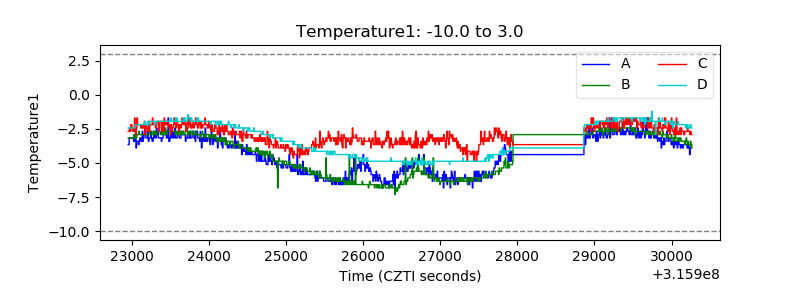 |
| Veto HV Monitor |  |
| Veto LLD | 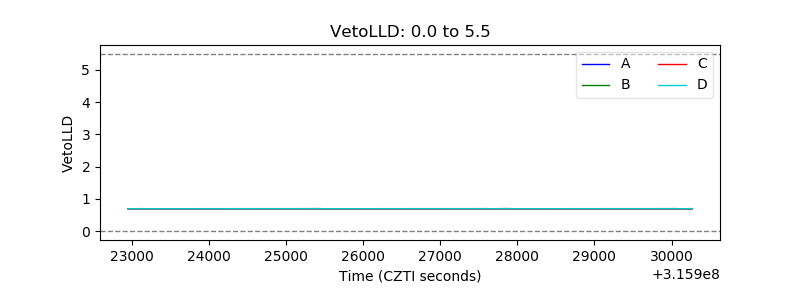 |
| Alpha Counter | 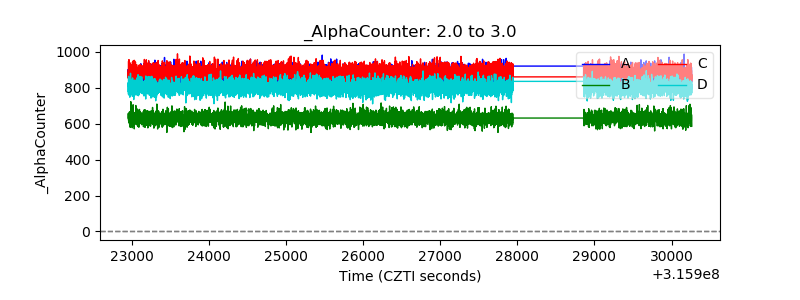 |
| _CPM_Rate | 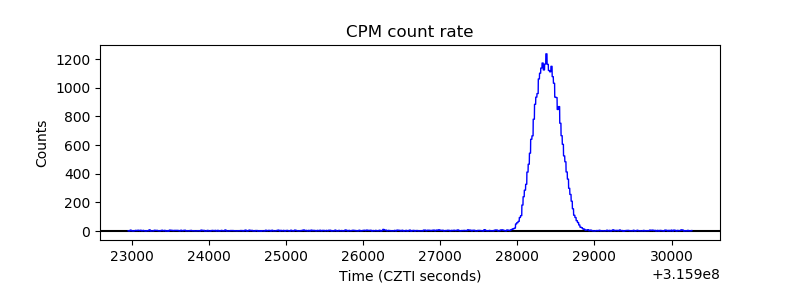 |
| CZT Counter | 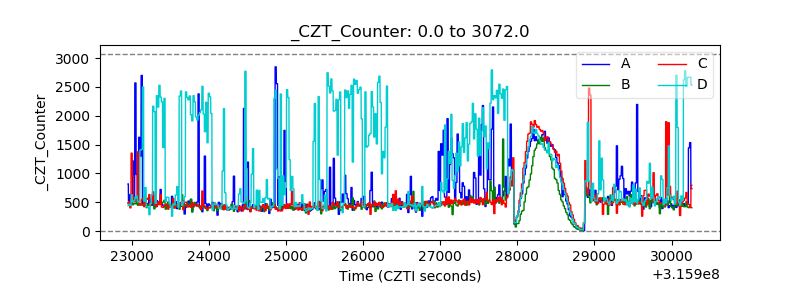 |
| +2.5 Volts monitor |  |
| +5 Volts monitor |  |
| _ROLL_ROT | 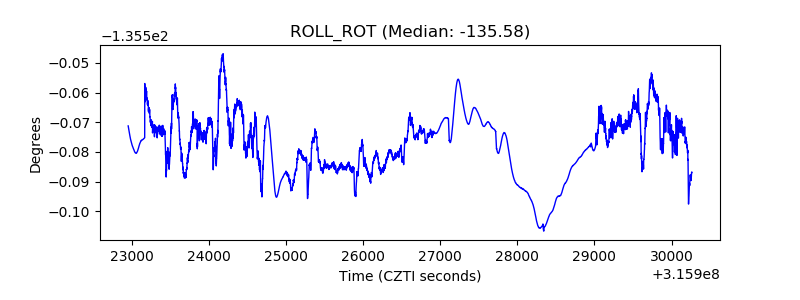 |
| _Roll_DEC | 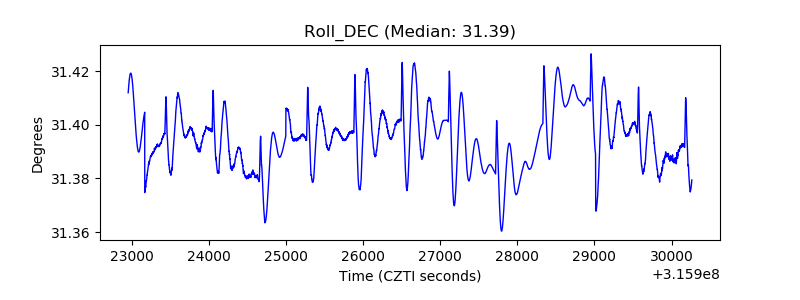 |
| _Roll_RA | 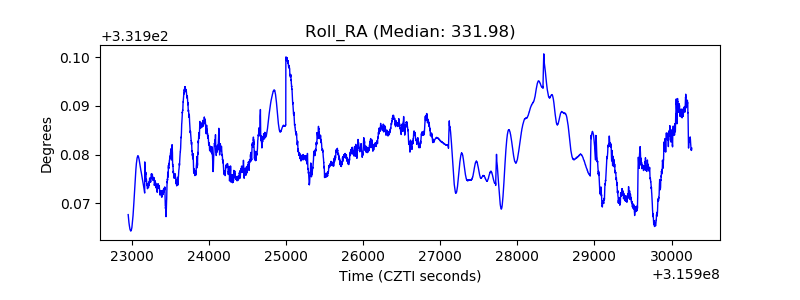 |
| Veto Counter | 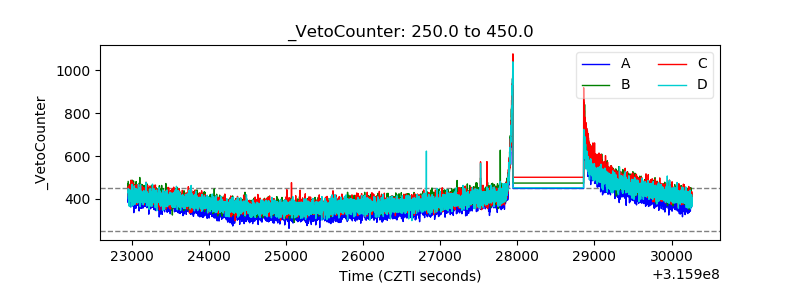 |