| Param | Original file | Final file |
|---|---|---|
| Filename | modeM0/AS1A07_049T01_9000003408_23097cztM0_level2.evt | modeM0/AS1A07_049T01_9000003408_23097cztM0_level2_quad_clean.evt |
| Size (bytes) | 528,120,000 | 78,747,840 |
| Size | 503.7 MB | 75.1 MB |
| Events in quadrant A | 3,283,731 | 513,090 |
| Events in quadrant B | 2,849,596 | 526,473 |
| Events in quadrant C | 3,581,891 | 500,392 |
| Events in quadrant D | 5,877,218 | 430,649 |
| Mode M0 | |||
|---|---|---|---|
| Quadrant | BADHDUFLAG | Total packets | Discarded packets |
| A | 0 | 13662 | 1 |
| B | 0 | 12313 | 1 |
| C | 0 | 14317 | 1 |
| D | 0 | 21400 | 1 |
| Mode M9 | |||
|---|---|---|---|
| Quadrant | BADHDUFLAG | Total packets | Discarded packets |
| A | 0 | 11 | 0 |
| B | 0 | 11 | 0 |
| C | 0 | 11 | 0 |
| D | 0 | 11 | 0 |
| Mode SS | |||
|---|---|---|---|
| Quadrant | BADHDUFLAG | Total packets | Discarded packets |
| A | 0 | 120 | 0 |
| B | 0 | 120 | 0 |
| C | 0 | 120 | 0 |
| D | 0 | 120 | 0 |
| Quadrant | Total seconds | Saturated seconds | Saturation percentage |
|---|---|---|---|
| A | 5919 | 61 | 1.030579% |
| B | 5919 | 51 | 0.861632% |
| C | 5918 | 252 | 4.258195% |
| D | 5919 | 1231 | 20.797432% |
Noise dominated data is calculated using 1-second bins in cleaned event files. If a bin has >2000 counts, and if more than 50% of those come from <1% of pixels, then it is considered to be noise-dominated and hence unusable.
| Quadrant | # 1 sec bins | Bins with >0 counts | Bins with >2000 counts | High rate bins dominated by noise | Noise dominated (total time) | Noise dominated (detector-on time) | Marked lightcurve |
|---|---|---|---|---|---|---|---|
| A | 6999 | 5920 | 30 | 30 | 0.43% | 0.51% | 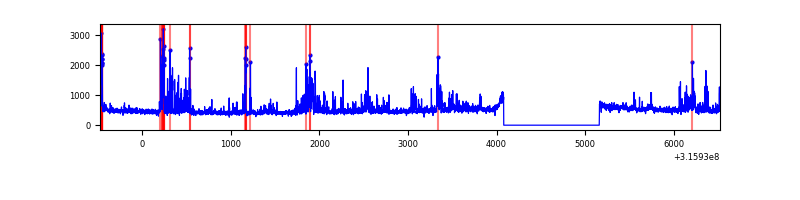 |
| B | 6999 | 5919 | 5 | 5 | 0.07% | 0.08% | 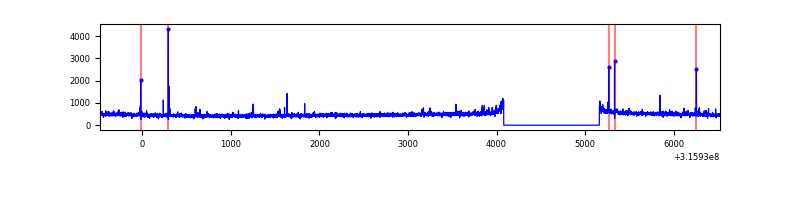 |
| C | 6998 | 5919 | 146 | 146 | 2.09% | 2.47% | 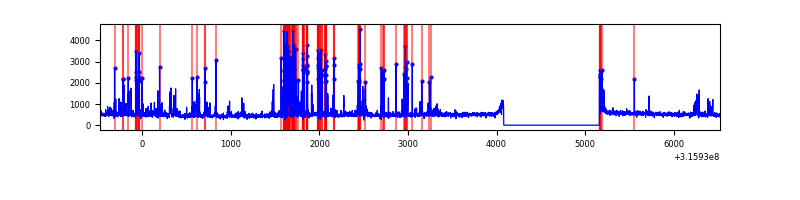 |
| D | 6999 | 5920 | 1135 | 1135 | 16.22% | 19.17% | 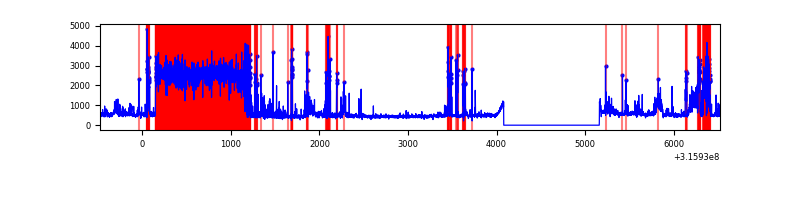 |
Top three noisy pixels from each quadrant. If the there are fewer than three noisy pixels in the level2.evt file, extra rows are filled as -1
| Pixel properties | Quadrant properties | ||||||
|---|---|---|---|---|---|---|---|
| Quadrant | DetID | PixID | Counts | Sigma | Mean | Median | Sigma |
| A | 6 | 16 | 542988 | 3796.16 | 710 | 694 | 142.9 |
| A | 13 | 254 | 8800 | 56.74 | 710 | 694 | 142.9 |
| A | 3 | 137 | 6175 | 38.37 | 710 | 694 | 142.9 |
| B | 0 | 190 | 22435 | 163.02 | 708 | 692 | 133.4 |
| B | 4 | 216 | 21721 | 157.67 | 708 | 692 | 133.4 |
| B | 12 | 111 | 16356 | 117.44 | 708 | 692 | 133.4 |
| C | 0 | 10 | 740293 | 4654.11 | 681 | 686 | 158.9 |
| C | 14 | 238 | 107215 | 670.35 | 681 | 686 | 158.9 |
| C | 0 | 207 | 45655 | 282.98 | 681 | 686 | 158.9 |
| D | 7 | 238 | 1937527 | 12174.95 | 653 | 632 | 159.1 |
| D | 12 | 233 | 523351 | 3285.71 | 653 | 632 | 159.1 |
| D | 1 | 52 | 321943 | 2019.7 | 653 | 632 | 159.1 |
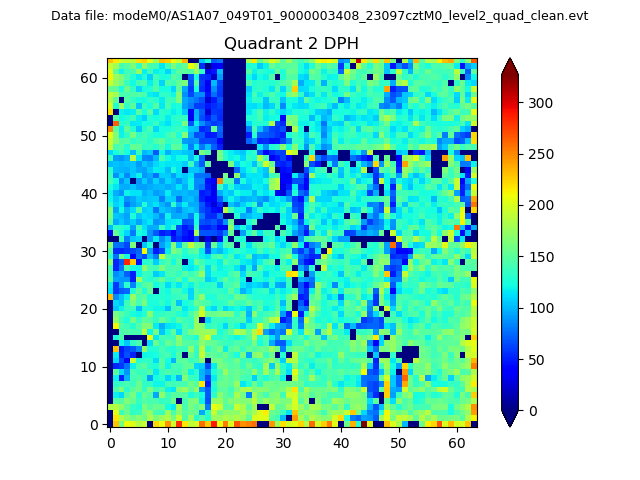
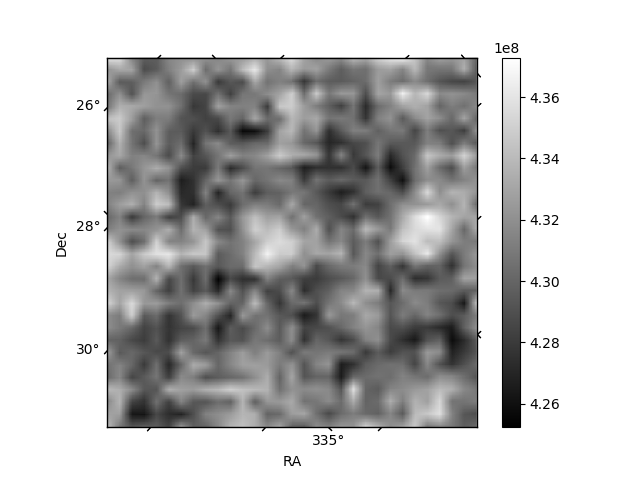
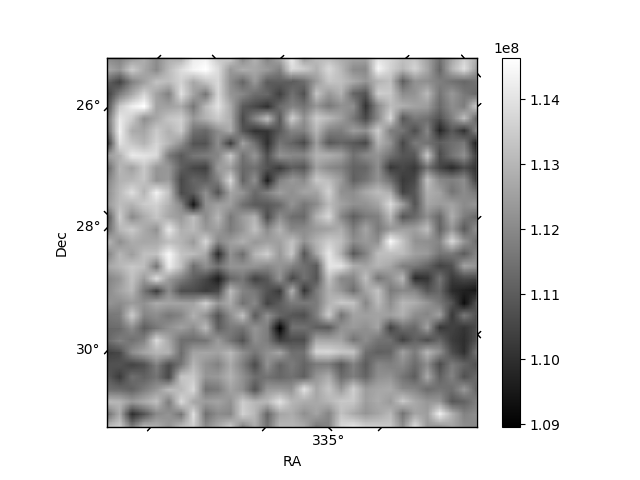
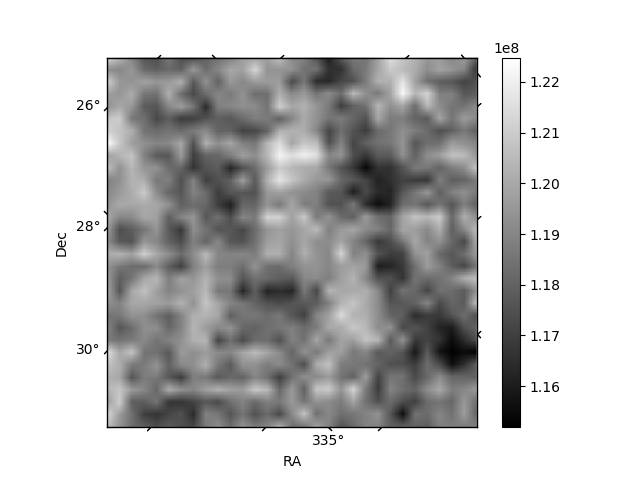
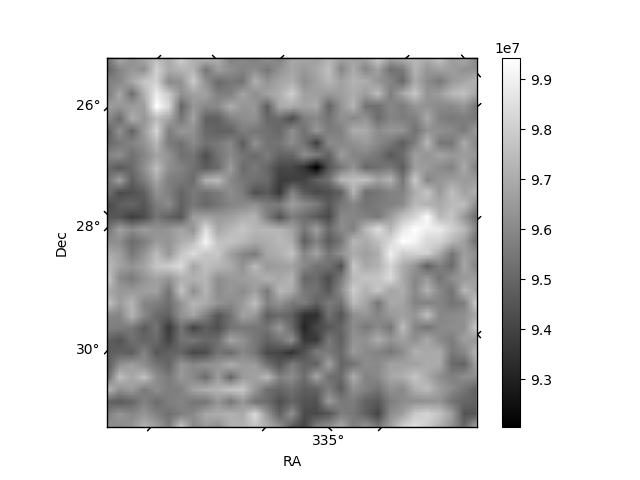
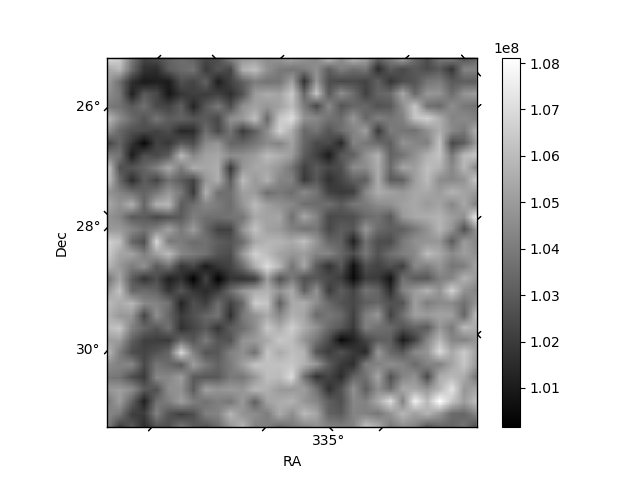
Histogram calculated using DETX and DETY for each event in the final _common_clean file
| Quadrant A | 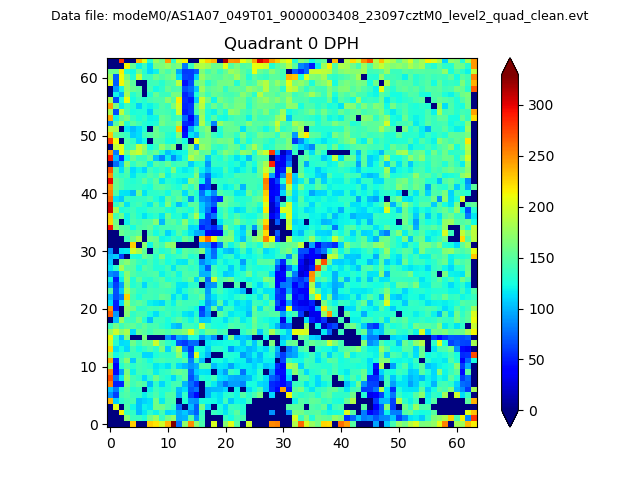 |
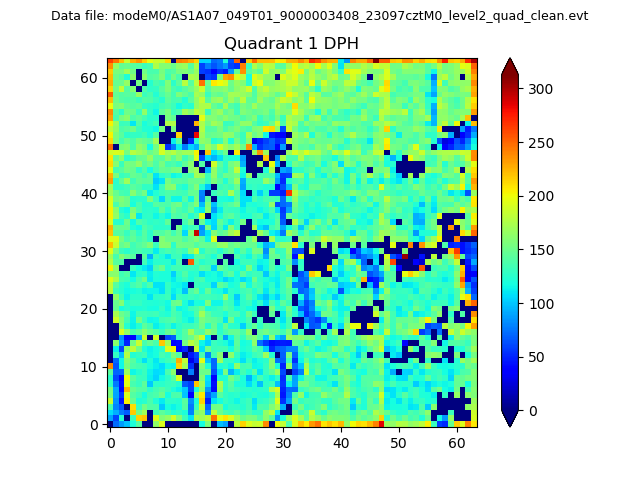 |
Quadrant B |
|---|---|---|---|
| Quadrant D | 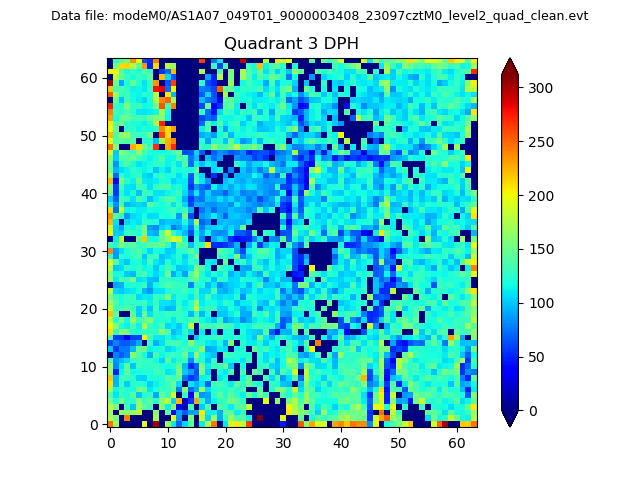 |
 |
Quadrant C |
| Plot type | Count rate plots | Images |
|---|---|---|
| Comparison with Poisson distribution Blue bars denote a histogram of data divided into 1 sec bins. Red curve is a Poisson curve with rate = median count rate of data. |
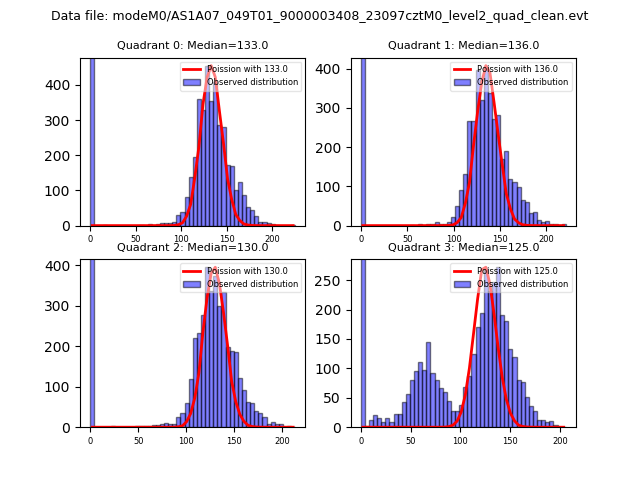 |
 |
| Quadrant-wise count rates Data is divided into 100 sec bins |
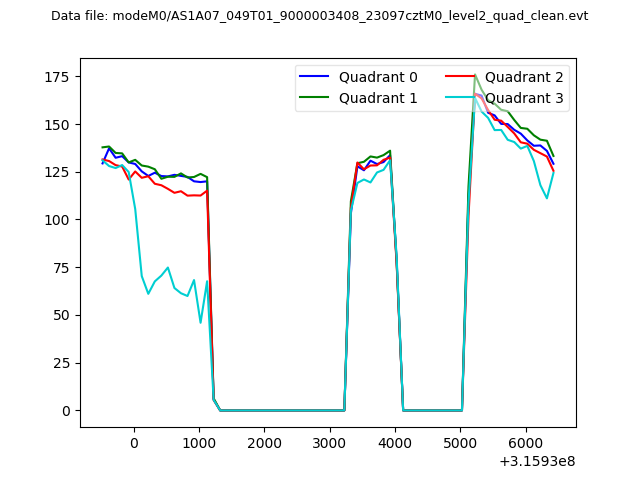 |
|
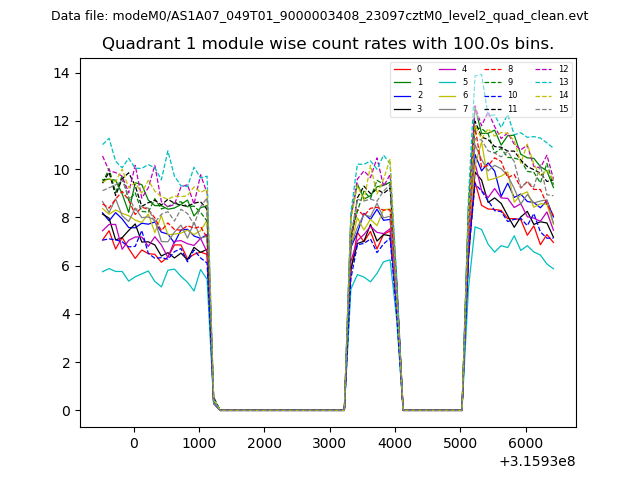
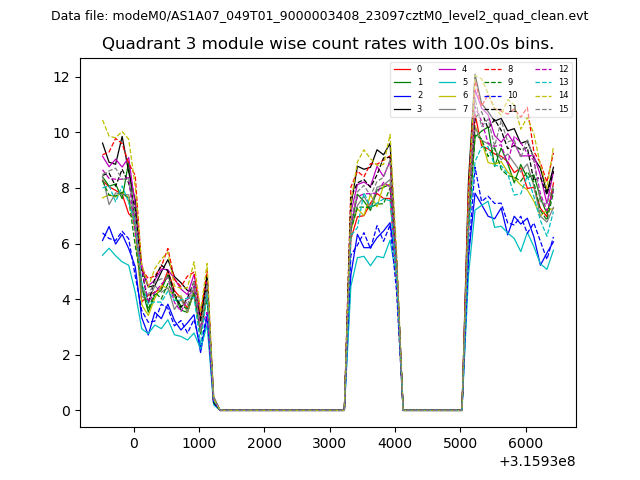
| Module-wise count rates for Quadrant A Data is divided into 100 sec bins |
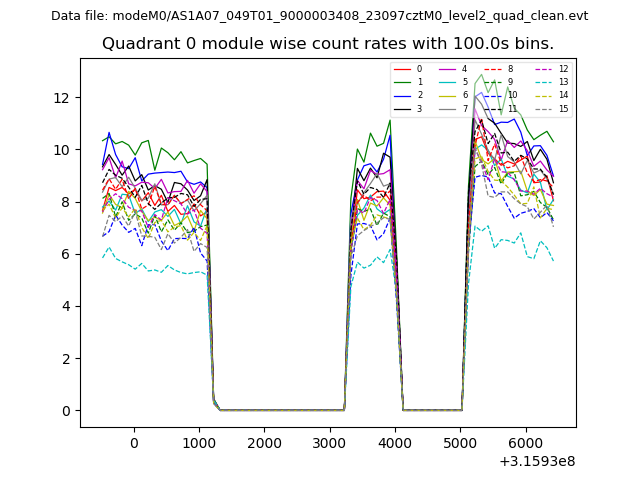 |
 |
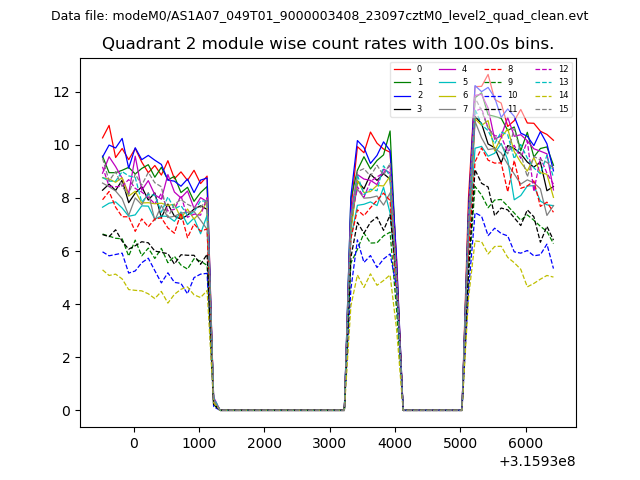
| Module-wise count rates for Quadrant B Data is divided into 100 sec bins |
 |
 |
| Module-wise count rates for Quadrant C Data is divided into 100 sec bins |
 |
 |
| Module-wise count rates for Quadrant D Data is divided into 100 sec bins |
 |
 |
| Parameter | Plot |
|---|---|
| CZT HV Monitor | 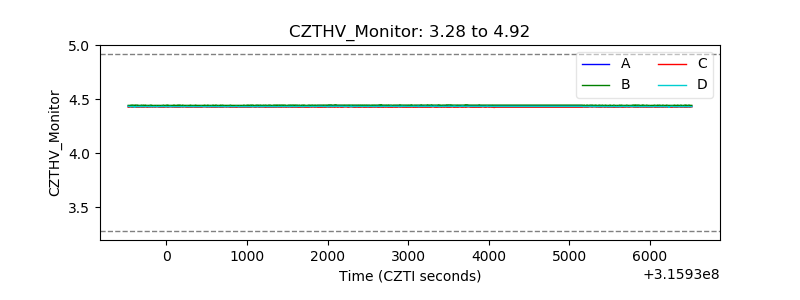 |
| D_VDD | 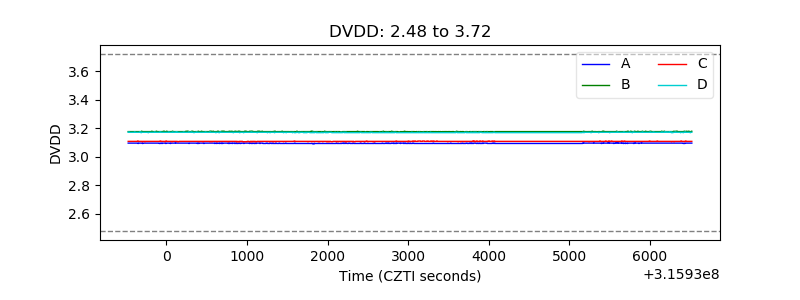 |
| Temperature 1 | 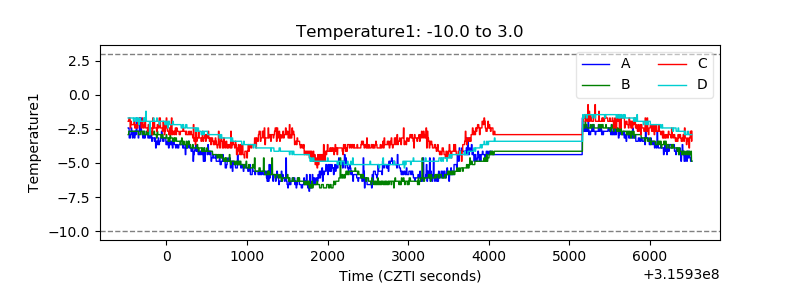 |
| Veto HV Monitor | 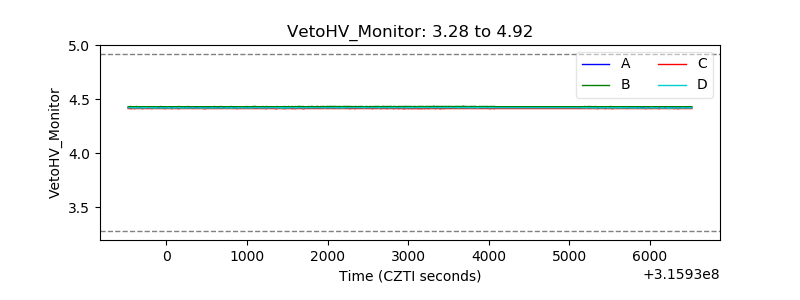 |
| Veto LLD | 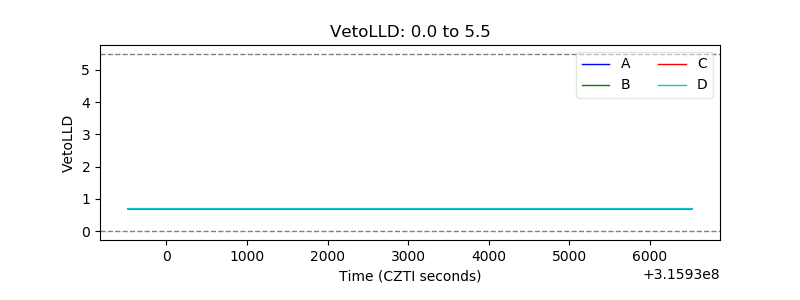 |
| Alpha Counter | 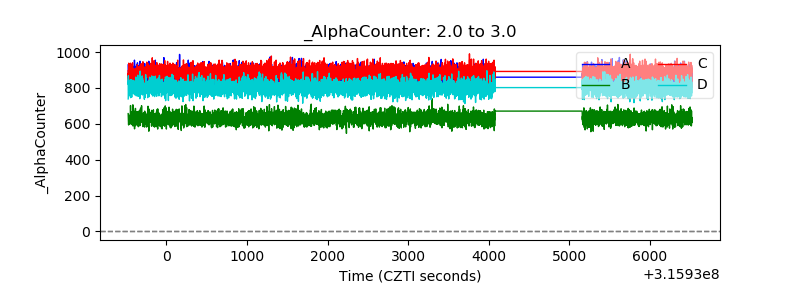 |
| _CPM_Rate | 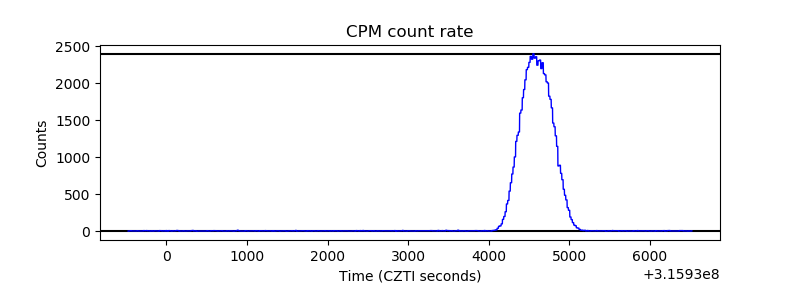 |
| CZT Counter | 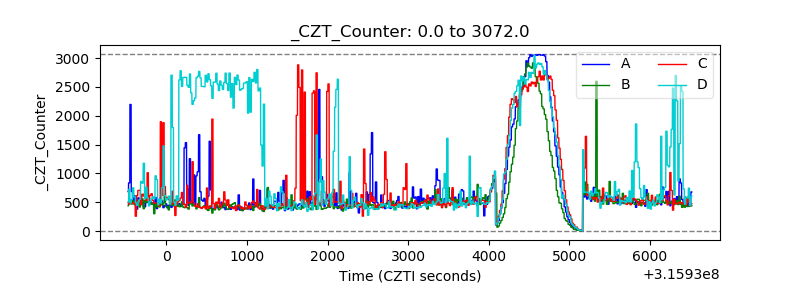 |
| +2.5 Volts monitor | 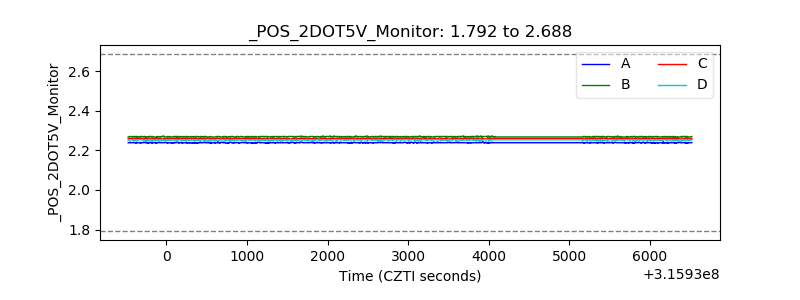 |
| +5 Volts monitor | 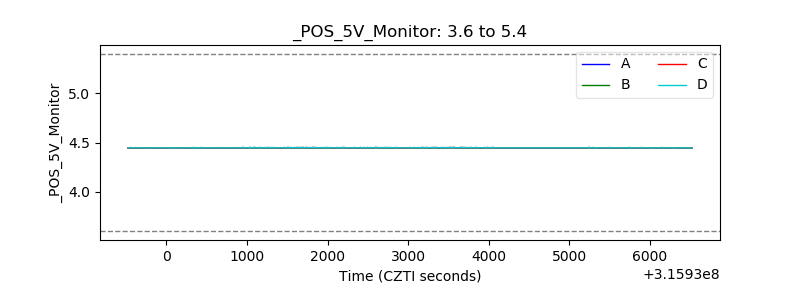 |
| _ROLL_ROT | 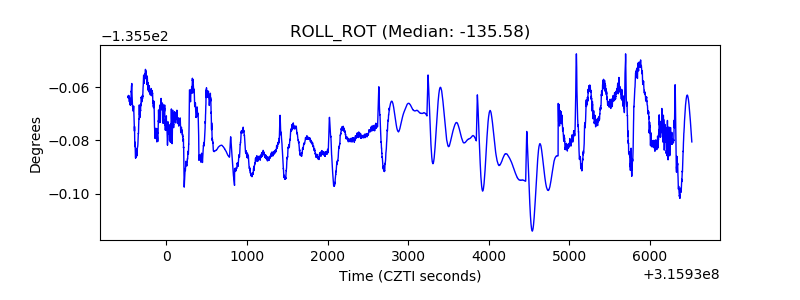 |
| _Roll_DEC |  |
| _Roll_RA | 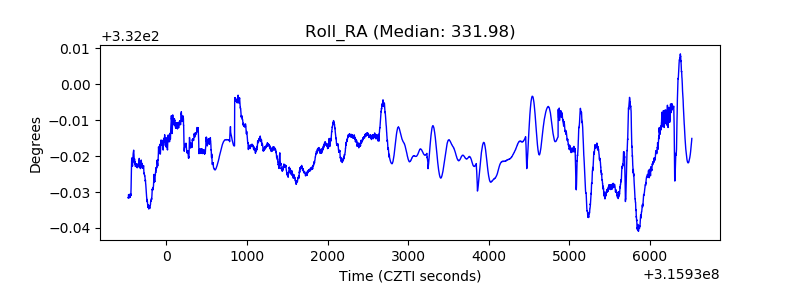 |
| Veto Counter | 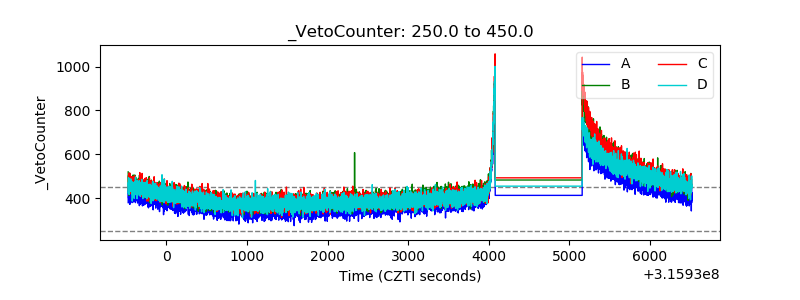 |