| Param | Original file | Final file |
|---|---|---|
| Filename | modeM0/AS1A07_049T01_9000003408_23099cztM0_level2.evt | modeM0/AS1A07_049T01_9000003408_23099cztM0_level2_quad_clean.evt |
| Size (bytes) | 595,604,160 | 84,703,680 |
| Size | 568.0 MB | 80.8 MB |
| Events in quadrant A | 3,138,194 | 568,435 |
| Events in quadrant B | 2,984,909 | 589,466 |
| Events in quadrant C | 3,486,026 | 562,418 |
| Events in quadrant D | 8,021,061 | 423,894 |
| Mode M0 | |||
|---|---|---|---|
| Quadrant | BADHDUFLAG | Total packets | Discarded packets |
| A | 0 | 13082 | 2 |
| B | 0 | 12632 | 1 |
| C | 0 | 14101 | 1 |
| D | 0 | 27911 | 1 |
| Mode M9 | |||
|---|---|---|---|
| Quadrant | BADHDUFLAG | Total packets | Discarded packets |
| A | 0 | 12 | 0 |
| B | 0 | 12 | 0 |
| C | 0 | 12 | 0 |
| D | 0 | 12 | 0 |
| Mode SS | |||
|---|---|---|---|
| Quadrant | BADHDUFLAG | Total packets | Discarded packets |
| A | 0 | 122 | 0 |
| B | 0 | 122 | 0 |
| C | 0 | 122 | 0 |
| D | 0 | 122 | 0 |
| Quadrant | Total seconds | Saturated seconds | Saturation percentage |
|---|---|---|---|
| A | 6016 | 27 | 0.448803% |
| B | 6017 | 47 | 0.781120% |
| C | 6017 | 190 | 3.157720% |
| D | 6017 | 1864 | 30.978893% |
Noise dominated data is calculated using 1-second bins in cleaned event files. If a bin has >2000 counts, and if more than 50% of those come from <1% of pixels, then it is considered to be noise-dominated and hence unusable.
| Quadrant | # 1 sec bins | Bins with >0 counts | Bins with >2000 counts | High rate bins dominated by noise | Noise dominated (total time) | Noise dominated (detector-on time) | Marked lightcurve |
|---|---|---|---|---|---|---|---|
| A | 7231 | 6017 | 5 | 5 | 0.07% | 0.08% | 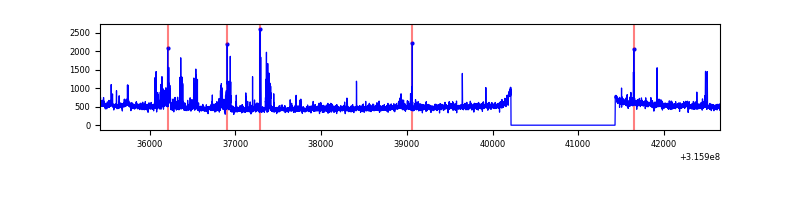 |
| B | 7232 | 6018 | 3 | 3 | 0.04% | 0.05% | 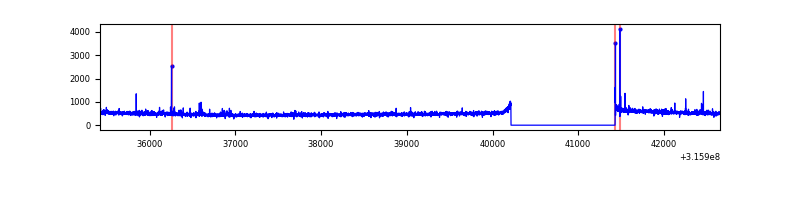 |
| C | 7232 | 6018 | 77 | 77 | 1.06% | 1.28% | 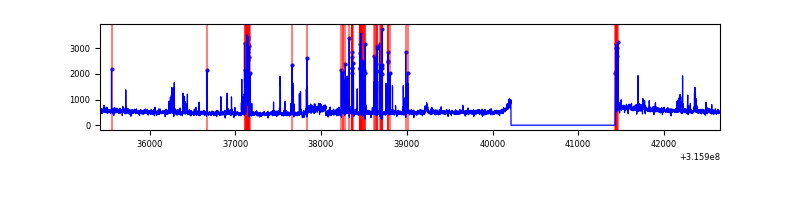 |
| D | 7232 | 6017 | 1723 | 1723 | 23.82% | 28.64% | 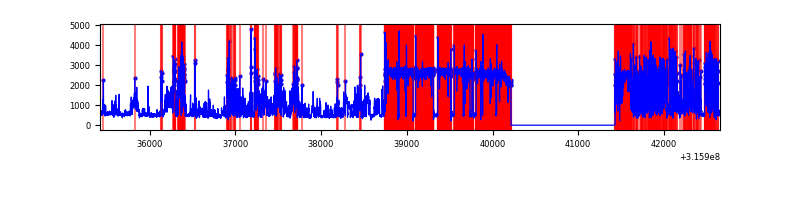 |
Top three noisy pixels from each quadrant. If the there are fewer than three noisy pixels in the level2.evt file, extra rows are filled as -1
| Pixel properties | Quadrant properties | ||||||
|---|---|---|---|---|---|---|---|
| Quadrant | DetID | PixID | Counts | Sigma | Mean | Median | Sigma |
| A | 6 | 16 | 233782 | 1556.72 | 751 | 736 | 149.7 |
| A | 13 | 254 | 9378 | 57.73 | 751 | 736 | 149.7 |
| A | 3 | 137 | 6415 | 37.94 | 751 | 736 | 149.7 |
| B | 4 | 216 | 19432 | 132.49 | 753 | 736 | 141.1 |
| B | 0 | 190 | 16713 | 113.22 | 753 | 736 | 141.1 |
| B | 12 | 111 | 16636 | 112.67 | 753 | 736 | 141.1 |
| C | 0 | 207 | 435486 | 2558.4 | 729 | 734 | 169.9 |
| C | 14 | 238 | 114836 | 671.46 | 729 | 734 | 169.9 |
| C | 0 | 10 | 44663 | 258.51 | 729 | 734 | 169.9 |
| D | 1 | 52 | 4773273 | 32071.62 | 610 | 592 | 148.8 |
| D | 13 | 172 | 362180 | 2429.81 | 610 | 592 | 148.8 |
| D | 12 | 233 | 275207 | 1845.37 | 610 | 592 | 148.8 |
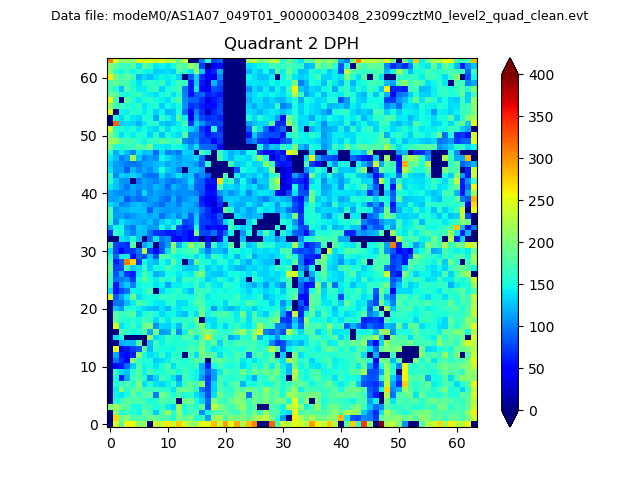
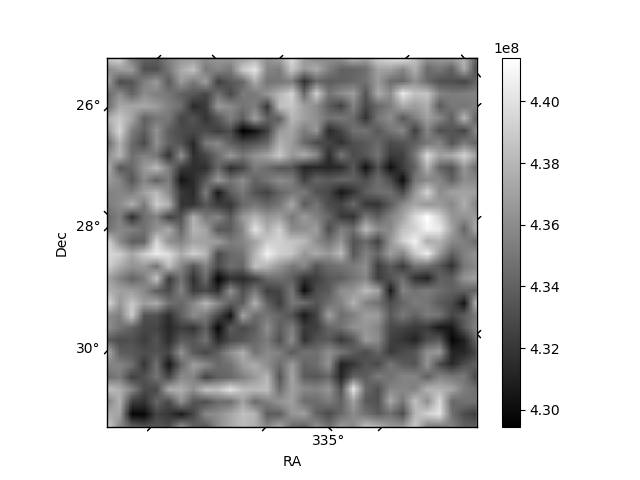
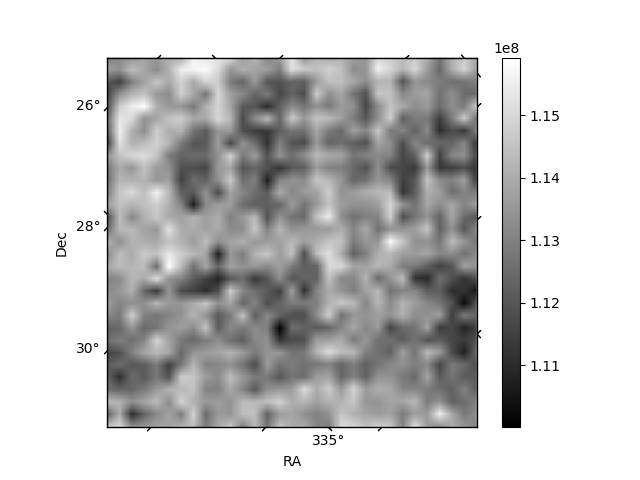
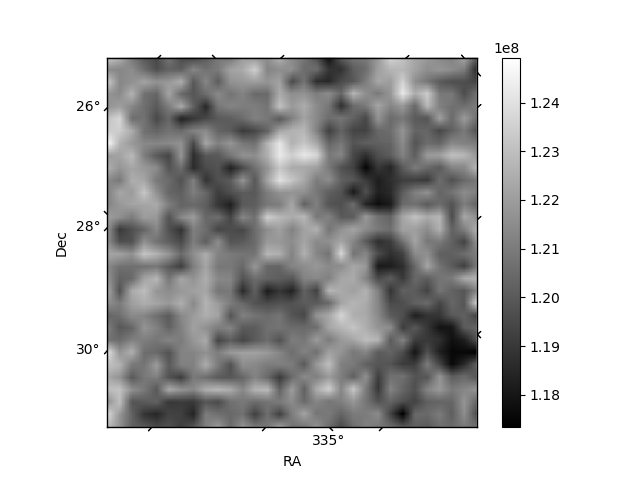
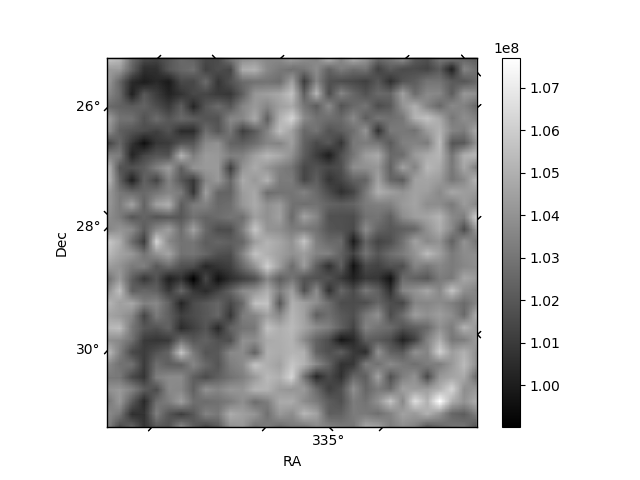
Histogram calculated using DETX and DETY for each event in the final _common_clean file
| Quadrant A | 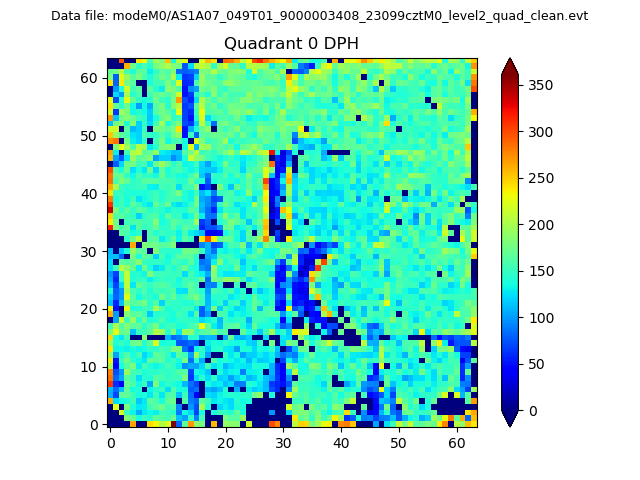 |
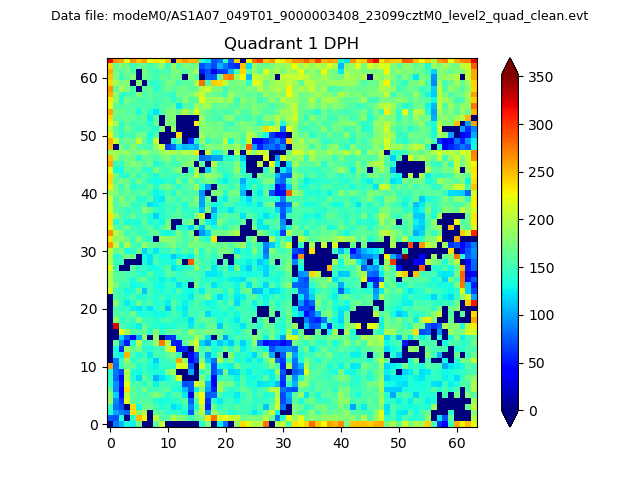 |
Quadrant B |
|---|---|---|---|
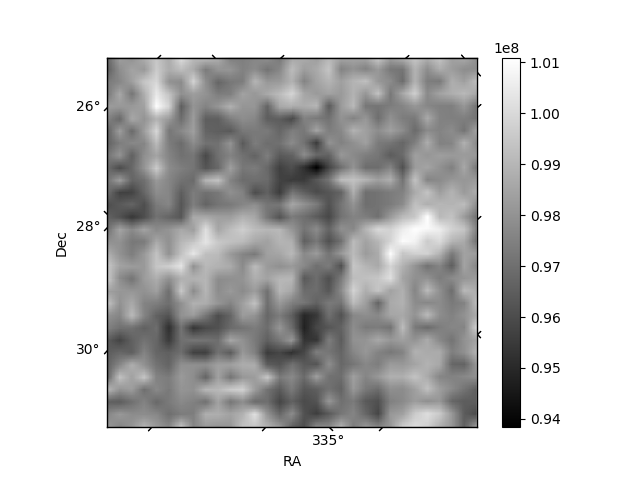
| Quadrant D | 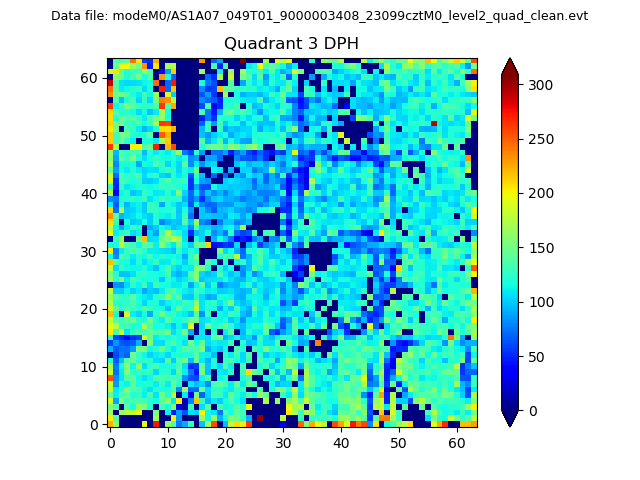 |
 |
Quadrant C |
| Plot type | Count rate plots | Images |
|---|---|---|
| Comparison with Poisson distribution Blue bars denote a histogram of data divided into 1 sec bins. Red curve is a Poisson curve with rate = median count rate of data. |
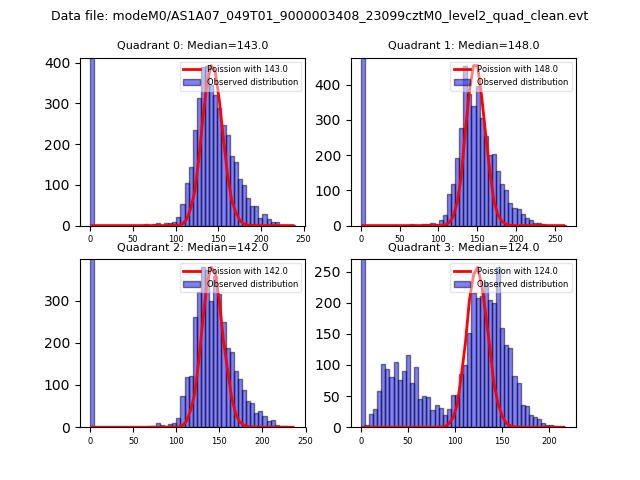 |
 |
| Quadrant-wise count rates Data is divided into 100 sec bins |
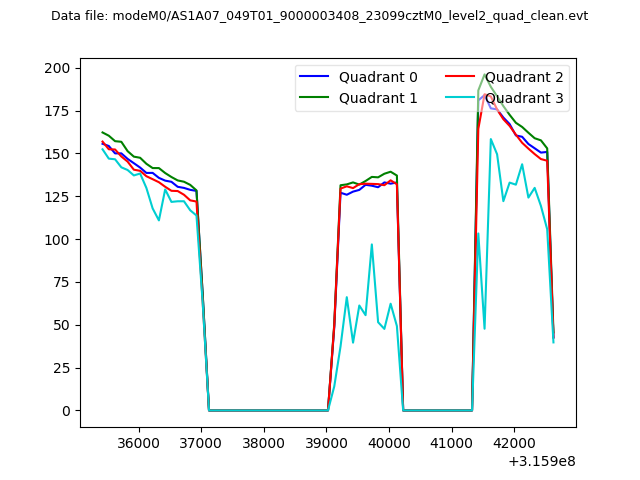 |
|
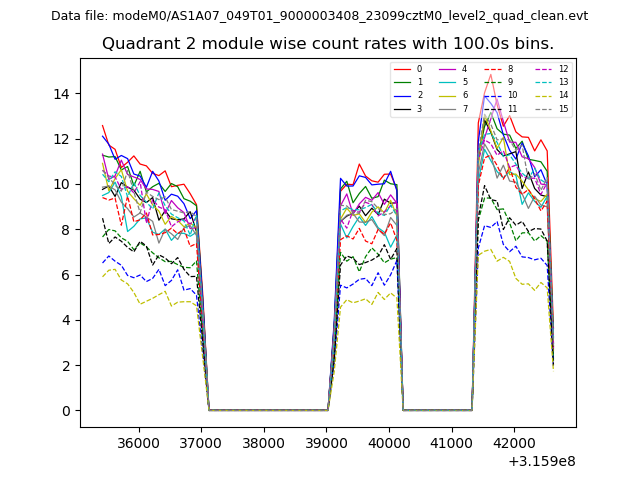
| Module-wise count rates for Quadrant A Data is divided into 100 sec bins |
 |
 |
| Module-wise count rates for Quadrant B Data is divided into 100 sec bins |
 |
 |
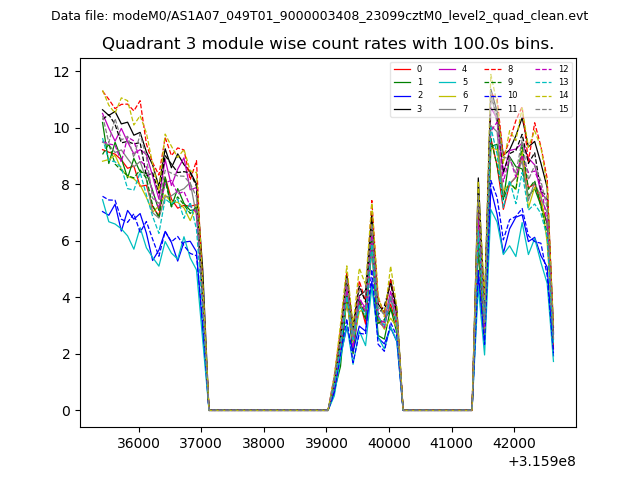
| Module-wise count rates for Quadrant C Data is divided into 100 sec bins |
 |
 |
| Module-wise count rates for Quadrant D Data is divided into 100 sec bins |
 |
 |
| Parameter | Plot |
|---|---|
| CZT HV Monitor |  |
| D_VDD | 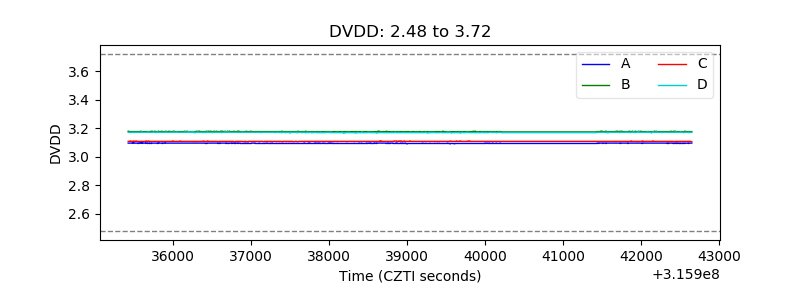 |
| Temperature 1 | 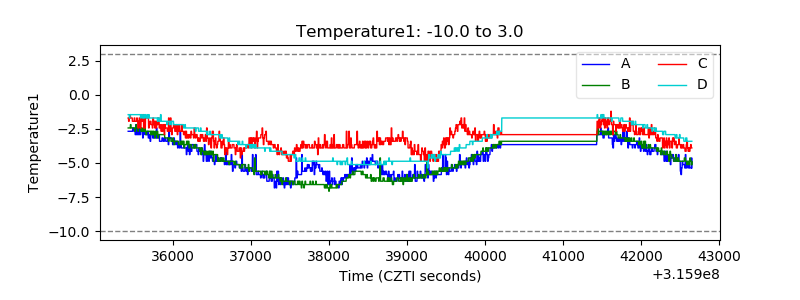 |
| Veto HV Monitor |  |
| Veto LLD |  |
| Alpha Counter | 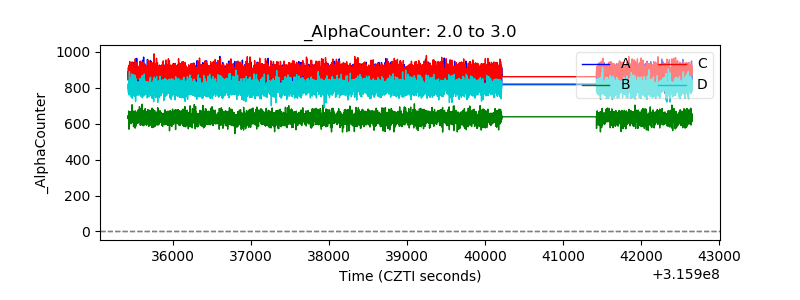 |
| _CPM_Rate | 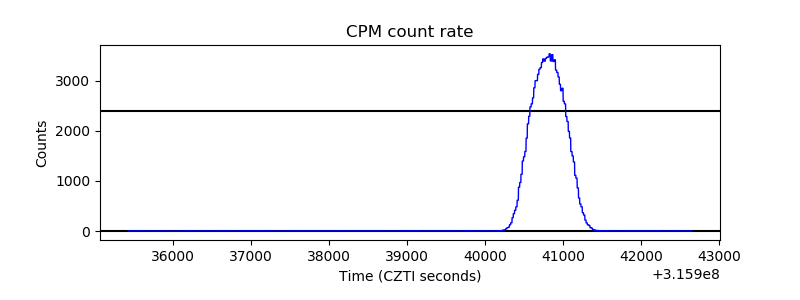 |
| CZT Counter | 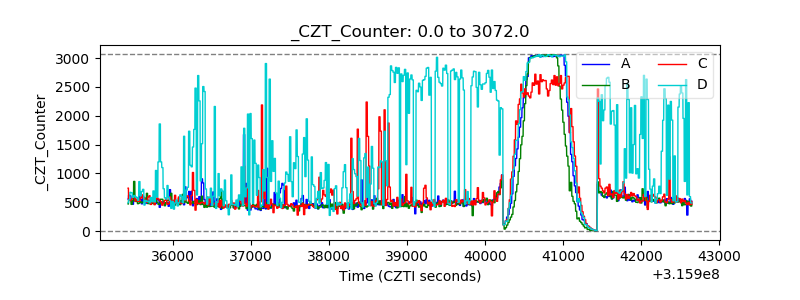 |
| +2.5 Volts monitor | 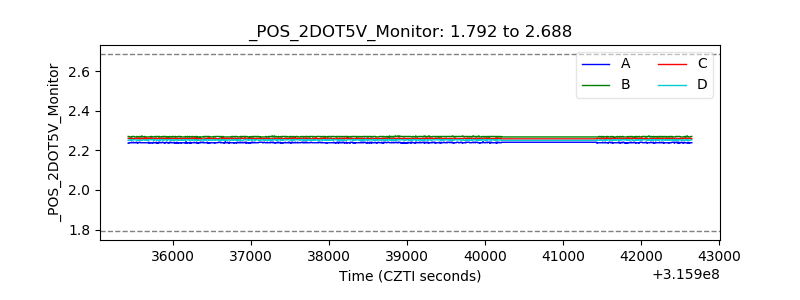 |
| +5 Volts monitor |  |
| _ROLL_ROT |  |
| _Roll_DEC | 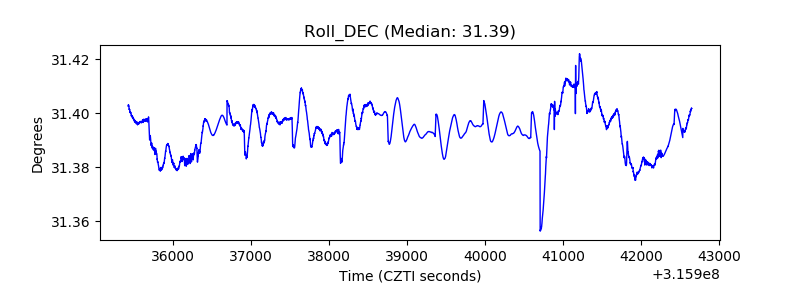 |
| _Roll_RA | 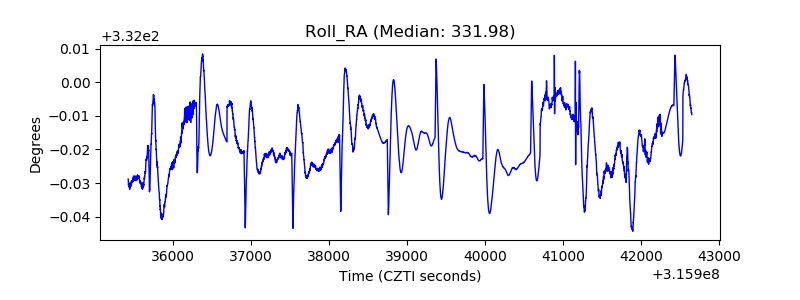 |
| Veto Counter |  |