| Param | Original file | Final file |
|---|---|---|
| Filename | modeM0/AS1A07_049T01_9000003408_23101cztM0_level2.evt | modeM0/AS1A07_049T01_9000003408_23101cztM0_level2_quad_clean.evt |
| Size (bytes) | 570,234,240 | 87,324,480 |
| Size | 543.8 MB | 83.3 MB |
| Events in quadrant A | 3,061,815 | 572,846 |
| Events in quadrant B | 3,002,300 | 597,574 |
| Events in quadrant C | 3,216,704 | 569,430 |
| Events in quadrant D | 7,597,457 | 500,862 |
| Mode M0 | |||
|---|---|---|---|
| Quadrant | BADHDUFLAG | Total packets | Discarded packets |
| A | 0 | 12829 | 2 |
| B | 0 | 12515 | 2 |
| C | 0 | 13174 | 2 |
| D | 0 | 26547 | 2 |
| Mode M9 | |||
|---|---|---|---|
| Quadrant | BADHDUFLAG | Total packets | Discarded packets |
| A | 0 | 14 | 0 |
| B | 0 | 15 | 0 |
| C | 0 | 15 | 0 |
| D | 0 | 15 | 0 |
| Mode SS | |||
|---|---|---|---|
| Quadrant | BADHDUFLAG | Total packets | Discarded packets |
| A | 0 | 118 | 0 |
| B | 0 | 118 | 0 |
| C | 0 | 118 | 0 |
| D | 0 | 118 | 0 |
| Quadrant | Total seconds | Saturated seconds | Saturation percentage |
|---|---|---|---|
| A | 5770 | 32 | 0.554593% |
| B | 5770 | 35 | 0.606586% |
| C | 5770 | 79 | 1.369151% |
| D | 5770 | 1729 | 29.965338% |
Noise dominated data is calculated using 1-second bins in cleaned event files. If a bin has >2000 counts, and if more than 50% of those come from <1% of pixels, then it is considered to be noise-dominated and hence unusable.
| Quadrant | # 1 sec bins | Bins with >0 counts | Bins with >2000 counts | High rate bins dominated by noise | Noise dominated (total time) | Noise dominated (detector-on time) | Marked lightcurve |
|---|---|---|---|---|---|---|---|
| A | 7090 | 5771 | 9 | 9 | 0.13% | 0.16% | 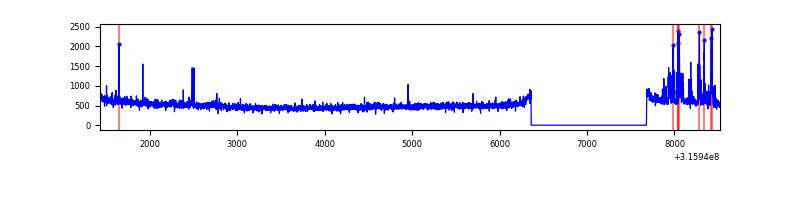 |
| B | 7090 | 5771 | 2 | 2 | 0.03% | 0.03% | 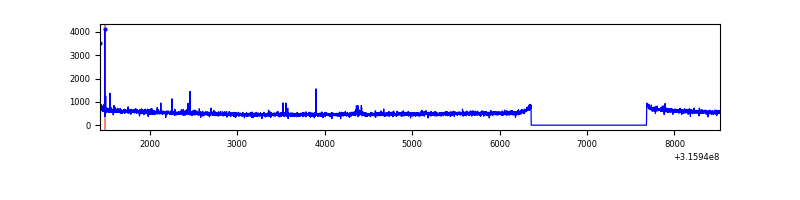 |
| C | 7090 | 5771 | 9 | 9 | 0.13% | 0.16% | 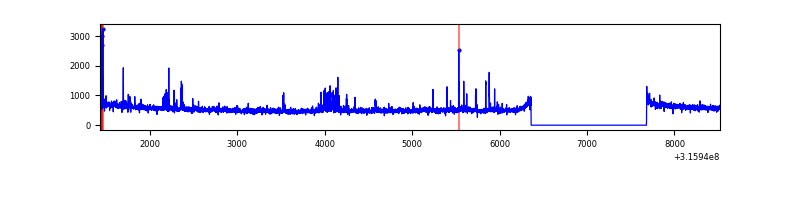 |
| D | 7090 | 5771 | 1544 | 1544 | 21.78% | 26.75% | 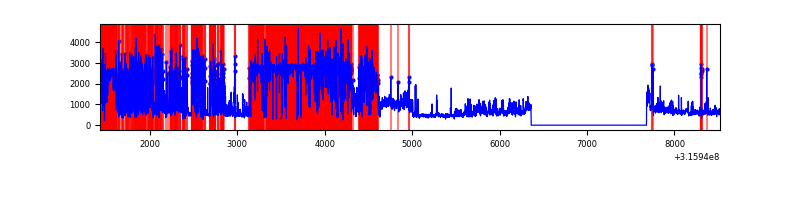 |
Top three noisy pixels from each quadrant. If the there are fewer than three noisy pixels in the level2.evt file, extra rows are filled as -1
| Pixel properties | Quadrant properties | ||||||
|---|---|---|---|---|---|---|---|
| Quadrant | DetID | PixID | Counts | Sigma | Mean | Median | Sigma |
| A | 6 | 16 | 152770 | 1018.3 | 754 | 741 | 149.3 |
| A | 13 | 254 | 8805 | 54.01 | 754 | 741 | 149.3 |
| A | 0 | 226 | 6592 | 39.19 | 754 | 741 | 149.3 |
| B | 12 | 111 | 16632 | 112.61 | 759 | 742 | 141.1 |
| B | 4 | 216 | 15527 | 104.78 | 759 | 742 | 141.1 |
| B | 11 | 111 | 14561 | 97.93 | 759 | 742 | 141.1 |
| C | 14 | 238 | 118991 | 692.06 | 740 | 747 | 170.9 |
| C | 9 | 15 | 102855 | 597.62 | 740 | 747 | 170.9 |
| C | 0 | 10 | 46128 | 265.61 | 740 | 747 | 170.9 |
| D | 1 | 52 | 4671669 | 30190.87 | 636 | 620 | 154.7 |
| D | 12 | 233 | 323888 | 2089.41 | 636 | 620 | 154.7 |
| D | 12 | 227 | 35411 | 224.87 | 636 | 620 | 154.7 |
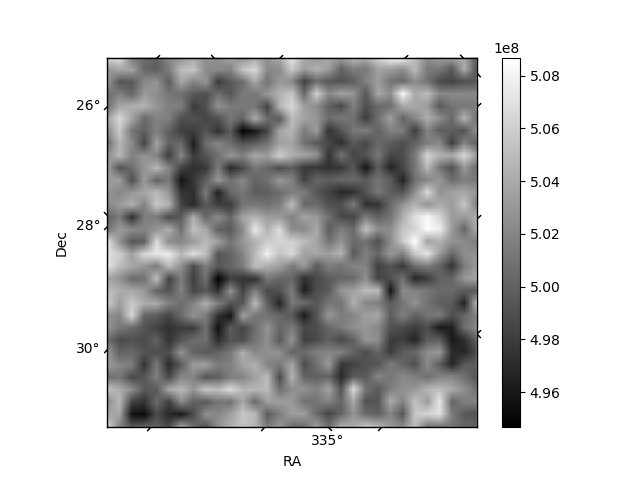
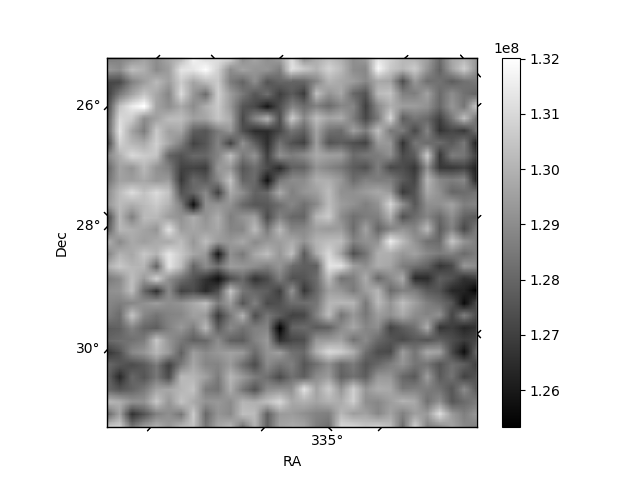
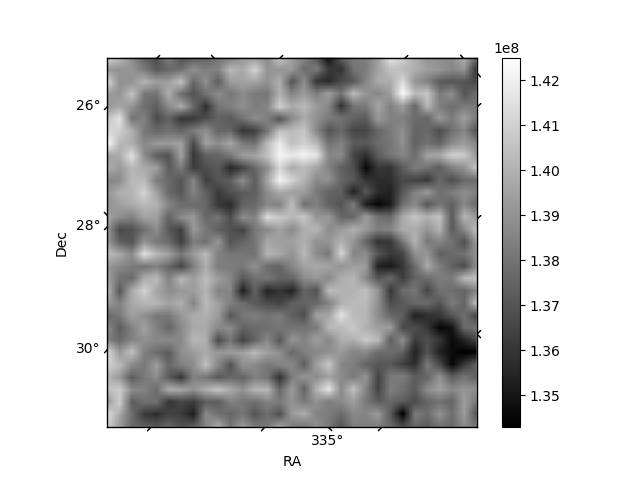
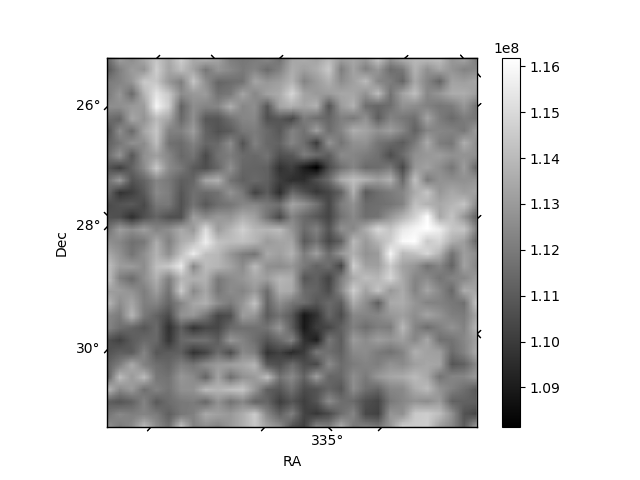
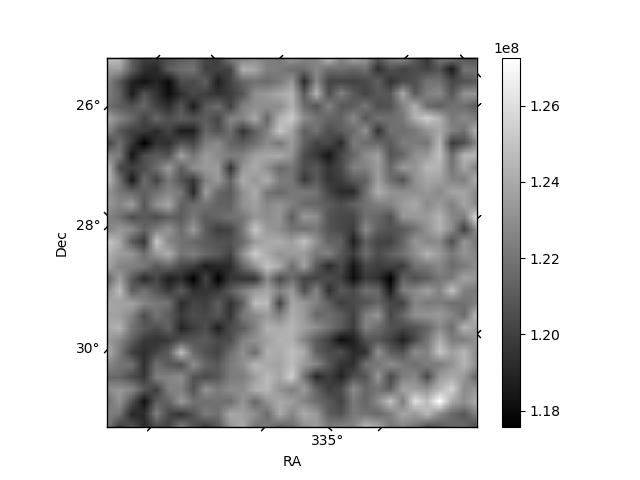
Histogram calculated using DETX and DETY for each event in the final _common_clean file
| Quadrant A | 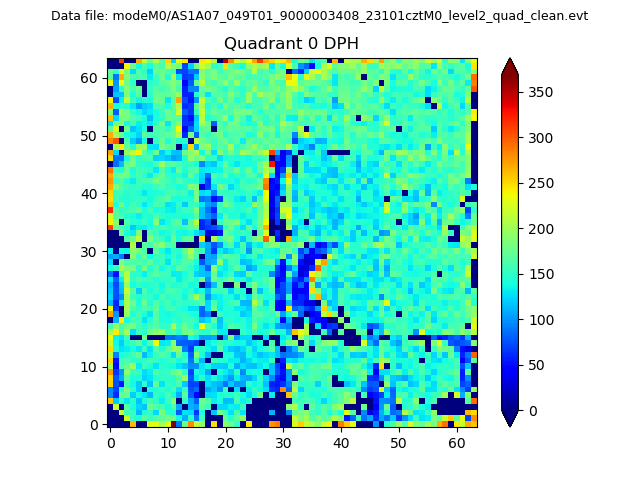 |
 |
Quadrant B |
|---|---|---|---|
| Quadrant D | 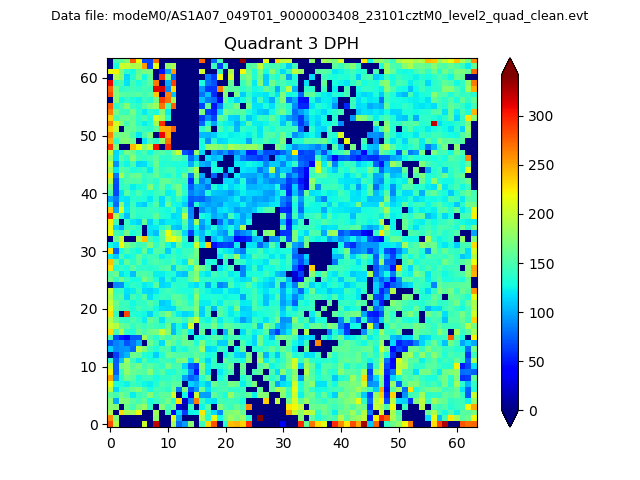 |
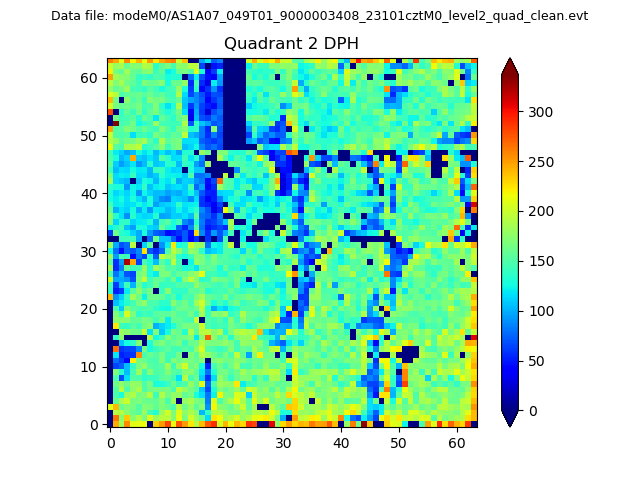 |
Quadrant C |
| Plot type | Count rate plots | Images |
|---|---|---|
| Comparison with Poisson distribution Blue bars denote a histogram of data divided into 1 sec bins. Red curve is a Poisson curve with rate = median count rate of data. |
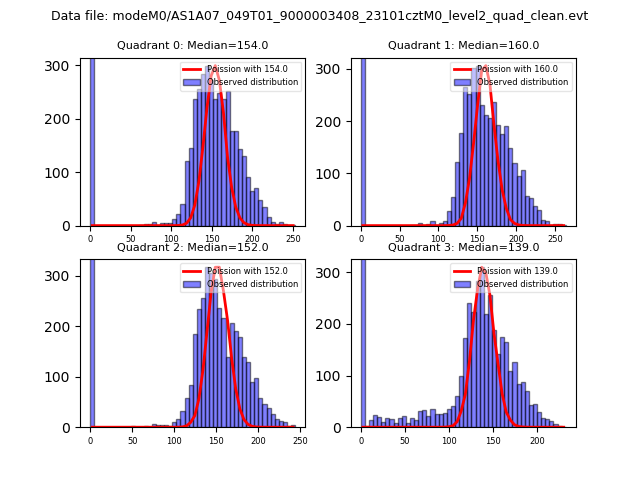 |
 |
| Quadrant-wise count rates Data is divided into 100 sec bins |
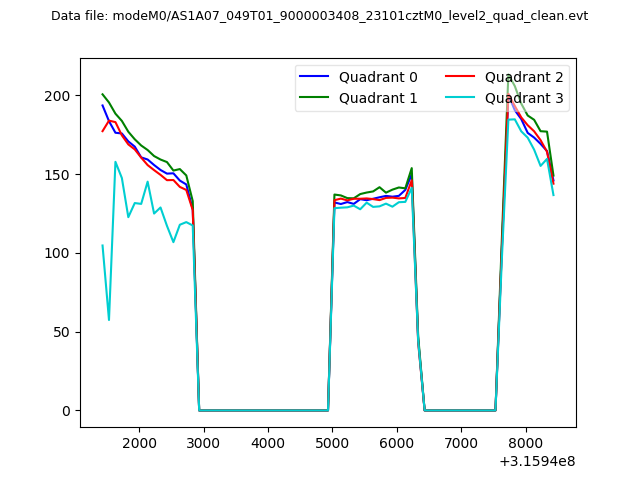 |
|
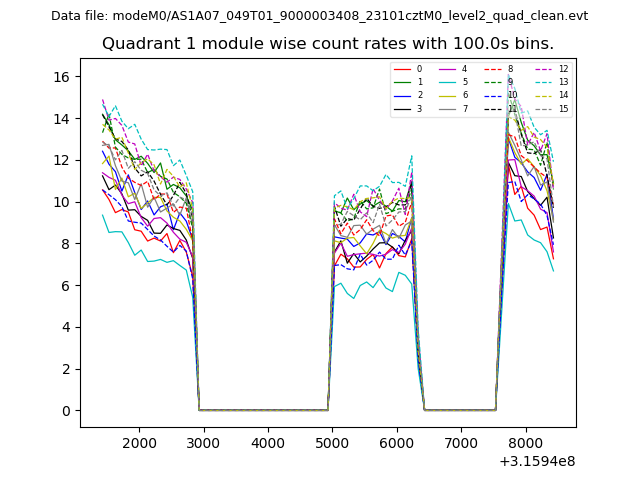
| Module-wise count rates for Quadrant A Data is divided into 100 sec bins |
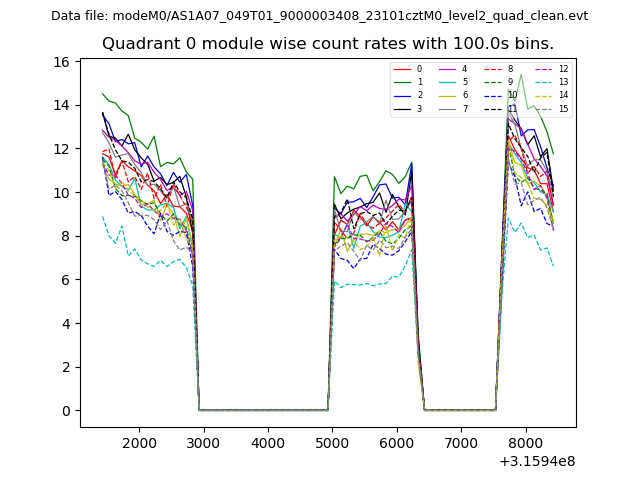 |
 |
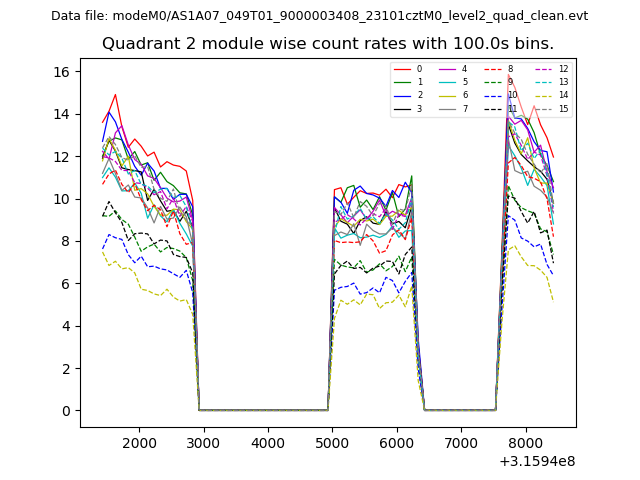
| Module-wise count rates for Quadrant B Data is divided into 100 sec bins |
 |
 |
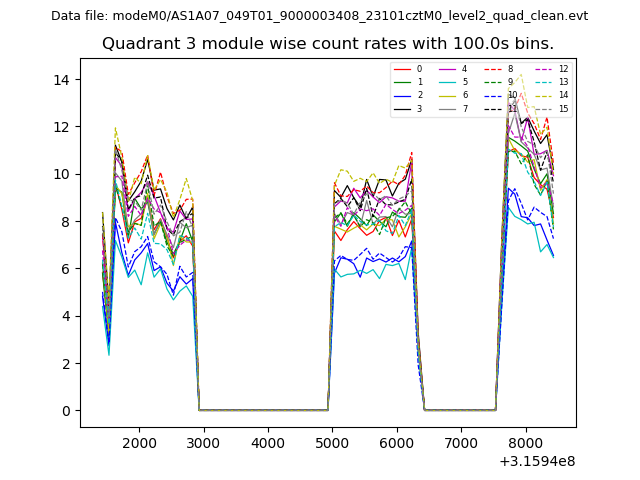
| Module-wise count rates for Quadrant C Data is divided into 100 sec bins |
 |
 |
| Module-wise count rates for Quadrant D Data is divided into 100 sec bins |
 |
 |
| Parameter | Plot |
|---|---|
| CZT HV Monitor | 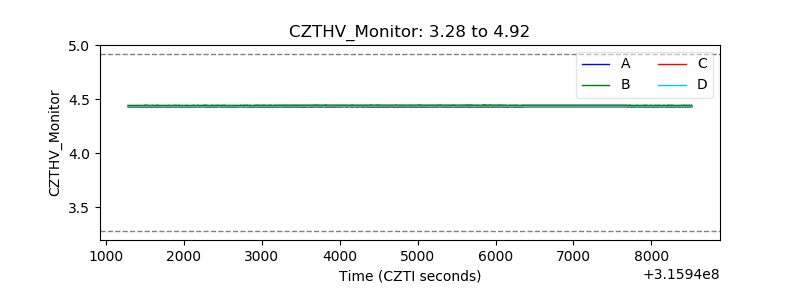 |
| D_VDD | 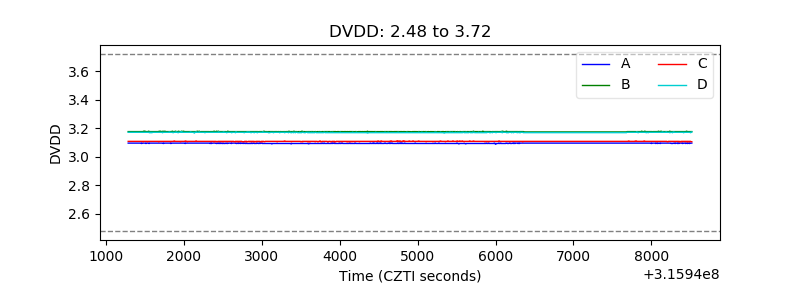 |
| Temperature 1 | 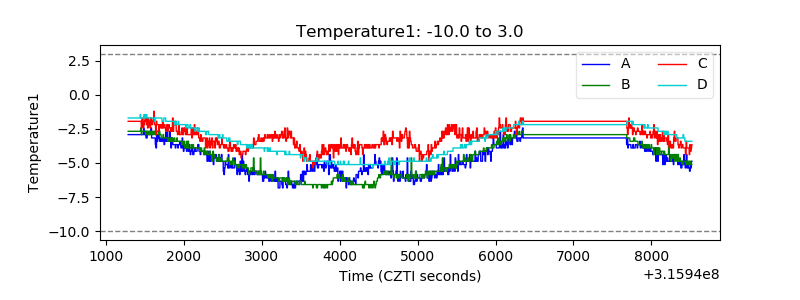 |
| Veto HV Monitor | 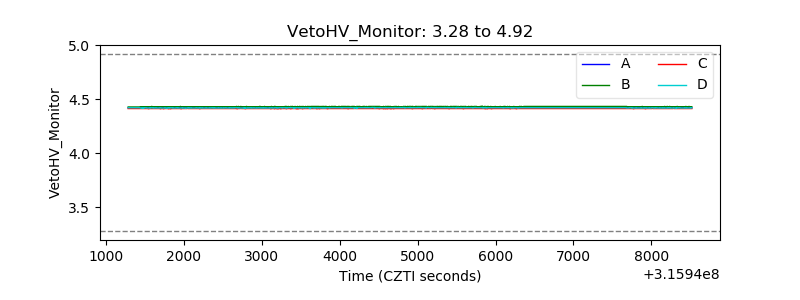 |
| Veto LLD | 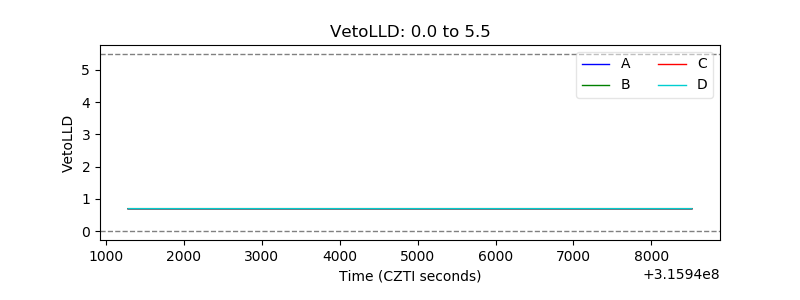 |
| Alpha Counter | 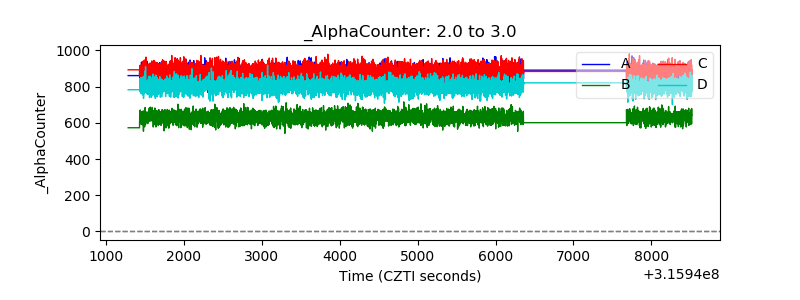 |
| _CPM_Rate | 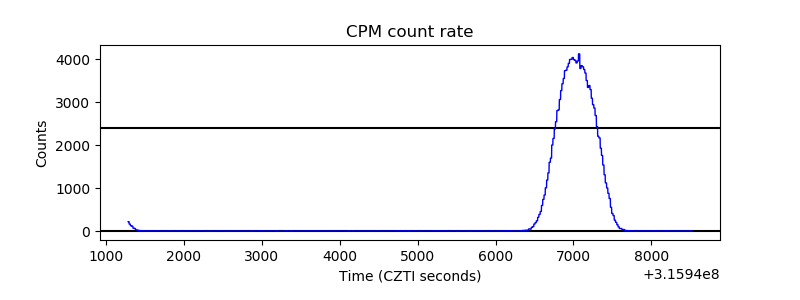 |
| CZT Counter | 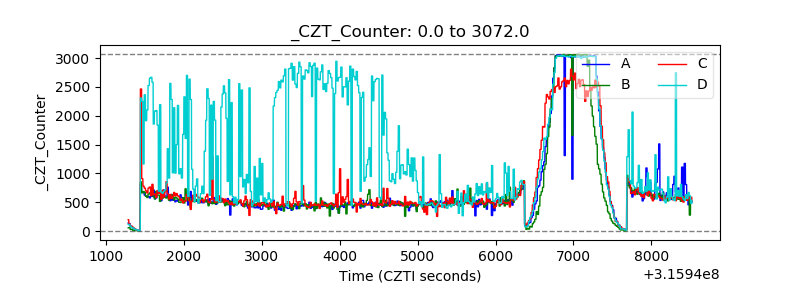 |
| +2.5 Volts monitor |  |
| +5 Volts monitor | 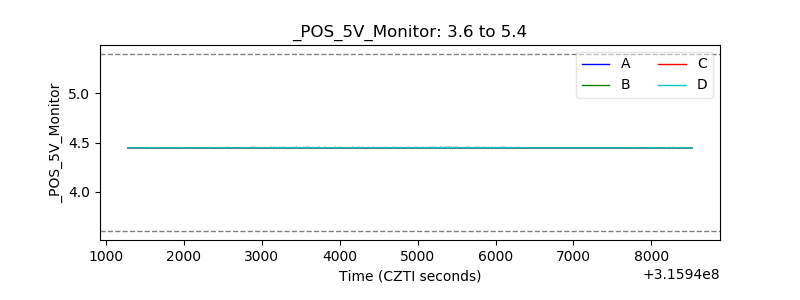 |
| _ROLL_ROT | 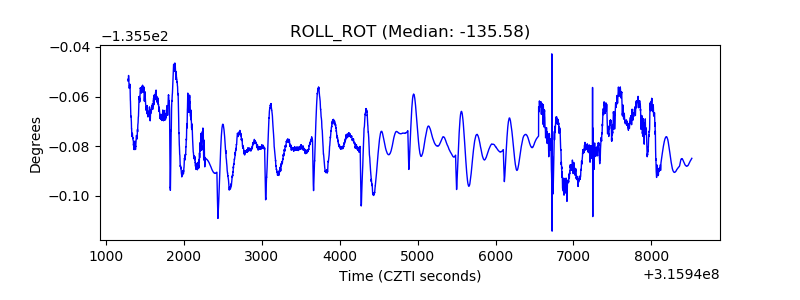 |
| _Roll_DEC | 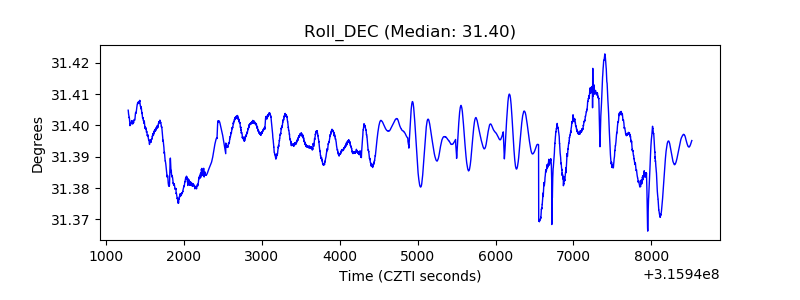 |
| _Roll_RA | 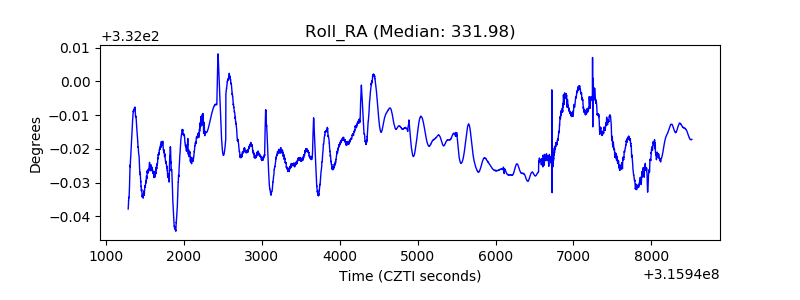 |
| Veto Counter | 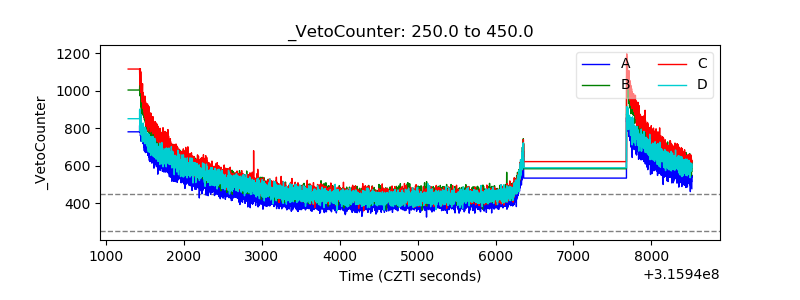 |