| Param | Original file | Final file |
|---|---|---|
| Filename | modeM0/AS1A07_054T01_9000003406cztM0_level2.fits | modeM0/AS1A07_054T01_9000003406cztM0_level2_quad_clean.evt |
| Size (bytes) | 691,053,120 | 787,455,360 |
| Size | 659.0 MB | 751.0 MB |
| Events in quadrant A | 4,248,562 | 4,977,764 |
| Events in quadrant B | 4,072,650 | 4,969,757 |
| Events in quadrant C | 4,150,470 | 4,715,189 |
| Events in quadrant D | 3,530,886 | 4,263,447 |
| Mode M0 | |||
|---|---|---|---|
| Quadrant | BADHDUFLAG | Total packets | Discarded packets |
| A | 0 | 148168 | 0 |
| B | 0 | 156249 | 0 |
| C | 0 | 153509 | 0 |
| D | 0 | 191890 | 0 |
| Mode SS | |||
|---|---|---|---|
| Quadrant | BADHDUFLAG | Total packets | Discarded packets |
| A | 0 | 1456 | 0 |
| B | 0 | 1458 | 0 |
| C | 0 | 1460 | 0 |
| D | 0 | 1460 | 0 |
| Mode M9 | |||
|---|---|---|---|
| Quadrant | BADHDUFLAG | Total packets | Discarded packets |
| A | 0 | 102 | 0 |
| B | 0 | 102 | 0 |
| C | 0 | 102 | 0 |
| D | 0 | 102 | 0 |
| Quadrant | Total seconds | Saturated seconds | Saturation percentage |
|---|---|---|---|
| A | 71796 | 754 | 1.050198% |
| B | 71829 | 1558 | 2.169040% |
| C | 71820 | 1538 | 2.141465% |
| D | 71834 | 3949 | 5.497397% |
Noise dominated data is calculated using 1-second bins in cleaned event files. If a bin has >2000 counts, and if more than 50% of those come from <1% of pixels, then it is considered to be noise-dominated and hence unusable.
| Quadrant | # 1 sec bins | Bins with >0 counts | Bins with >2000 counts | High rate bins dominated by noise | Noise dominated (total time) | Noise dominated (detector-on time) | Marked lightcurve |
|---|---|---|---|---|---|---|---|
| A | 76543 | 68271 | 0 | 0 | 0.00% | 0.00% |  |
| B | 76543 | 68262 | 0 | 0 | 0.00% | 0.00% |  |
| C | 76543 | 68271 | 0 | 0 | 0.00% | 0.00% |  |
| D | 76543 | 68221 | 0 | 0 | 0.00% | 0.00% |  |
Top three noisy pixels from each quadrant. If the there are fewer than three noisy pixels in the level2.evt file, extra rows are filled as -1
| Pixel properties | Quadrant properties | ||||||
|---|---|---|---|---|---|---|---|
| Quadrant | DetID | PixID | Counts | Sigma | Mean | Median | Sigma |
| A | 0 | 29 | 4175 | 11.4 | 1105 | 1041 | 274.9 |
| A | 7 | 110 | 3479 | 8.87 | 1105 | 1041 | 274.9 |
| A | 0 | 30 | 3195 | 7.84 | 1105 | 1041 | 274.9 |
| B | 2 | 9 | 3193 | 10.32 | 1078 | 1031 | 209.4 |
| B | 5 | 128 | 2705 | 7.99 | 1078 | 1031 | 209.4 |
| B | 2 | 8 | 2696 | 7.95 | 1078 | 1031 | 209.4 |
| C | 1 | 80 | 3269 | 8.01 | 1096 | 1028 | 279.7 |
| C | 1 | 81 | 3157 | 7.61 | 1096 | 1028 | 279.7 |
| C | 12 | 241 | 2887 | 6.64 | 1096 | 1028 | 279.7 |
| D | 4 | 246 | 2781 | 6.88 | 1008 | 920 | 270.3 |
| D | 3 | 14 | 2540 | 5.99 | 1008 | 920 | 270.3 |
| D | 10 | 189 | 2539 | 5.99 | 1008 | 920 | 270.3 |
Histogram calculated using DETX and DETY for each event in the final _common_clean file
| Quadrant A |  |
 |
Quadrant B |
|---|---|---|---|
| Quadrant D |  |
 |
Quadrant C |
| Plot type | Count rate plots | Images |
|---|---|---|
| Comparison with Poisson distribution Blue bars denote a histogram of data divided into 1 sec bins. Red curve is a Poisson curve with rate = median count rate of data. |
 |
 |
| Quadrant-wise count rates Data is divided into 100 sec bins |
 |
|
| Module-wise count rates for Quadrant A Data is divided into 100 sec bins |
 |
 |
| Module-wise count rates for Quadrant B Data is divided into 100 sec bins |
 |
 |
| Module-wise count rates for Quadrant C Data is divided into 100 sec bins |
 |
 |
| Module-wise count rates for Quadrant D Data is divided into 100 sec bins |
 |
 |
| Parameter | Plot |
|---|---|
| CZT HV Monitor |  |
| D_VDD | 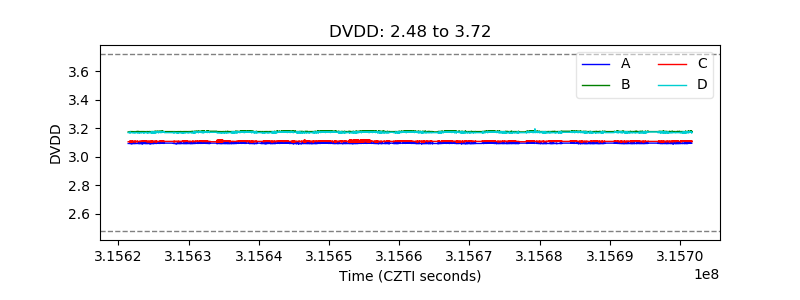 |
| Temperature 1 |  |
| Veto HV Monitor |  |
| Veto LLD |  |
| Alpha Counter |  |
| _CPM_Rate |  |
| CZT Counter |  |
| +2.5 Volts monitor |  |
| +5 Volts monitor |  |
| _ROLL_ROT |  |
| _Roll_DEC |  |
| _Roll_RA |  |
| Veto Counter |  |