| Param | Original file | Final file |
|---|---|---|
| Filename | modeM0/AS1A07_054T01_9000003406_23044cztM0_level2.evt | modeM0/AS1A07_054T01_9000003406_23044cztM0_level2_quad_clean.evt |
| Size (bytes) | 100,713,600 | 30,600,000 |
| Size | 96.0 MB | 29.2 MB |
| Events in quadrant A | 658,478 | 210,716 |
| Events in quadrant B | 716,261 | 217,820 |
| Events in quadrant C | 774,511 | 199,442 |
| Events in quadrant D | 805,915 | 197,201 |
| Mode M0 | |||
|---|---|---|---|
| Quadrant | BADHDUFLAG | Total packets | Discarded packets |
| A | 0 | 2788 | 1 |
| B | 0 | 2934 | 1 |
| C | 0 | 3099 | 1 |
| D | 0 | 3259 | 1 |
| Mode SS | |||
|---|---|---|---|
| Quadrant | BADHDUFLAG | Total packets | Discarded packets |
| A | 0 | 28 | 0 |
| B | 0 | 28 | 0 |
| C | 0 | 28 | 0 |
| D | 0 | 28 | 0 |
| Mode M9 | |||
|---|---|---|---|
| Quadrant | BADHDUFLAG | Total packets | Discarded packets |
| A | 0 | 2 | 0 |
| B | 0 | 2 | 0 |
| C | 0 | 2 | 0 |
| D | 0 | 2 | 0 |
| Quadrant | Total seconds | Saturated seconds | Saturation percentage |
|---|---|---|---|
| A | 1349 | 1 | 0.074129% |
| B | 1349 | 5 | 0.370645% |
| C | 1349 | 52 | 3.854707% |
| D | 1349 | 23 | 1.704967% |
Noise dominated data is calculated using 1-second bins in cleaned event files. If a bin has >2000 counts, and if more than 50% of those come from <1% of pixels, then it is considered to be noise-dominated and hence unusable.
| Quadrant | # 1 sec bins | Bins with >0 counts | Bins with >2000 counts | High rate bins dominated by noise | Noise dominated (total time) | Noise dominated (detector-on time) | Marked lightcurve |
|---|---|---|---|---|---|---|---|
| A | 1349 | 1349 | 0 | 0 | 0.00% | 0.00% | 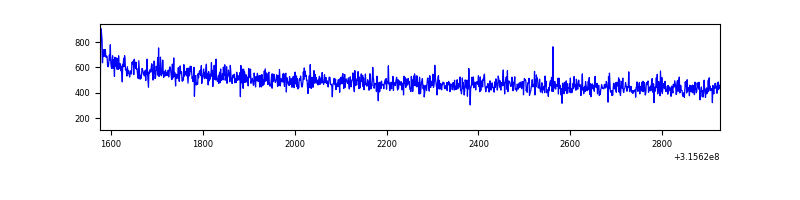 |
| B | 1349 | 1349 | 0 | 0 | 0.00% | 0.00% | 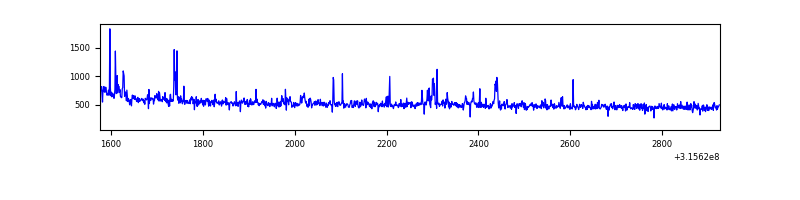 |
| C | 1349 | 1349 | 18 | 18 | 1.33% | 1.33% | 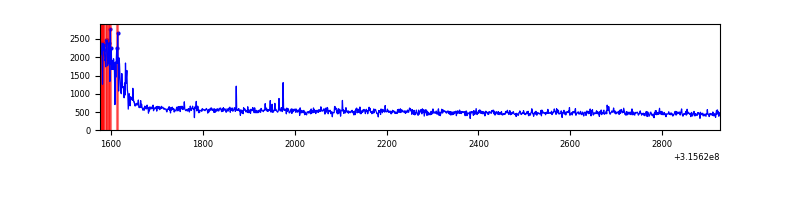 |
| D | 1349 | 1349 | 26 | 26 | 1.93% | 1.93% | 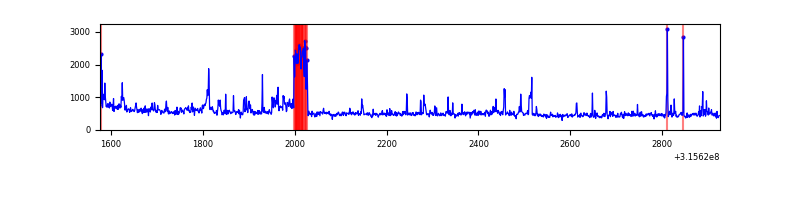 |
Top three noisy pixels from each quadrant. If the there are fewer than three noisy pixels in the level2.evt file, extra rows are filled as -1
| Pixel properties | Quadrant properties | ||||||
|---|---|---|---|---|---|---|---|
| Quadrant | DetID | PixID | Counts | Sigma | Mean | Median | Sigma |
| A | 13 | 254 | 2278 | 60.31 | 170 | 166 | 35.0 |
| A | 0 | 226 | 1518 | 38.61 | 170 | 166 | 35.0 |
| A | 3 | 137 | 1367 | 34.3 | 170 | 166 | 35.0 |
| B | 3 | 64 | 18434 | 537.54 | 175 | 171 | 34.0 |
| B | 4 | 216 | 5146 | 146.43 | 175 | 171 | 34.0 |
| B | 0 | 189 | 4047 | 114.08 | 175 | 171 | 34.0 |
| C | 0 | 10 | 99745 | 2516.07 | 165 | 166 | 39.6 |
| C | 14 | 238 | 27271 | 684.86 | 165 | 166 | 39.6 |
| C | 0 | 207 | 2746 | 65.19 | 165 | 166 | 39.6 |
| D | 1 | 52 | 113148 | 2772.63 | 166 | 161 | 40.8 |
| D | 13 | 153 | 20428 | 497.34 | 166 | 161 | 40.8 |
| D | 13 | 174 | 18736 | 455.82 | 166 | 161 | 40.8 |
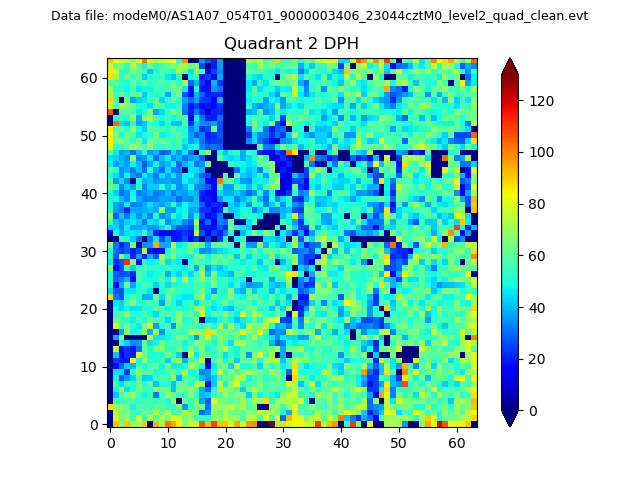
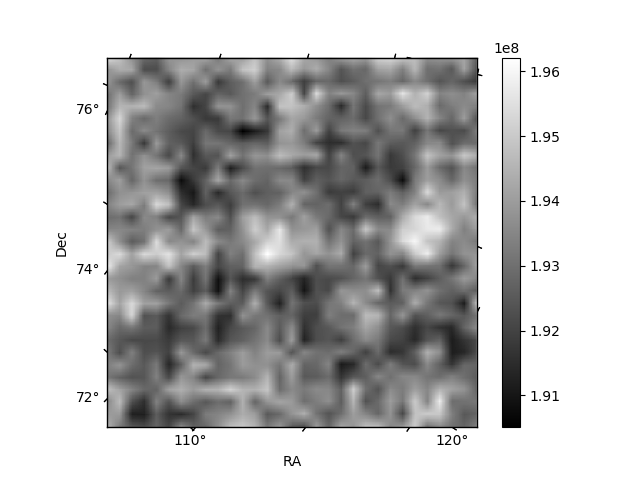
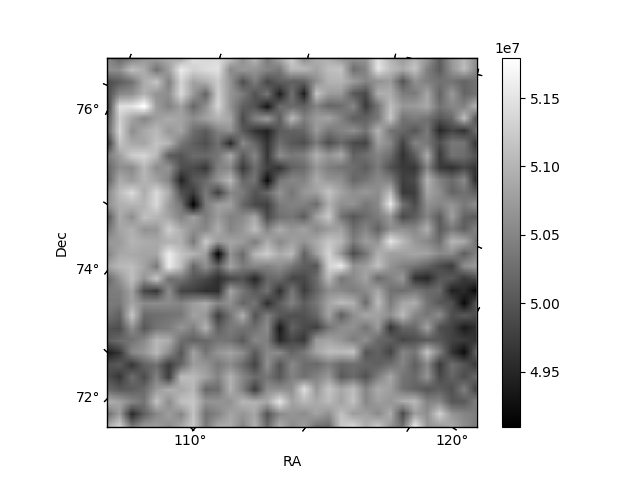
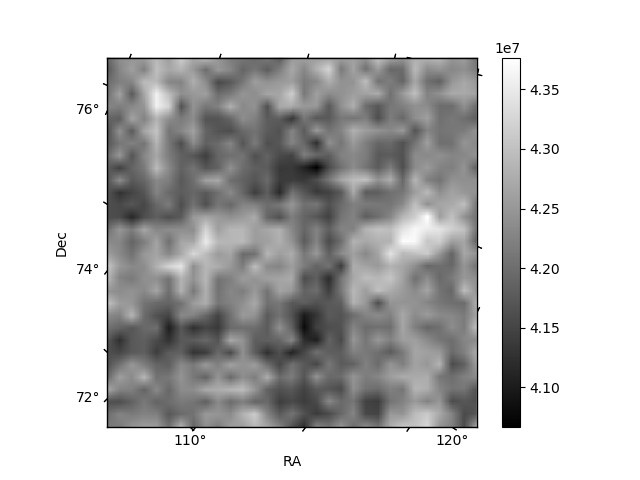
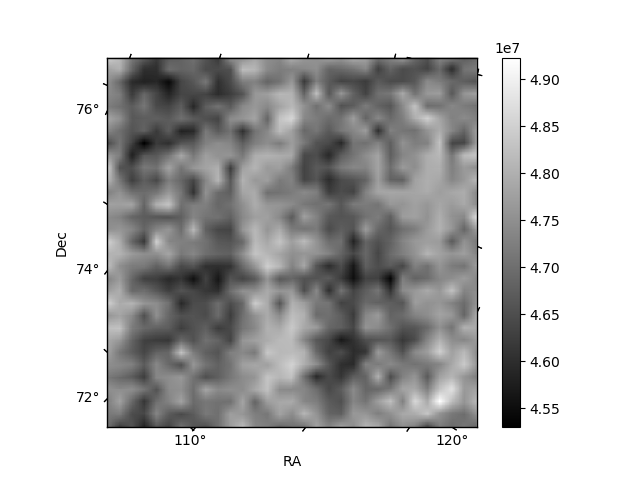
Histogram calculated using DETX and DETY for each event in the final _common_clean file
| Quadrant A | 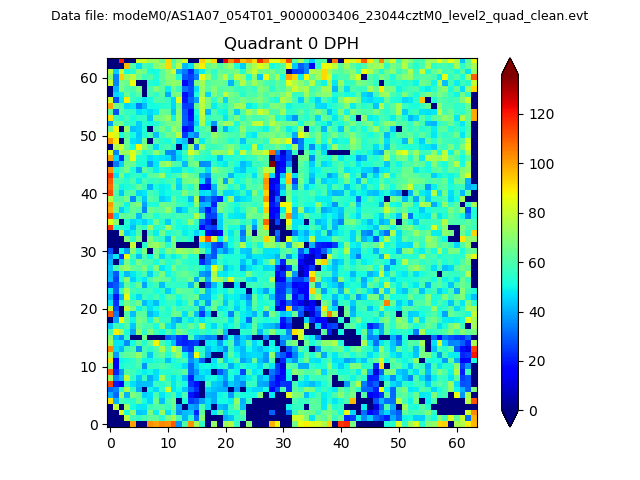 |
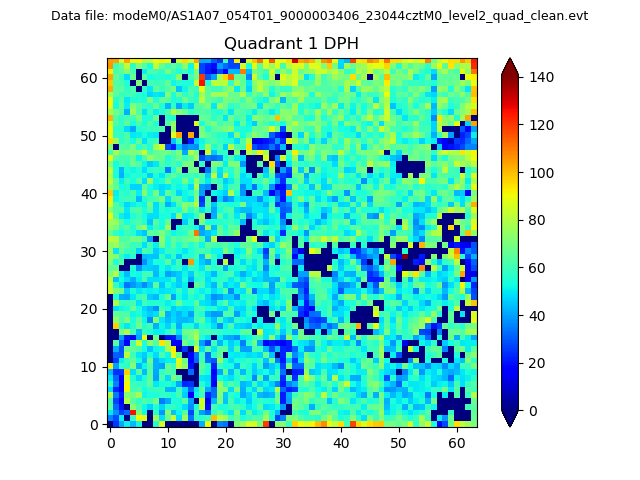 |
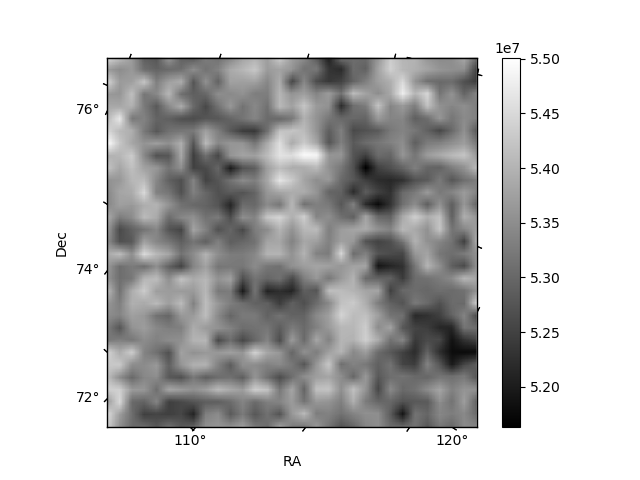
Quadrant B |
|---|---|---|---|
| Quadrant D | 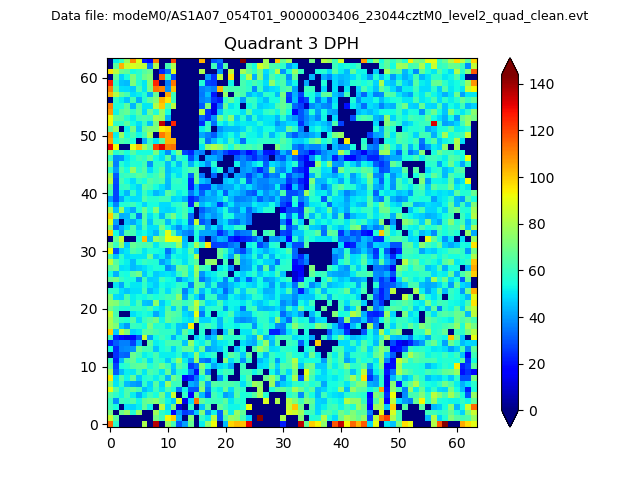 |
 |
Quadrant C |
| Plot type | Count rate plots | Images |
|---|---|---|
| Comparison with Poisson distribution Blue bars denote a histogram of data divided into 1 sec bins. Red curve is a Poisson curve with rate = median count rate of data. |
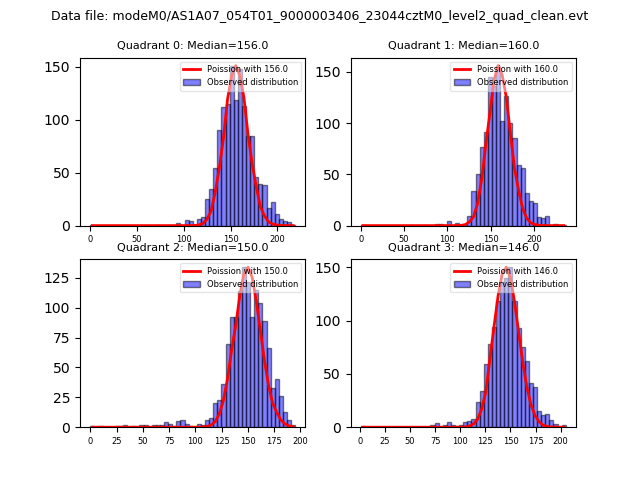 |
 |
| Quadrant-wise count rates Data is divided into 100 sec bins |
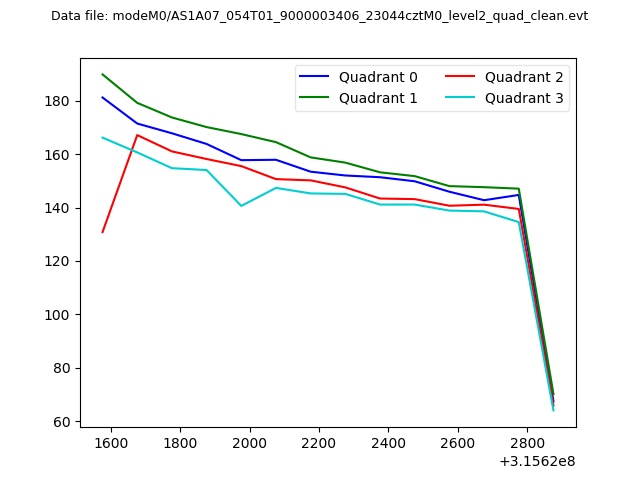 |
|
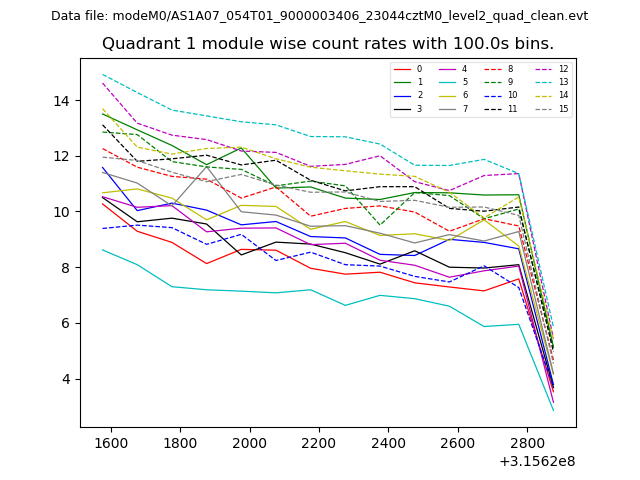
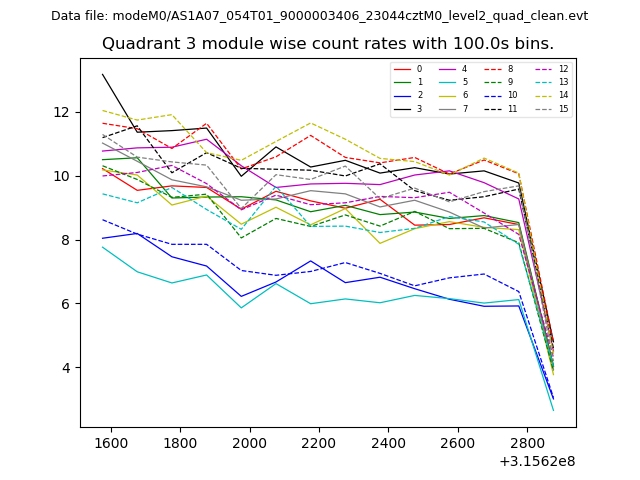
| Module-wise count rates for Quadrant A Data is divided into 100 sec bins |
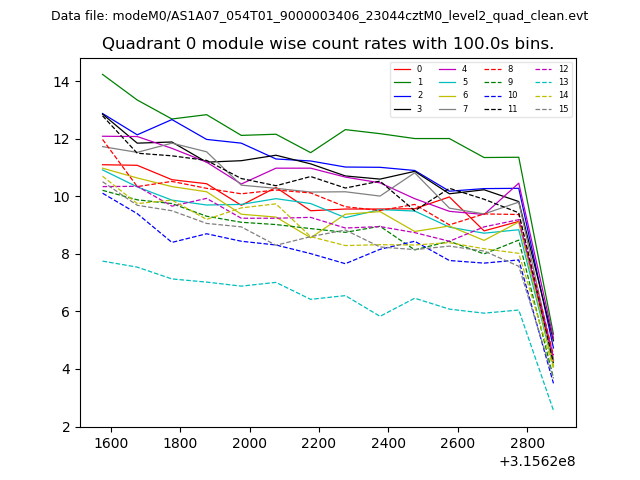 |
 |
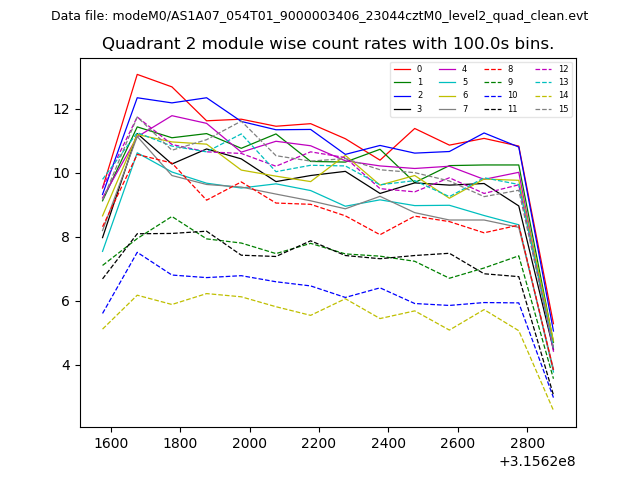
| Module-wise count rates for Quadrant B Data is divided into 100 sec bins |
 |
 |
| Module-wise count rates for Quadrant C Data is divided into 100 sec bins |
 |
 |
| Module-wise count rates for Quadrant D Data is divided into 100 sec bins |
 |
 |
| Parameter | Plot |
|---|---|
| CZT HV Monitor | 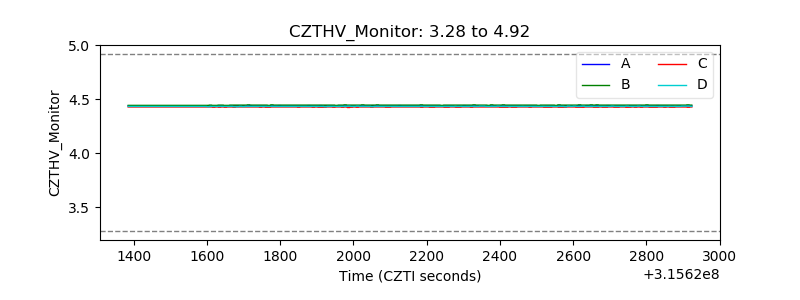 |
| D_VDD | 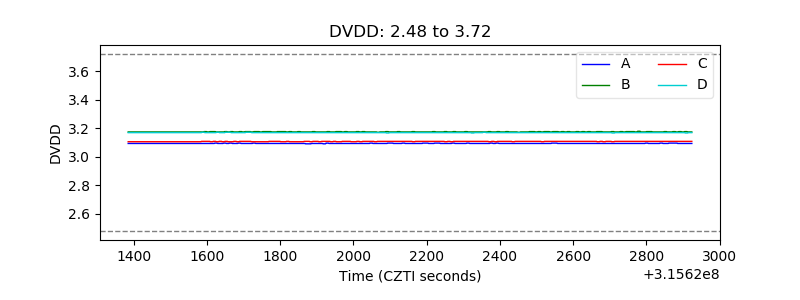 |
| Temperature 1 | 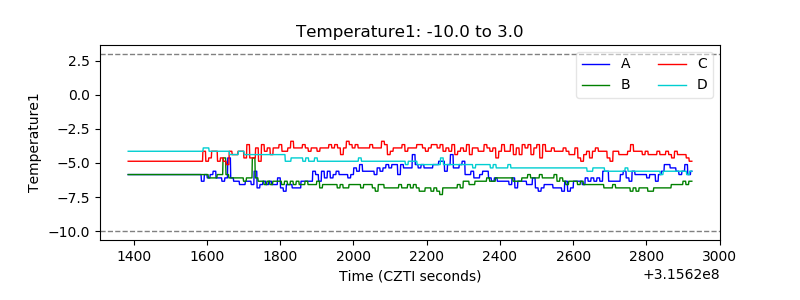 |
| Veto HV Monitor | 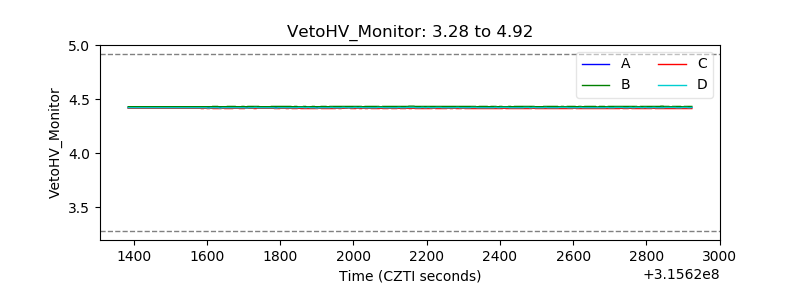 |
| Veto LLD | 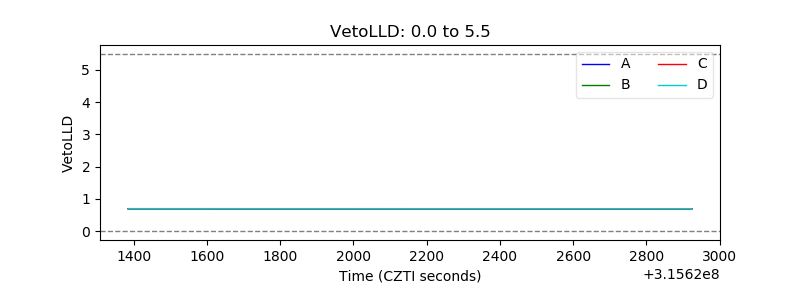 |
| Alpha Counter | 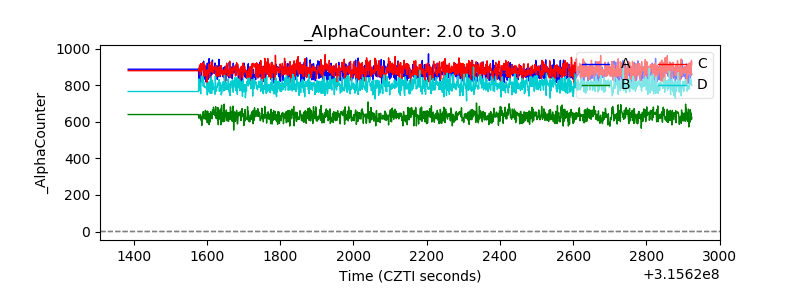 |
| _CPM_Rate | 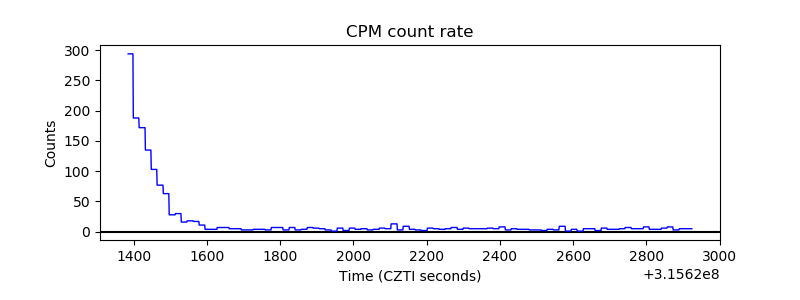 |
| CZT Counter | 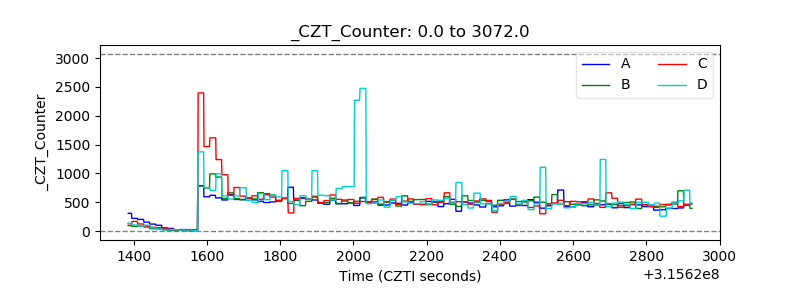 |
| +2.5 Volts monitor |  |
| +5 Volts monitor | 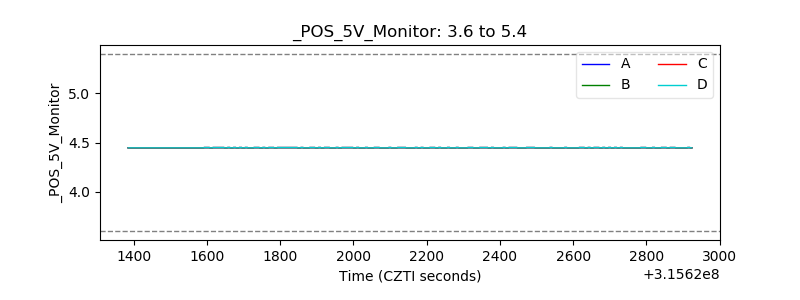 |
| _ROLL_ROT | 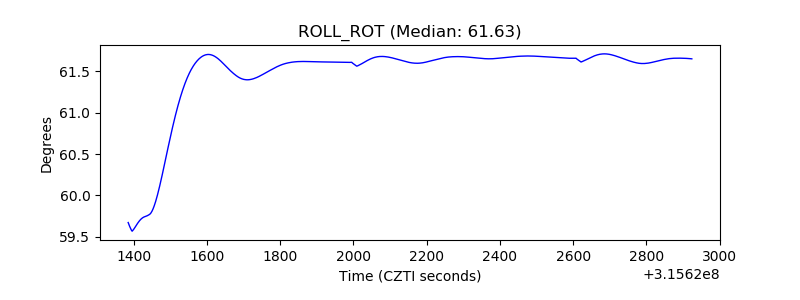 |
| _Roll_DEC | 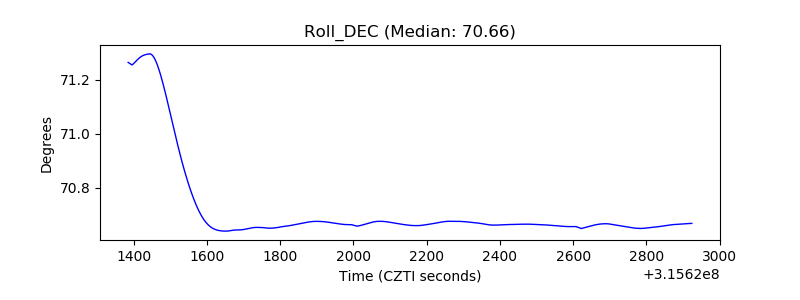 |
| _Roll_RA | 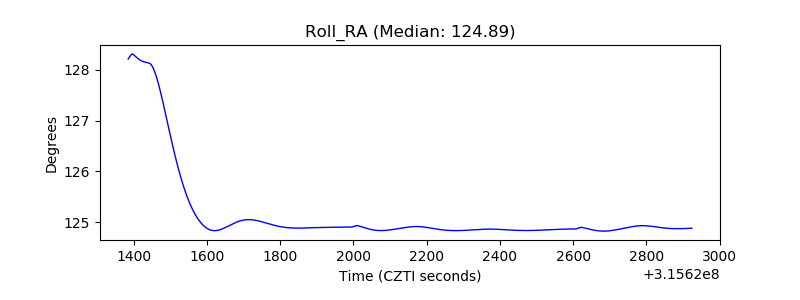 |
| Veto Counter | 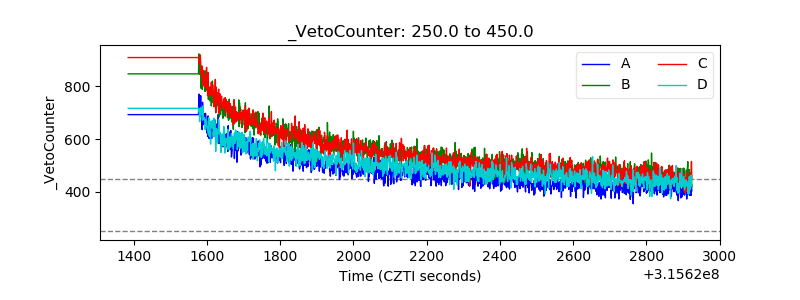 |