| Param | Original file | Final file |
|---|---|---|
| Filename | modeM0/AS1A07_054T01_9000003406_23045cztM0_level2.evt | modeM0/AS1A07_054T01_9000003406_23045cztM0_level2_quad_clean.evt |
| Size (bytes) | 463,835,520 | 118,969,920 |
| Size | 442.3 MB | 113.5 MB |
| Events in quadrant A | 3,083,771 | 799,142 |
| Events in quadrant B | 3,392,602 | 820,643 |
| Events in quadrant C | 3,384,030 | 769,301 |
| Events in quadrant D | 3,737,397 | 753,026 |
| Mode M0 | |||
|---|---|---|---|
| Quadrant | BADHDUFLAG | Total packets | Discarded packets |
| A | 0 | 13578 | 2 |
| B | 0 | 14358 | 2 |
| C | 0 | 14377 | 2 |
| D | 0 | 15698 | 2 |
| Mode SS | |||
|---|---|---|---|
| Quadrant | BADHDUFLAG | Total packets | Discarded packets |
| A | 0 | 134 | 0 |
| B | 0 | 134 | 0 |
| C | 0 | 134 | 0 |
| D | 0 | 134 | 0 |
| Mode M9 | |||
|---|---|---|---|
| Quadrant | BADHDUFLAG | Total packets | Discarded packets |
| A | 0 | 15 | 0 |
| B | 0 | 15 | 0 |
| C | 0 | 15 | 0 |
| D | 0 | 15 | 0 |
| Quadrant | Total seconds | Saturated seconds | Saturation percentage |
|---|---|---|---|
| A | 6615 | 12 | 0.181406% |
| B | 6615 | 94 | 1.421013% |
| C | 6615 | 183 | 2.766440% |
| D | 6615 | 102 | 1.541950% |
Noise dominated data is calculated using 1-second bins in cleaned event files. If a bin has >2000 counts, and if more than 50% of those come from <1% of pixels, then it is considered to be noise-dominated and hence unusable.
| Quadrant | # 1 sec bins | Bins with >0 counts | Bins with >2000 counts | High rate bins dominated by noise | Noise dominated (total time) | Noise dominated (detector-on time) | Marked lightcurve |
|---|---|---|---|---|---|---|---|
| A | 7885 | 6617 | 0 | 0 | 0.00% | 0.00% | 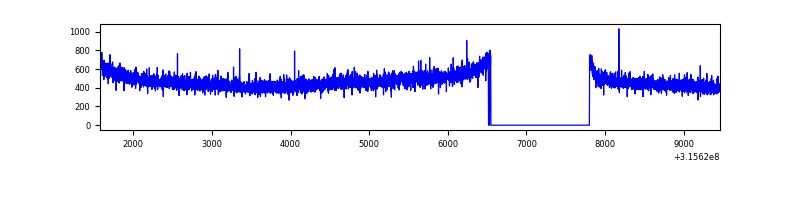 |
| B | 7885 | 6617 | 52 | 52 | 0.66% | 0.79% | 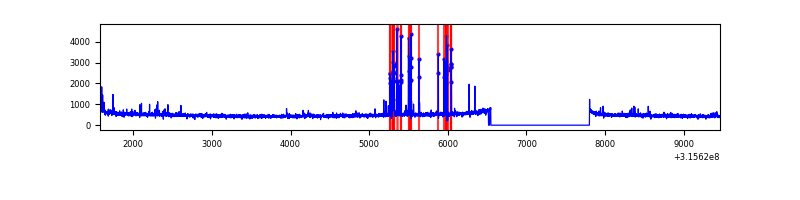 |
| C | 7885 | 6617 | 38 | 38 | 0.48% | 0.57% | 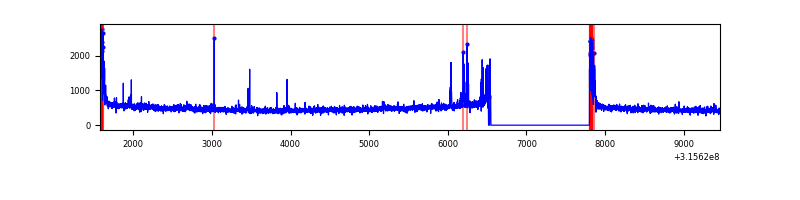 |
| D | 7885 | 6617 | 82 | 82 | 1.04% | 1.24% | 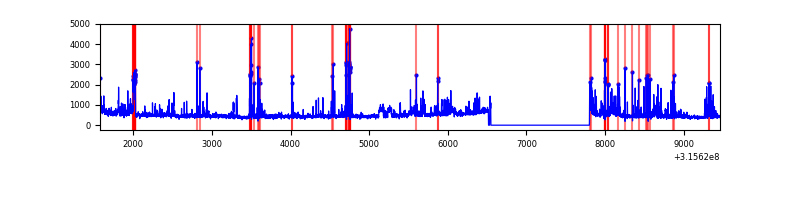 |
Top three noisy pixels from each quadrant. If the there are fewer than three noisy pixels in the level2.evt file, extra rows are filled as -1
| Pixel properties | Quadrant properties | ||||||
|---|---|---|---|---|---|---|---|
| Quadrant | DetID | PixID | Counts | Sigma | Mean | Median | Sigma |
| A | 13 | 254 | 10013 | 58.22 | 799 | 783 | 158.5 |
| A | 0 | 226 | 6910 | 38.64 | 799 | 783 | 158.5 |
| A | 3 | 137 | 6772 | 37.77 | 799 | 783 | 158.5 |
| B | 4 | 216 | 184905 | 1241.0 | 802 | 782 | 148.4 |
| B | 3 | 64 | 26044 | 170.27 | 802 | 782 | 148.4 |
| B | 12 | 111 | 17492 | 112.63 | 802 | 782 | 148.4 |
| C | 0 | 10 | 191399 | 1093.12 | 764 | 770 | 174.4 |
| C | 14 | 238 | 125382 | 714.56 | 764 | 770 | 174.4 |
| C | 0 | 207 | 63090 | 357.36 | 764 | 770 | 174.4 |
| D | 1 | 52 | 633296 | 3416.4 | 769 | 747 | 185.2 |
| D | 13 | 153 | 72438 | 387.2 | 769 | 747 | 185.2 |
| D | 13 | 174 | 61666 | 329.02 | 769 | 747 | 185.2 |
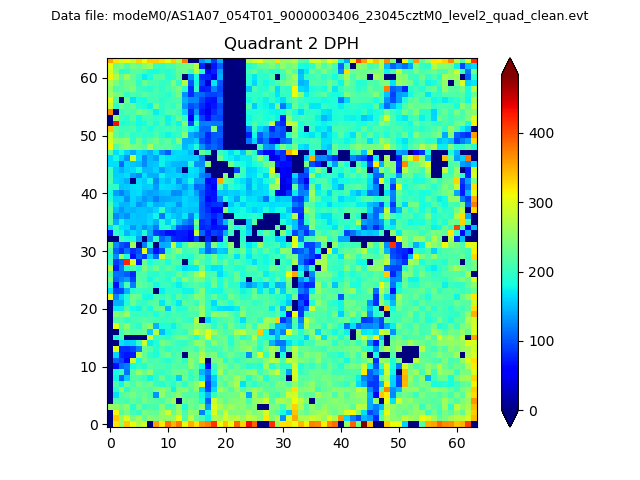
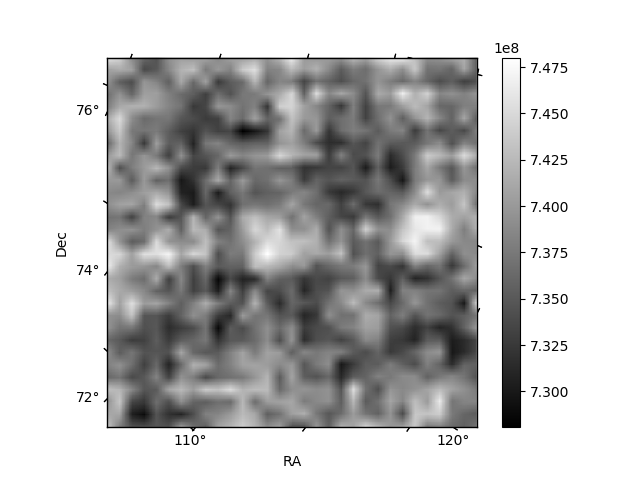
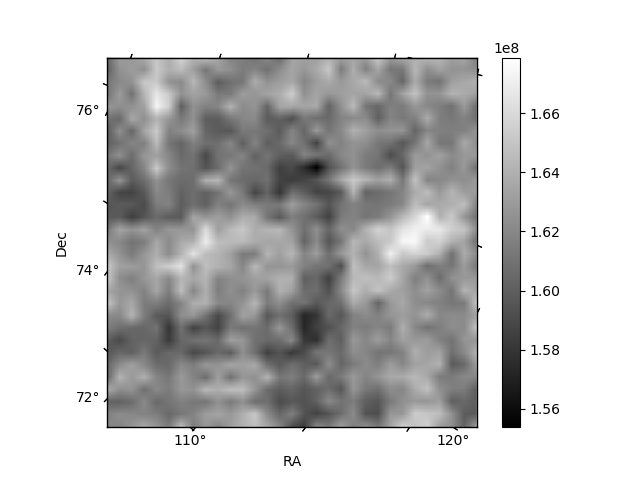
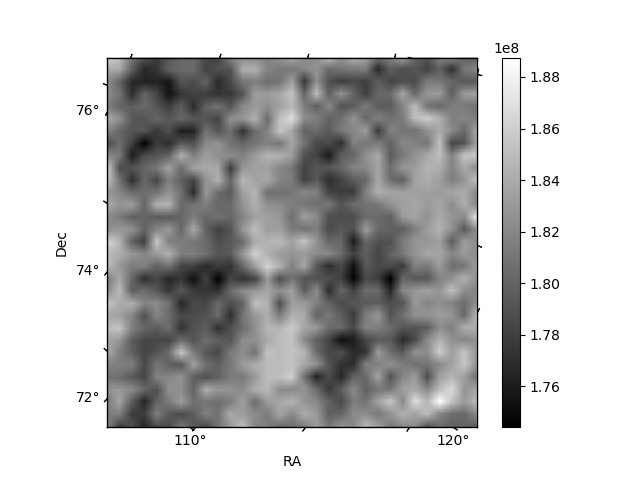
Histogram calculated using DETX and DETY for each event in the final _common_clean file
| Quadrant A | 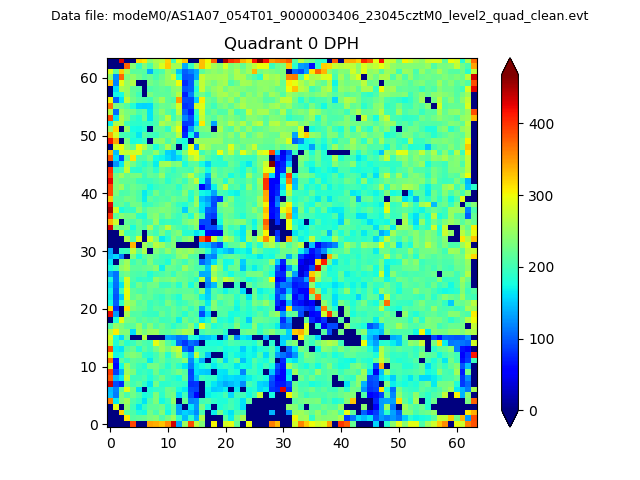 |
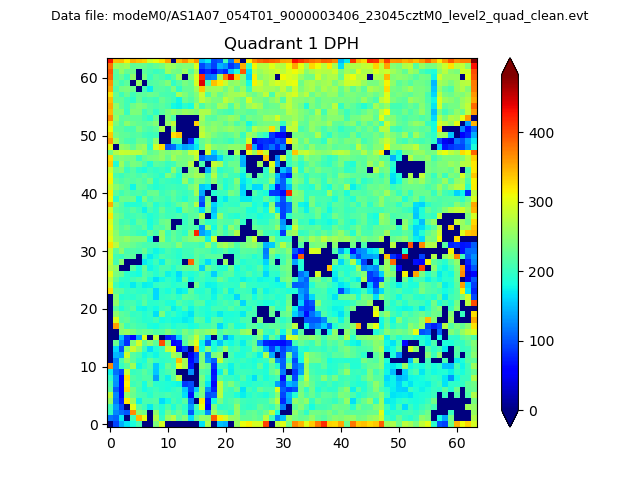 |
Quadrant B |
|---|---|---|---|
| Quadrant D | 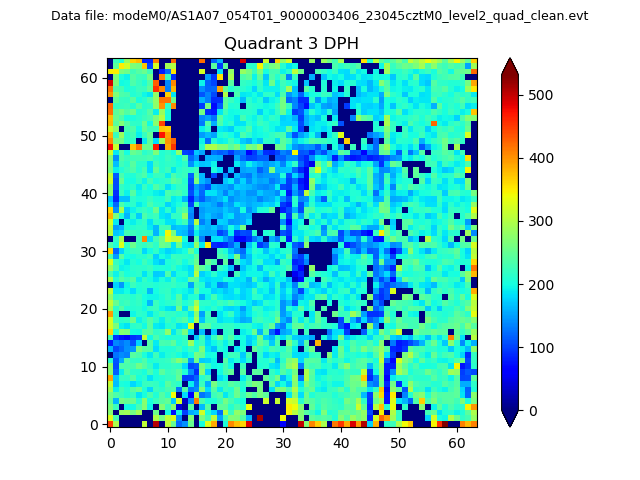 |
 |
Quadrant C |
| Plot type | Count rate plots | Images |
|---|---|---|
| Comparison with Poisson distribution Blue bars denote a histogram of data divided into 1 sec bins. Red curve is a Poisson curve with rate = median count rate of data. |
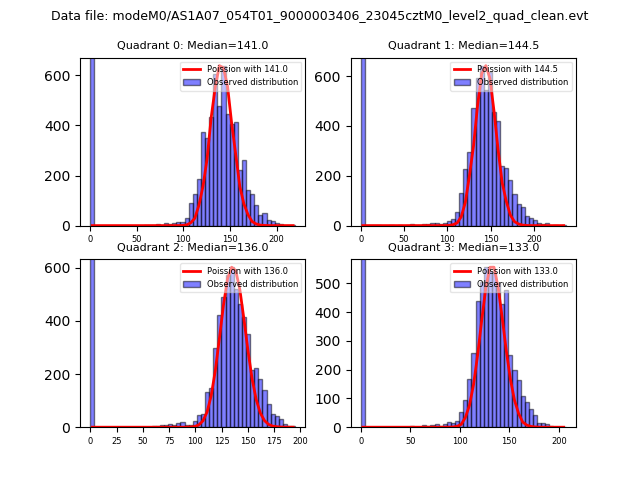 |
 |
| Quadrant-wise count rates Data is divided into 100 sec bins |
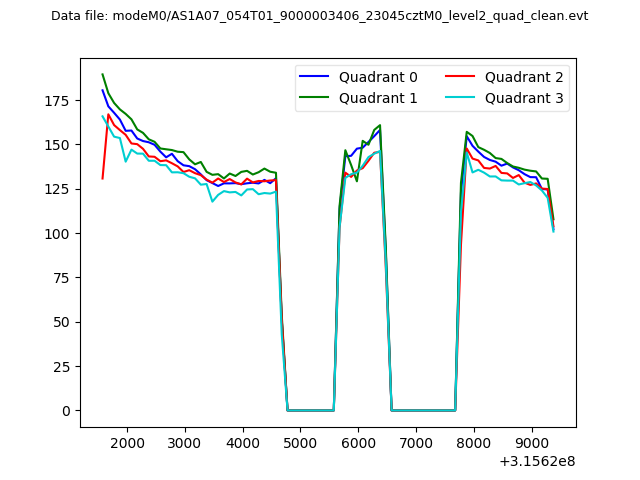 |
|
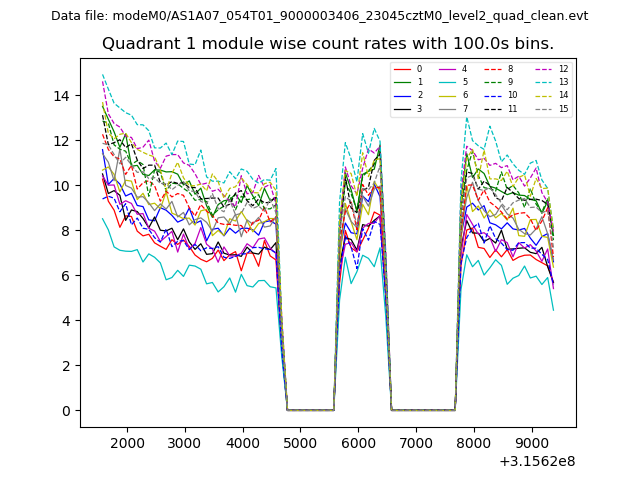
| Module-wise count rates for Quadrant A Data is divided into 100 sec bins |
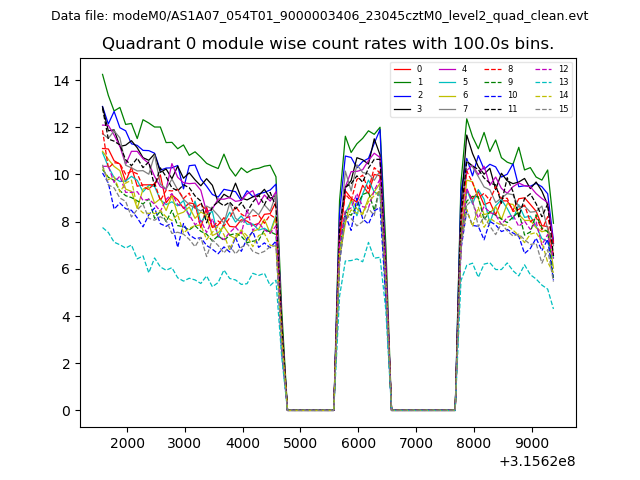 |
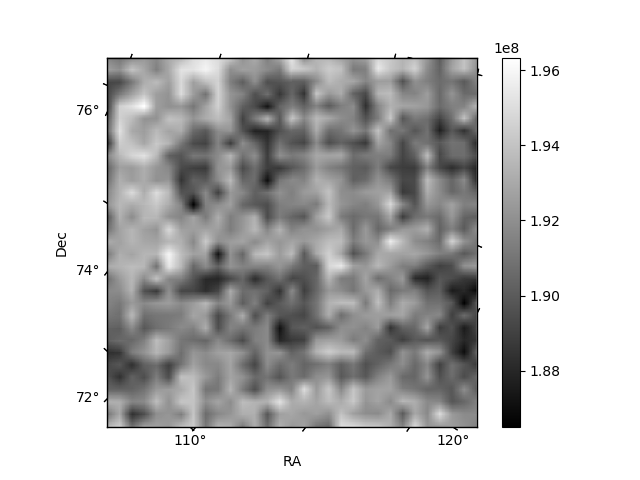 |
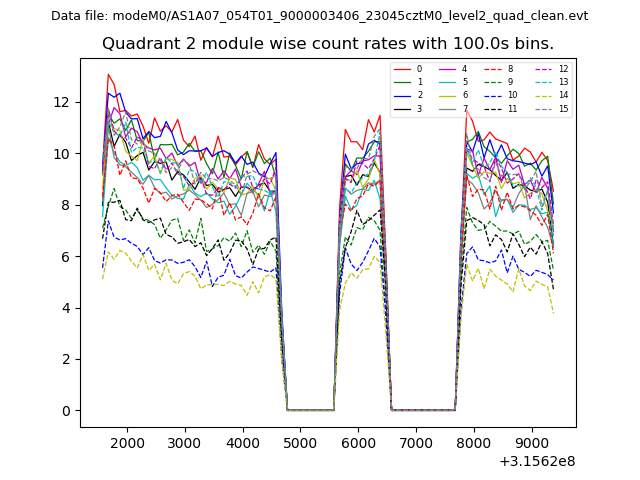
| Module-wise count rates for Quadrant B Data is divided into 100 sec bins |
 |
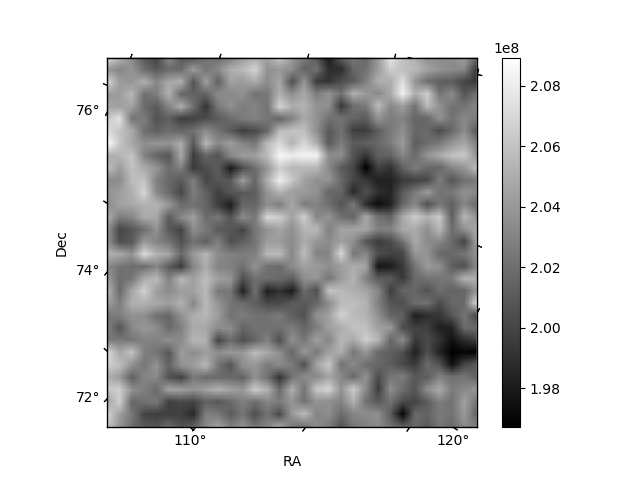 |
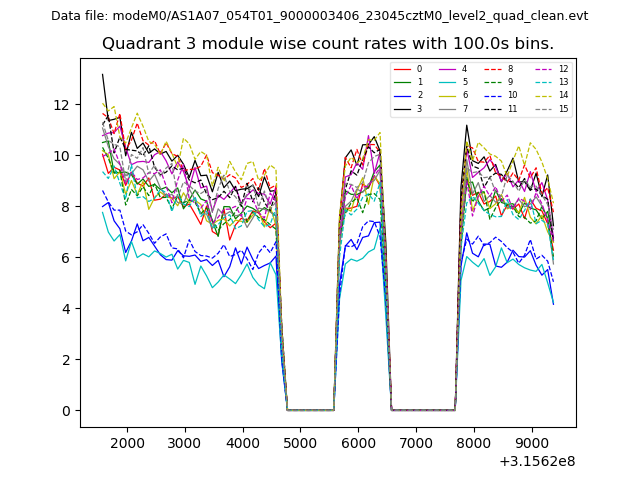
| Module-wise count rates for Quadrant C Data is divided into 100 sec bins |
 |
 |
| Module-wise count rates for Quadrant D Data is divided into 100 sec bins |
 |
 |
| Parameter | Plot |
|---|---|
| CZT HV Monitor | 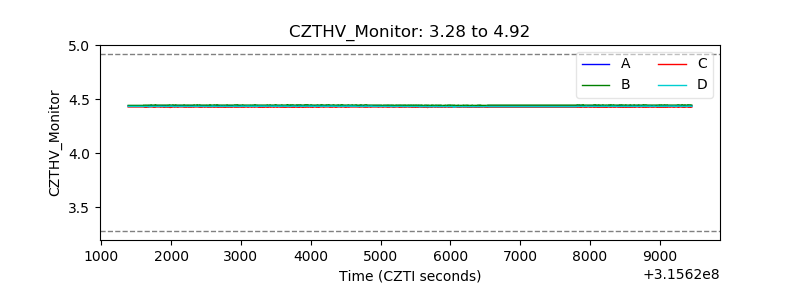 |
| D_VDD | 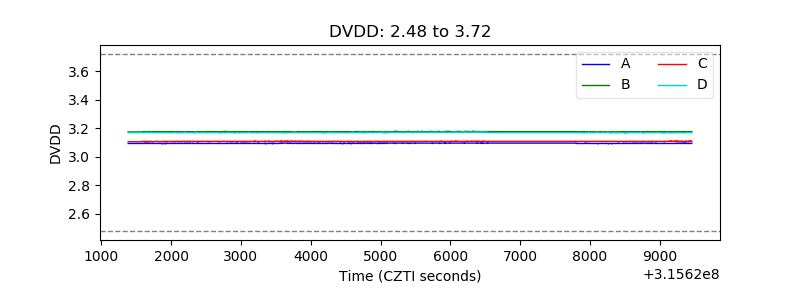 |
| Temperature 1 | 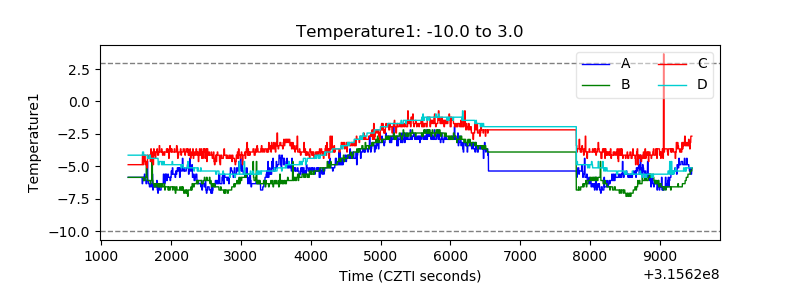 |
| Veto HV Monitor | 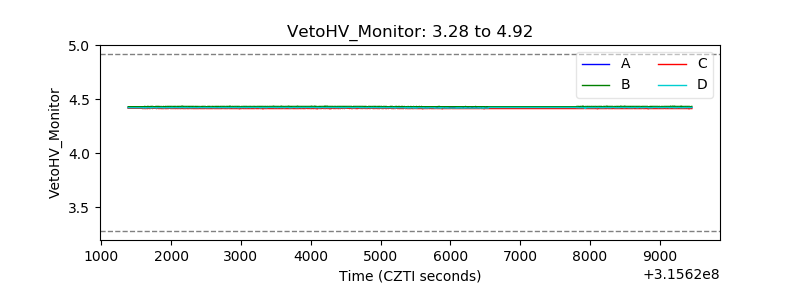 |
| Veto LLD | 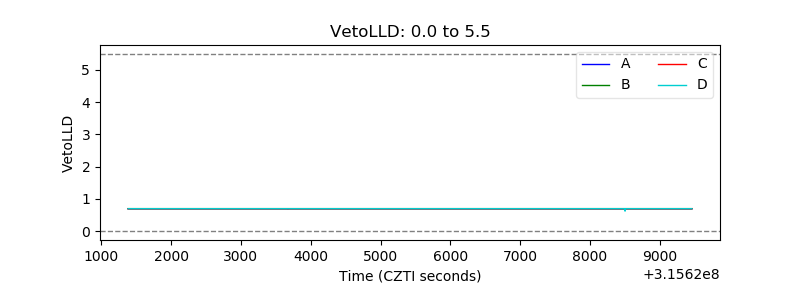 |
| Alpha Counter | 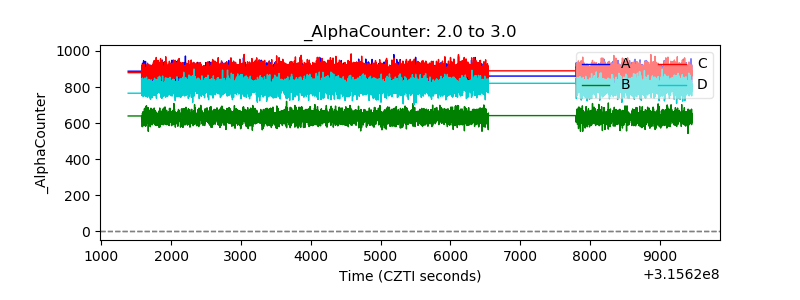 |
| _CPM_Rate | 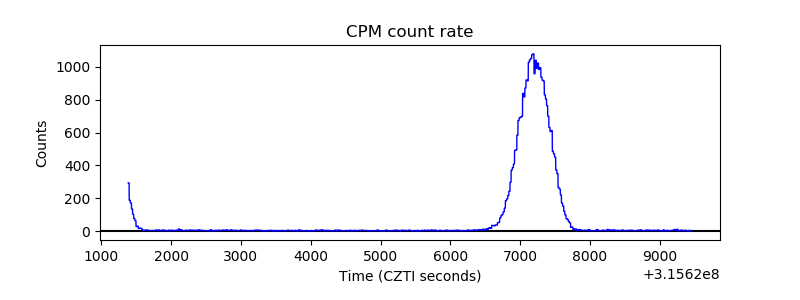 |
| CZT Counter | 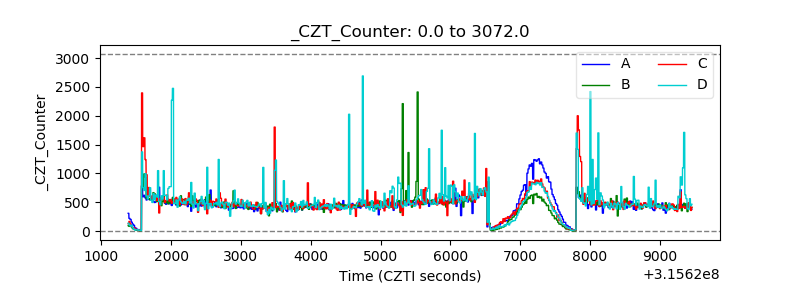 |
| +2.5 Volts monitor |  |
| +5 Volts monitor |  |
| _ROLL_ROT |  |
| _Roll_DEC | 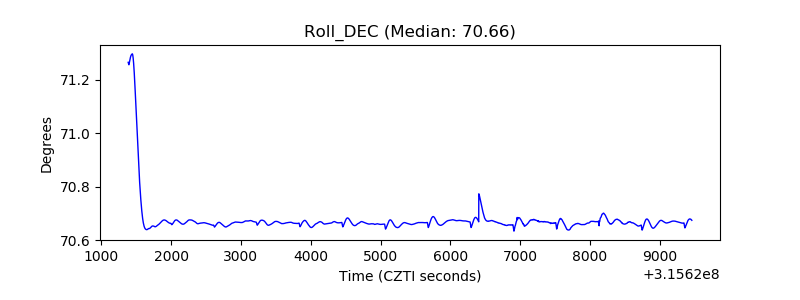 |
| _Roll_RA | 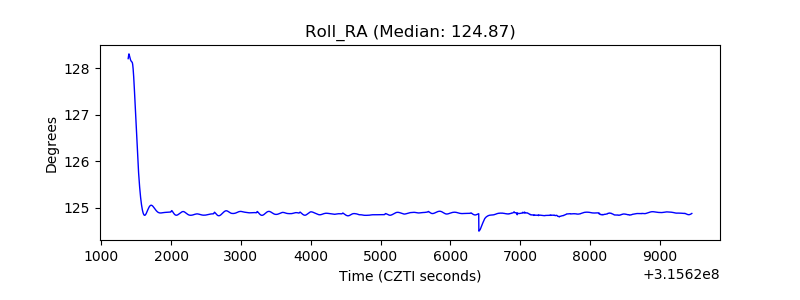 |
| Veto Counter |  |