| Param | Original file | Final file |
|---|---|---|
| Filename | modeM0/AS1A07_054T01_9000003406_23046cztM0_level2.evt | modeM0/AS1A07_054T01_9000003406_23046cztM0_level2_quad_clean.evt |
| Size (bytes) | 461,427,840 | 109,535,040 |
| Size | 440.1 MB | 104.5 MB |
| Events in quadrant A | 3,108,510 | 723,897 |
| Events in quadrant B | 3,418,885 | 744,315 |
| Events in quadrant C | 3,049,729 | 708,041 |
| Events in quadrant D | 3,954,215 | 686,629 |
| Mode M0 | |||
|---|---|---|---|
| Quadrant | BADHDUFLAG | Total packets | Discarded packets |
| A | 0 | 13734 | 1 |
| B | 0 | 14490 | 2 |
| C | 0 | 13460 | 1 |
| D | 0 | 16267 | 1 |
| Mode SS | |||
|---|---|---|---|
| Quadrant | BADHDUFLAG | Total packets | Discarded packets |
| A | 0 | 130 | 0 |
| B | 0 | 130 | 0 |
| C | 0 | 130 | 0 |
| D | 0 | 130 | 0 |
| Mode M9 | |||
|---|---|---|---|
| Quadrant | BADHDUFLAG | Total packets | Discarded packets |
| A | 0 | 10 | 0 |
| B | 0 | 10 | 0 |
| C | 0 | 10 | 0 |
| D | 0 | 10 | 0 |
| Quadrant | Total seconds | Saturated seconds | Saturation percentage |
|---|---|---|---|
| A | 6526 | 71 | 1.087956% |
| B | 6525 | 149 | 2.283525% |
| C | 6525 | 67 | 1.026820% |
| D | 6525 | 245 | 3.754789% |
Noise dominated data is calculated using 1-second bins in cleaned event files. If a bin has >2000 counts, and if more than 50% of those come from <1% of pixels, then it is considered to be noise-dominated and hence unusable.
| Quadrant | # 1 sec bins | Bins with >0 counts | Bins with >2000 counts | High rate bins dominated by noise | Noise dominated (total time) | Noise dominated (detector-on time) | Marked lightcurve |
|---|---|---|---|---|---|---|---|
| A | 7451 | 6527 | 39 | 39 | 0.52% | 0.60% | 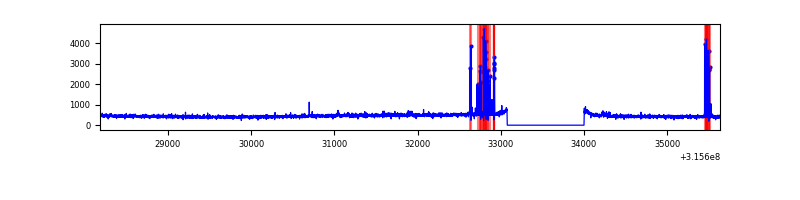 |
| B | 7450 | 6526 | 78 | 78 | 1.05% | 1.20% | 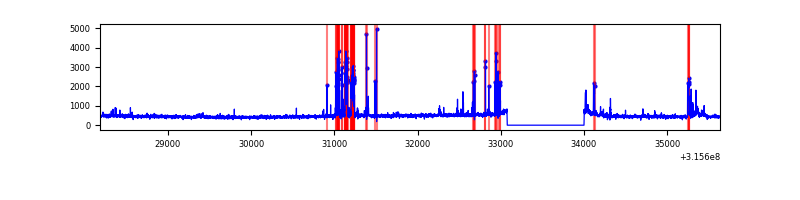 |
| C | 7450 | 6526 | 1 | 1 | 0.01% | 0.02% | 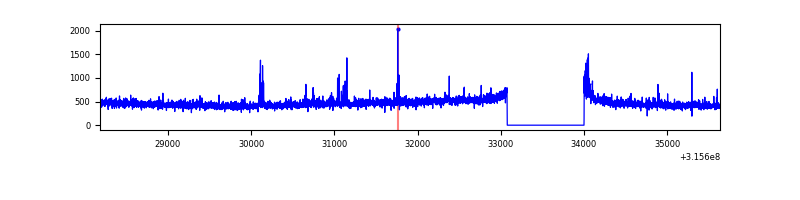 |
| D | 7450 | 6526 | 243 | 243 | 3.26% | 3.72% | 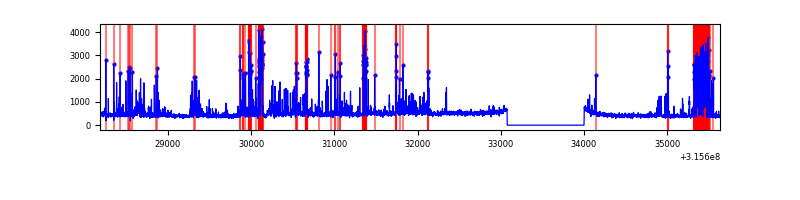 |
Top three noisy pixels from each quadrant. If the there are fewer than three noisy pixels in the level2.evt file, extra rows are filled as -1
| Pixel properties | Quadrant properties | ||||||
|---|---|---|---|---|---|---|---|
| Quadrant | DetID | PixID | Counts | Sigma | Mean | Median | Sigma |
| A | 6 | 16 | 167705 | 1108.11 | 757 | 743 | 150.7 |
| A | 2 | 79 | 24479 | 157.53 | 757 | 743 | 150.7 |
| A | 13 | 254 | 9594 | 58.74 | 757 | 743 | 150.7 |
| B | 10 | 247 | 202321 | 1412.2 | 758 | 740 | 142.7 |
| B | 3 | 64 | 94146 | 654.37 | 758 | 740 | 142.7 |
| B | 4 | 216 | 58438 | 404.21 | 758 | 740 | 142.7 |
| C | 14 | 238 | 117945 | 695.1 | 728 | 732 | 168.6 |
| C | 0 | 207 | 56386 | 330.04 | 728 | 732 | 168.6 |
| C | 0 | 10 | 32653 | 189.3 | 728 | 732 | 168.6 |
| D | 1 | 52 | 955447 | 5467.45 | 724 | 703 | 174.6 |
| D | 5 | 222 | 169454 | 966.37 | 724 | 703 | 174.6 |
| D | 13 | 153 | 34864 | 195.62 | 724 | 703 | 174.6 |
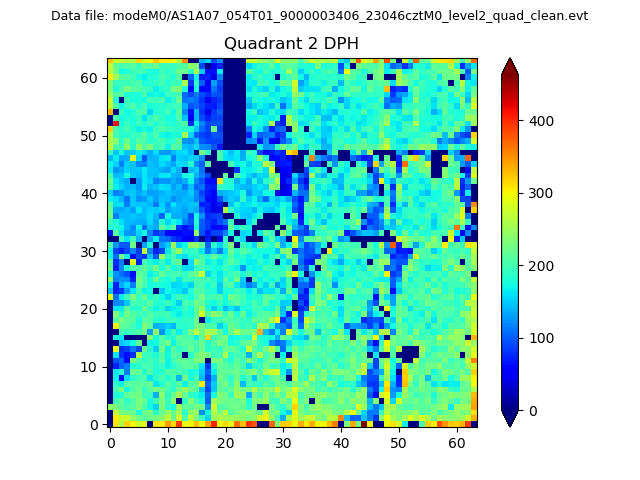
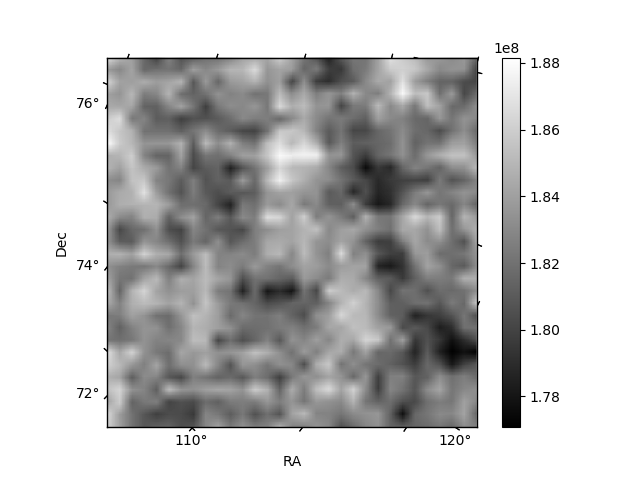
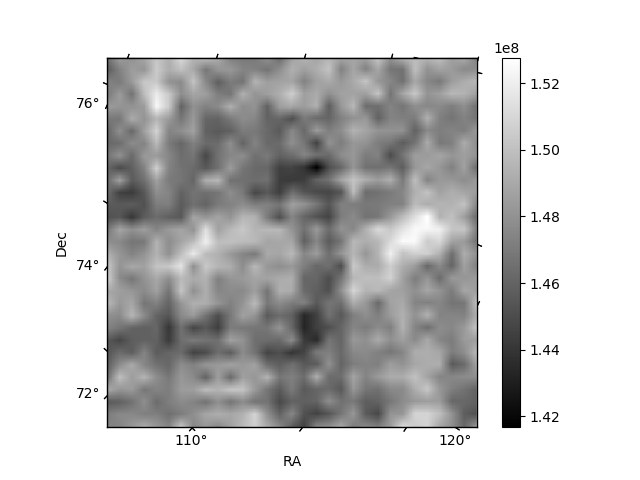
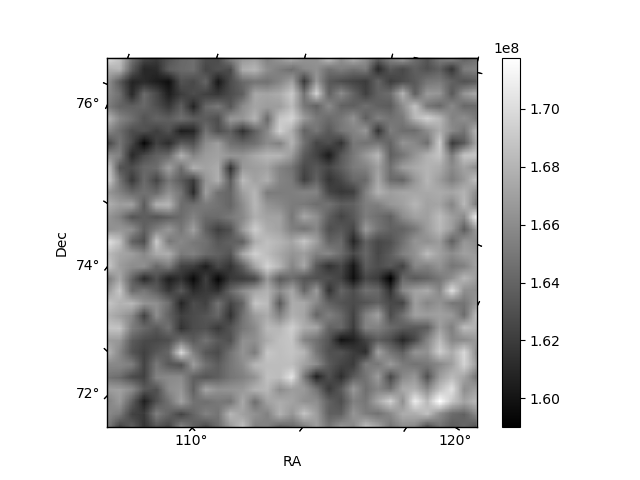
Histogram calculated using DETX and DETY for each event in the final _common_clean file
| Quadrant A | 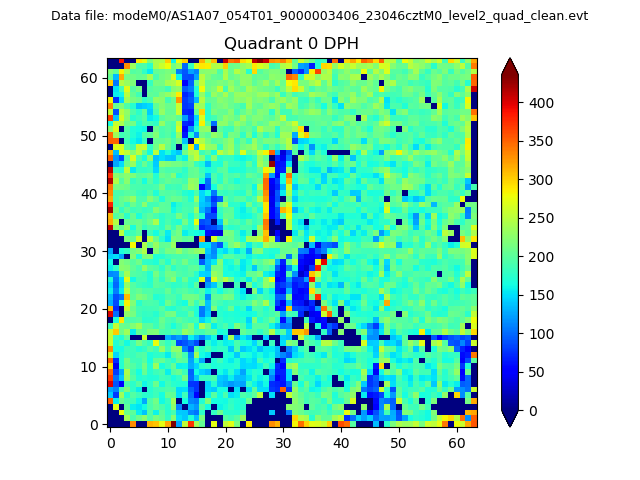 |
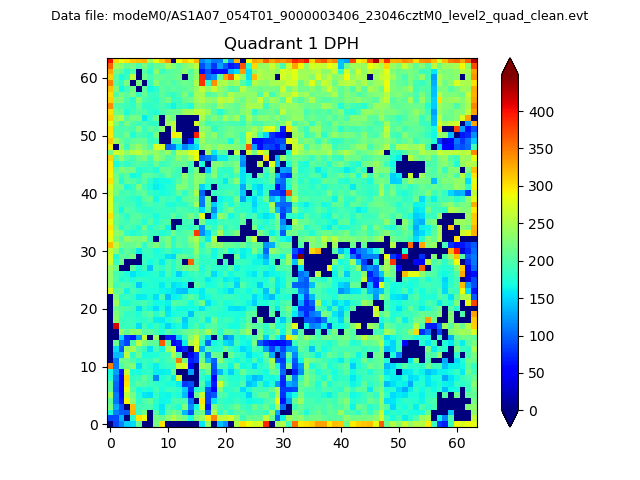 |
Quadrant B |
|---|---|---|---|
| Quadrant D | 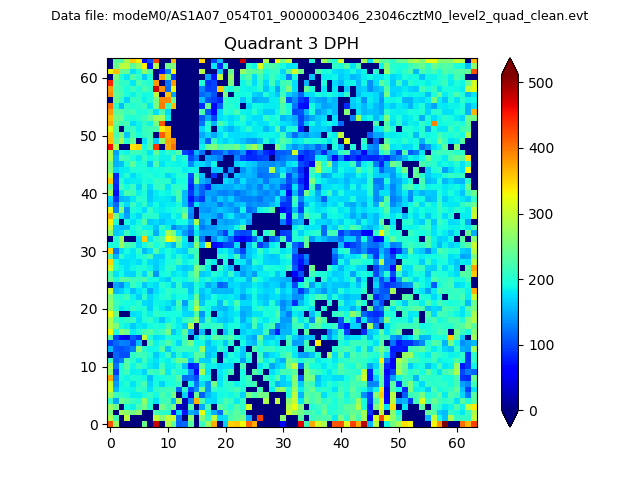 |
 |
Quadrant C |
| Plot type | Count rate plots | Images |
|---|---|---|
| Comparison with Poisson distribution Blue bars denote a histogram of data divided into 1 sec bins. Red curve is a Poisson curve with rate = median count rate of data. |
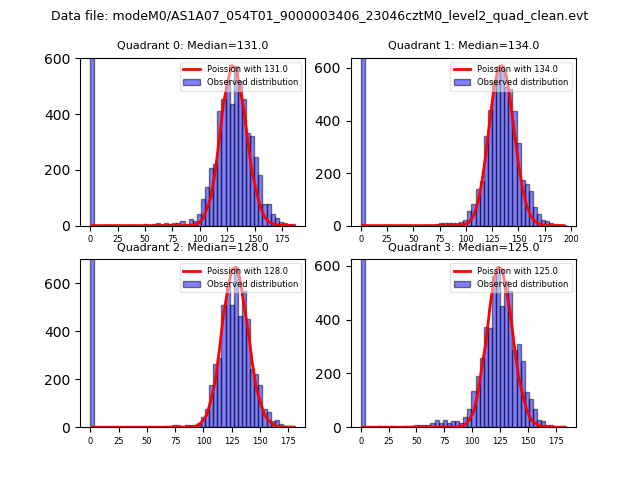 |
 |
| Quadrant-wise count rates Data is divided into 100 sec bins |
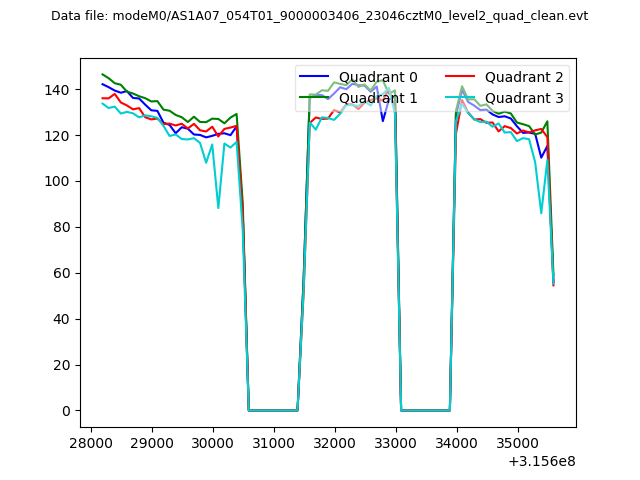 |
|
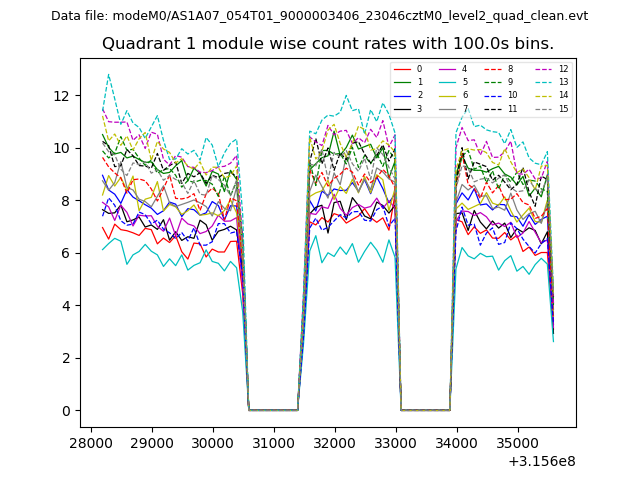
| Module-wise count rates for Quadrant A Data is divided into 100 sec bins |
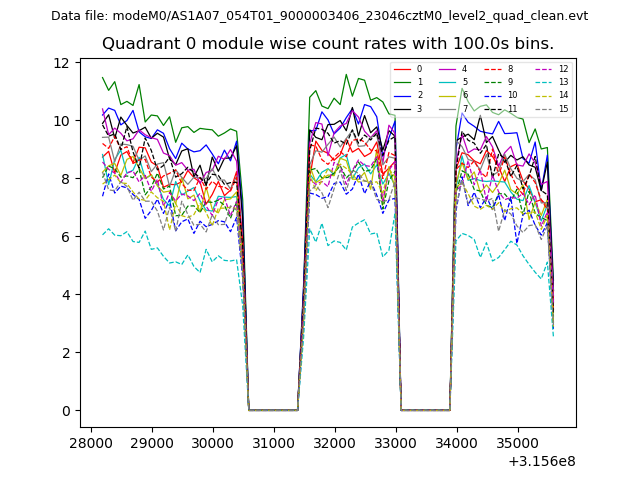 |
 |
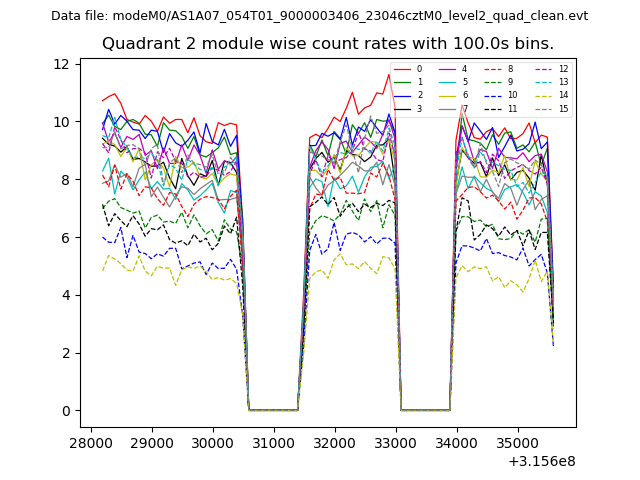
| Module-wise count rates for Quadrant B Data is divided into 100 sec bins |
 |
 |
| Module-wise count rates for Quadrant C Data is divided into 100 sec bins |
 |
 |
| Module-wise count rates for Quadrant D Data is divided into 100 sec bins |
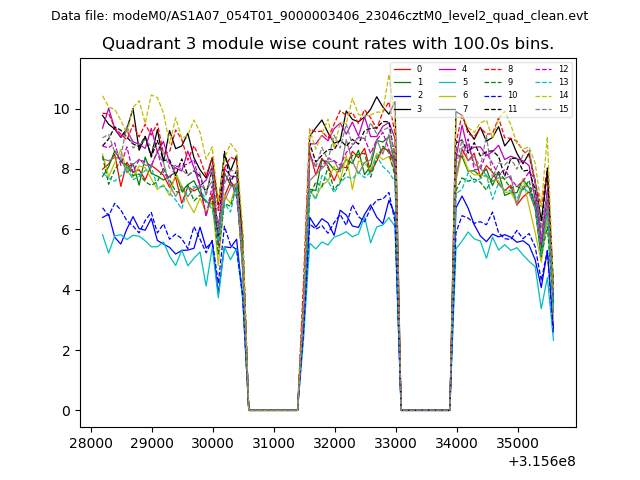 |
 |
| Parameter | Plot |
|---|---|
| CZT HV Monitor | 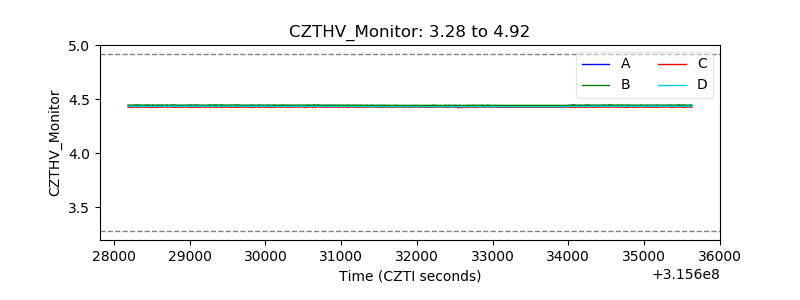 |
| D_VDD | 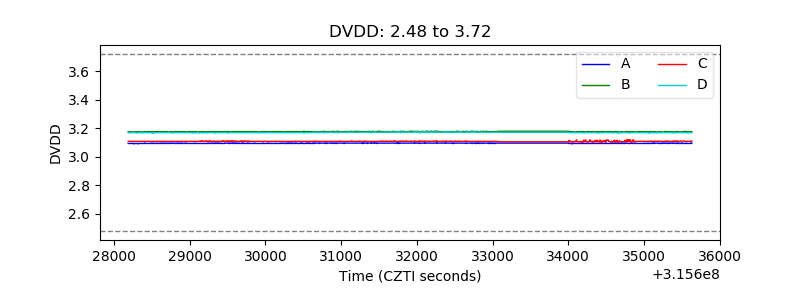 |
| Temperature 1 | 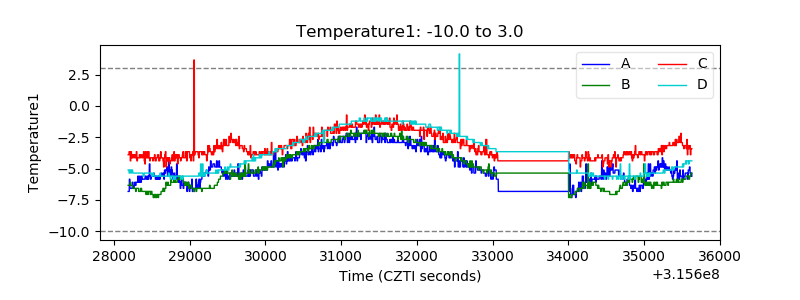 |
| Veto HV Monitor | 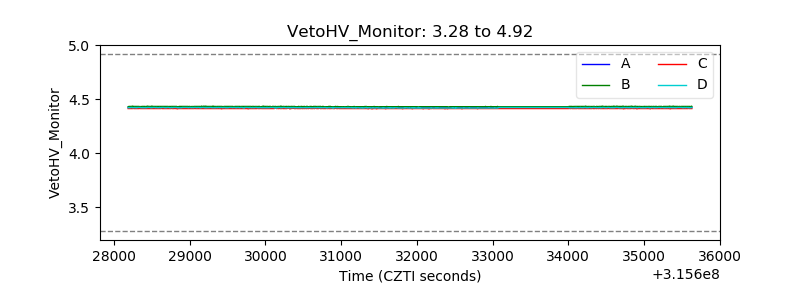 |
| Veto LLD | 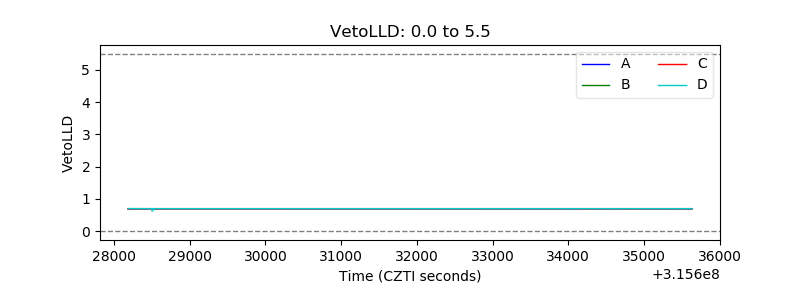 |
| Alpha Counter | 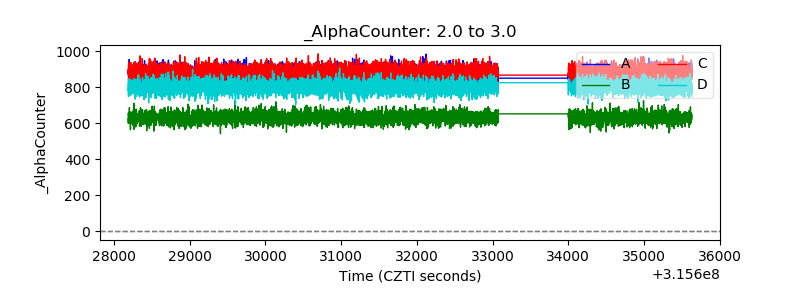 |
| _CPM_Rate | 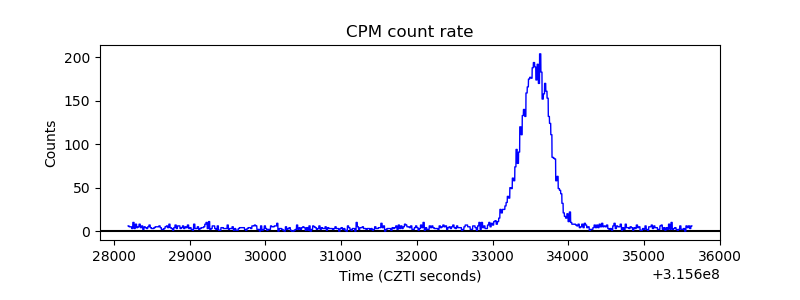 |
| CZT Counter | 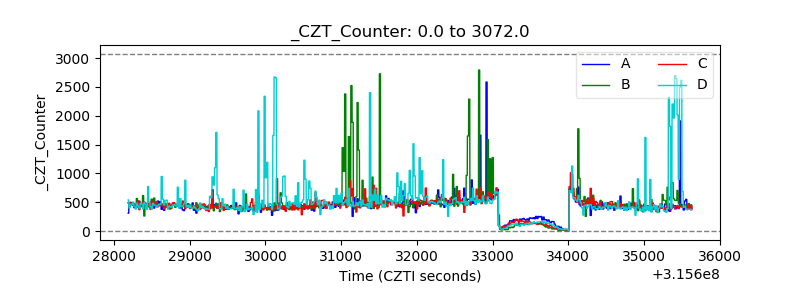 |
| +2.5 Volts monitor |  |
| +5 Volts monitor | 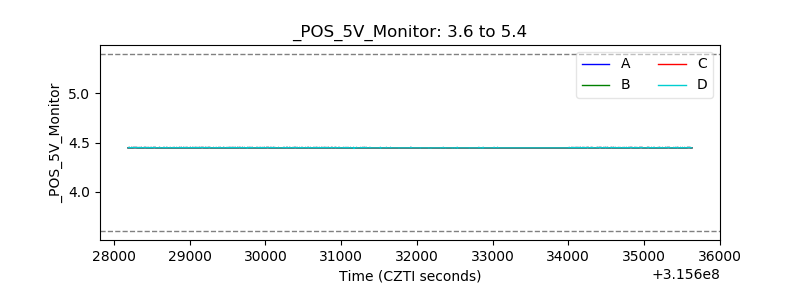 |
| _ROLL_ROT | 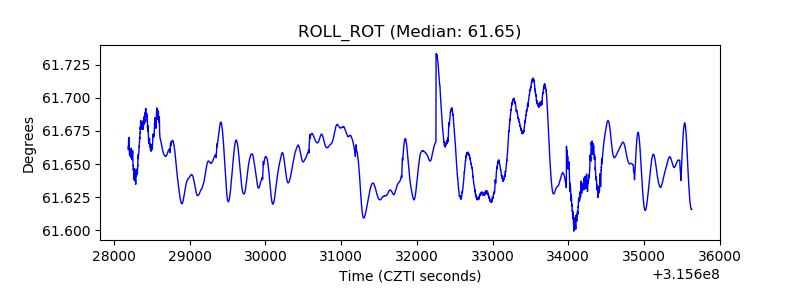 |
| _Roll_DEC | 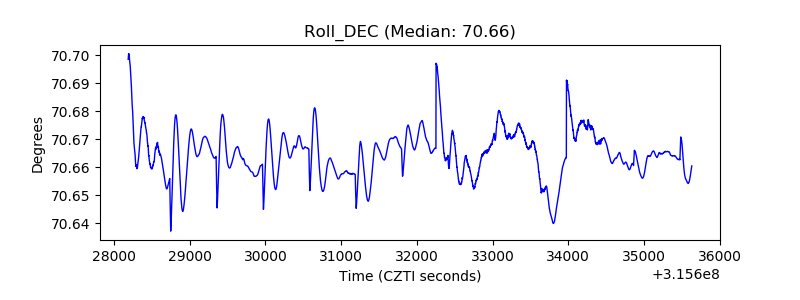 |
| _Roll_RA | 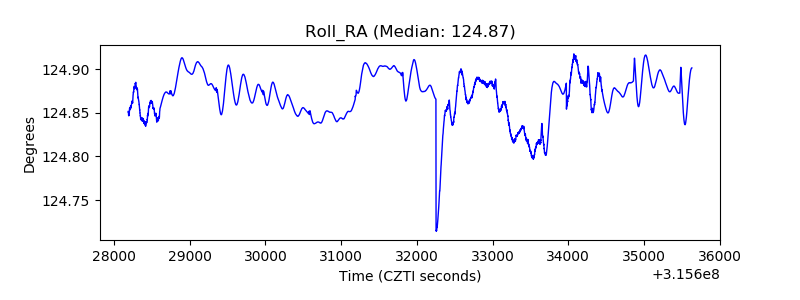 |
| Veto Counter | 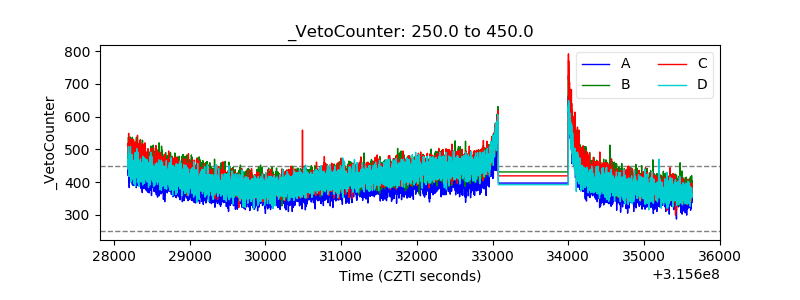 |