| Param | Original file | Final file |
|---|---|---|
| Filename | modeM0/AS1A07_054T01_9000003406_23048cztM0_level2.evt | modeM0/AS1A07_054T01_9000003406_23048cztM0_level2_quad_clean.evt |
| Size (bytes) | 479,946,240 | 116,205,120 |
| Size | 457.7 MB | 110.8 MB |
| Events in quadrant A | 3,242,476 | 764,850 |
| Events in quadrant B | 3,403,200 | 781,349 |
| Events in quadrant C | 3,309,878 | 746,870 |
| Events in quadrant D | 4,095,204 | 730,086 |
| Mode M0 | |||
|---|---|---|---|
| Quadrant | BADHDUFLAG | Total packets | Discarded packets |
| A | 0 | 14605 | 1 |
| B | 0 | 14887 | 1 |
| C | 0 | 14634 | 1 |
| D | 0 | 17244 | 1 |
| Mode SS | |||
|---|---|---|---|
| Quadrant | BADHDUFLAG | Total packets | Discarded packets |
| A | 0 | 144 | 0 |
| B | 0 | 144 | 0 |
| C | 0 | 144 | 0 |
| D | 0 | 144 | 0 |
| Mode M9 | |||
|---|---|---|---|
| Quadrant | BADHDUFLAG | Total packets | Discarded packets |
| A | 0 | 1 | 0 |
| B | 0 | 1 | 0 |
| C | 0 | 1 | 0 |
| D | 0 | 1 | 0 |
| Quadrant | Total seconds | Saturated seconds | Saturation percentage |
|---|---|---|---|
| A | 7126 | 184 | 2.582094% |
| B | 7127 | 212 | 2.974604% |
| C | 7127 | 188 | 2.637856% |
| D | 7127 | 157 | 2.202890% |
Noise dominated data is calculated using 1-second bins in cleaned event files. If a bin has >2000 counts, and if more than 50% of those come from <1% of pixels, then it is considered to be noise-dominated and hence unusable.
| Quadrant | # 1 sec bins | Bins with >0 counts | Bins with >2000 counts | High rate bins dominated by noise | Noise dominated (total time) | Noise dominated (detector-on time) | Marked lightcurve |
|---|---|---|---|---|---|---|---|
| A | 7176 | 7127 | 0 | 0 | 0.00% | 0.00% | 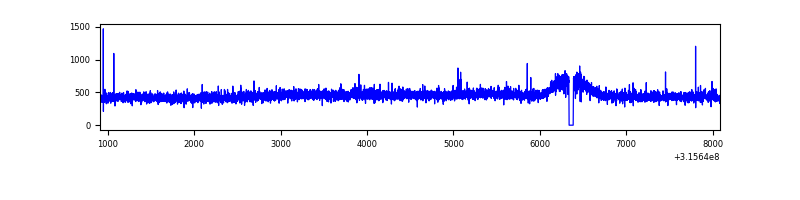 |
| B | 7177 | 7128 | 8 | 8 | 0.11% | 0.11% | 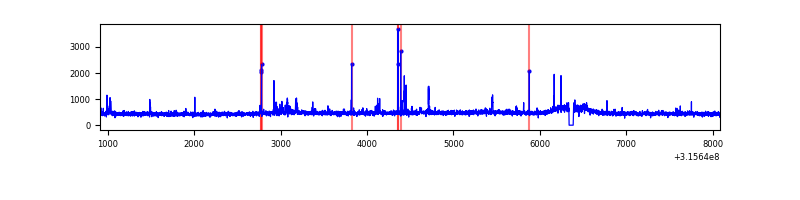 |
| C | 7177 | 7128 | 0 | 0 | 0.00% | 0.00% | 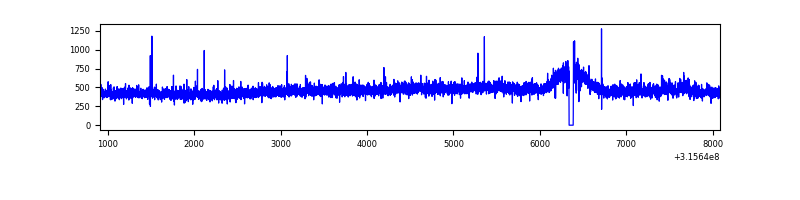 |
| D | 7177 | 7128 | 42 | 42 | 0.59% | 0.59% | 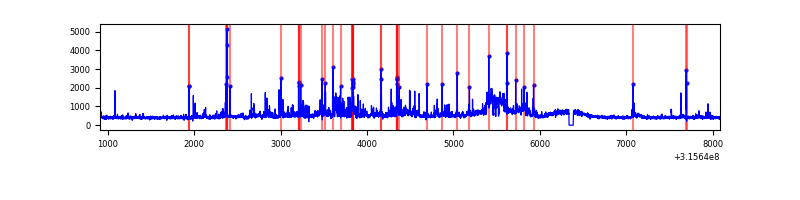 |
Top three noisy pixels from each quadrant. If the there are fewer than three noisy pixels in the level2.evt file, extra rows are filled as -1
| Pixel properties | Quadrant properties | ||||||
|---|---|---|---|---|---|---|---|
| Quadrant | DetID | PixID | Counts | Sigma | Mean | Median | Sigma |
| A | 2 | 79 | 17868 | 101.24 | 833 | 813 | 168.5 |
| A | 13 | 254 | 9927 | 54.1 | 833 | 813 | 168.5 |
| A | 3 | 137 | 7532 | 39.89 | 833 | 813 | 168.5 |
| B | 0 | 190 | 35017 | 216.55 | 833 | 813 | 157.9 |
| B | 3 | 64 | 29607 | 182.3 | 833 | 813 | 157.9 |
| B | 4 | 216 | 22988 | 140.4 | 833 | 813 | 157.9 |
| C | 14 | 238 | 128545 | 685.01 | 797 | 800 | 186.5 |
| C | 3 | 233 | 48642 | 256.55 | 797 | 800 | 186.5 |
| C | 0 | 10 | 13706 | 69.21 | 797 | 800 | 186.5 |
| D | 1 | 52 | 468465 | 2387.49 | 807 | 781 | 195.9 |
| D | 13 | 174 | 275143 | 1400.6 | 807 | 781 | 195.9 |
| D | 13 | 153 | 149490 | 759.15 | 807 | 781 | 195.9 |
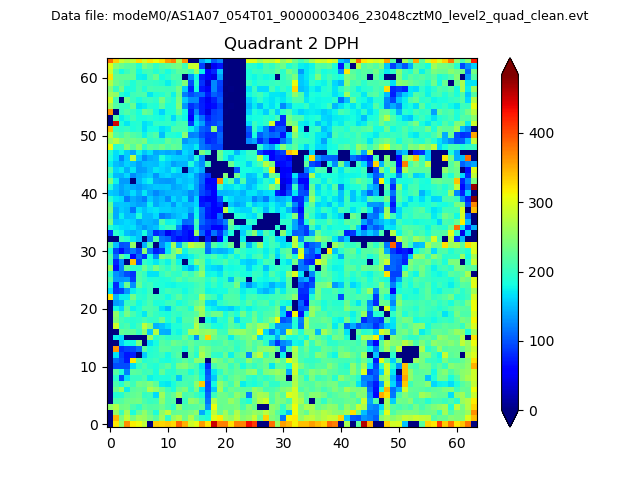
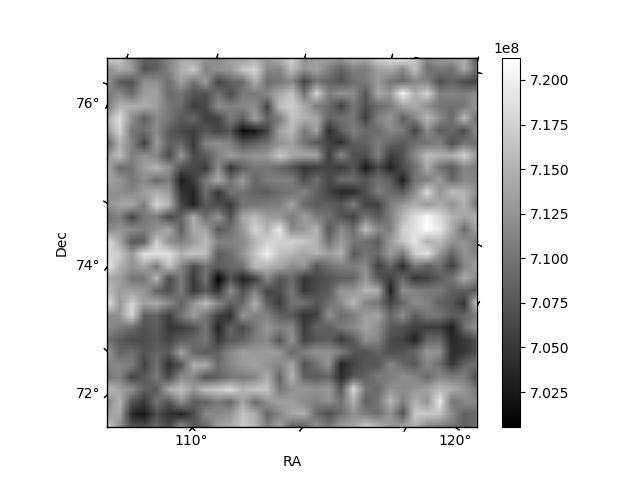
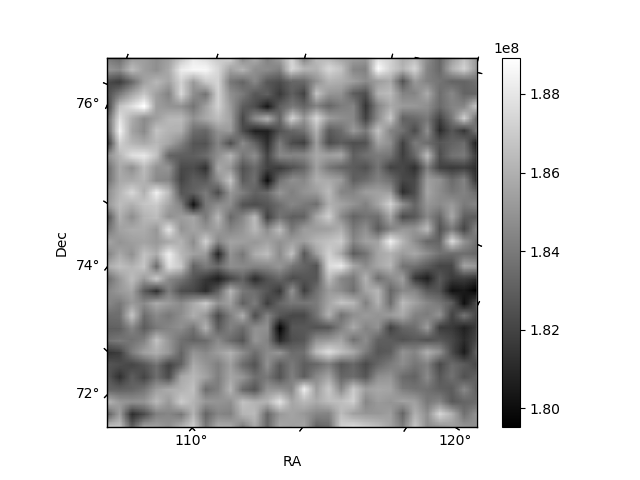
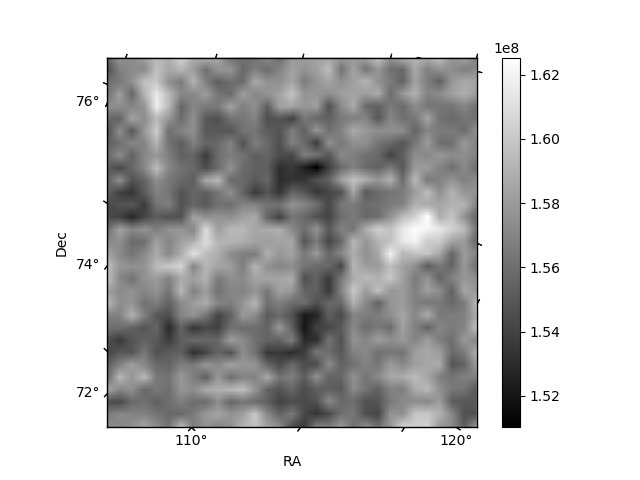
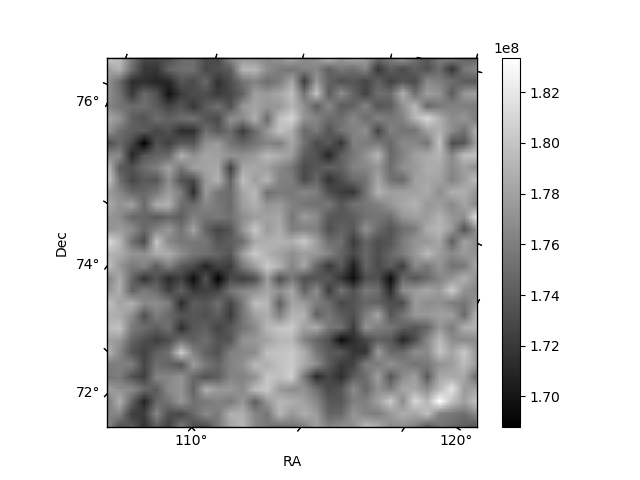
Histogram calculated using DETX and DETY for each event in the final _common_clean file
| Quadrant A | 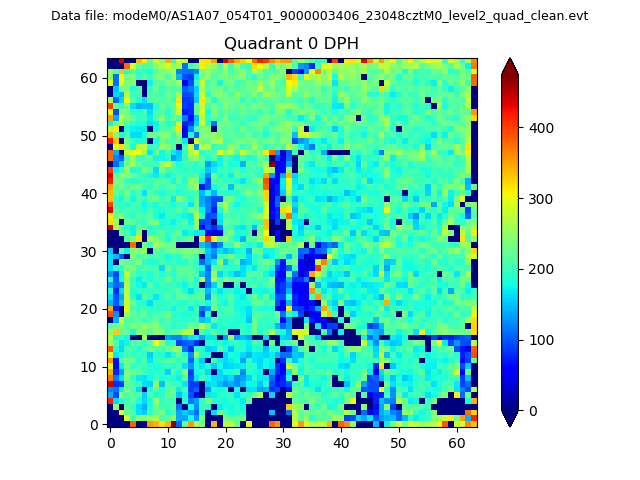 |
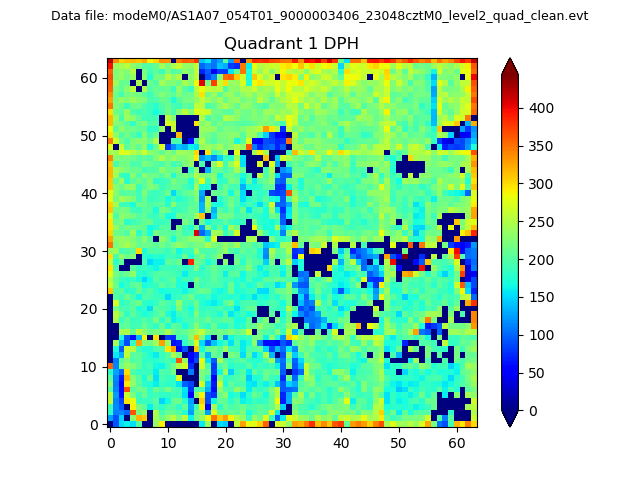 |
Quadrant B |
|---|---|---|---|
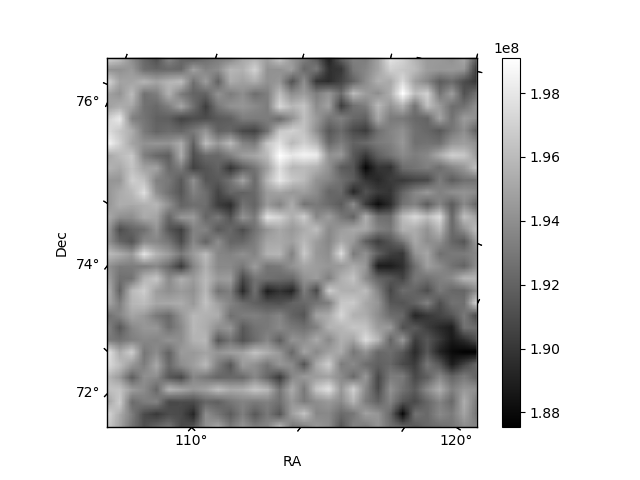
| Quadrant D | 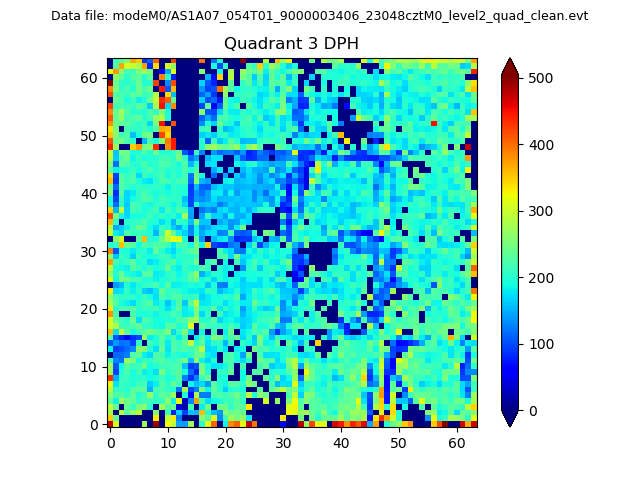 |
 |
Quadrant C |
| Plot type | Count rate plots | Images |
|---|---|---|
| Comparison with Poisson distribution Blue bars denote a histogram of data divided into 1 sec bins. Red curve is a Poisson curve with rate = median count rate of data. |
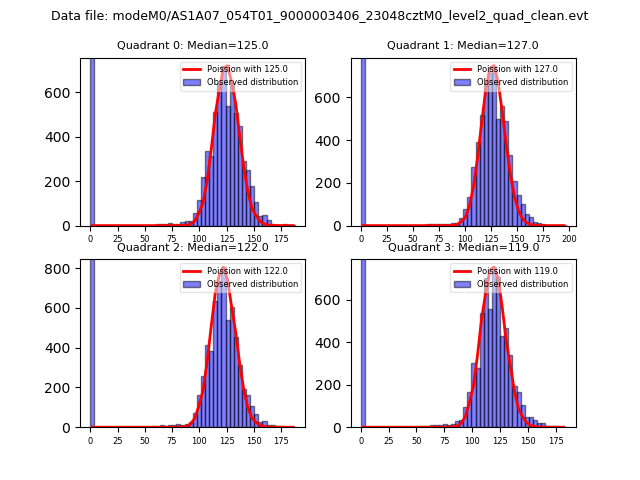 |
 |
| Quadrant-wise count rates Data is divided into 100 sec bins |
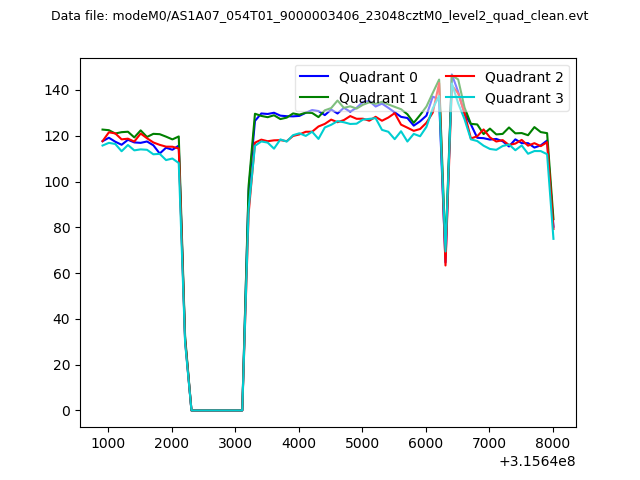 |
|
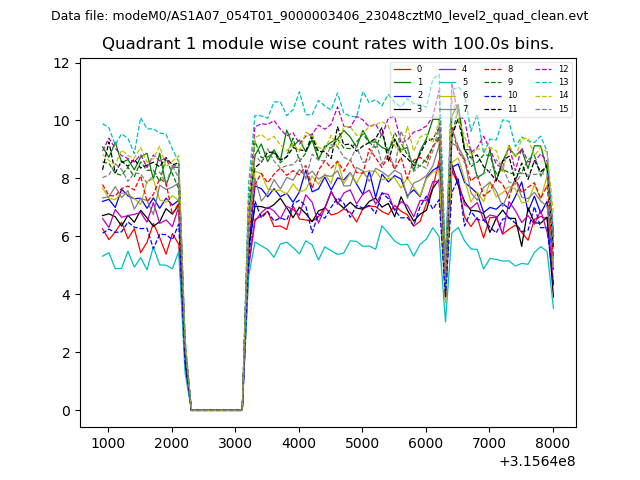
| Module-wise count rates for Quadrant A Data is divided into 100 sec bins |
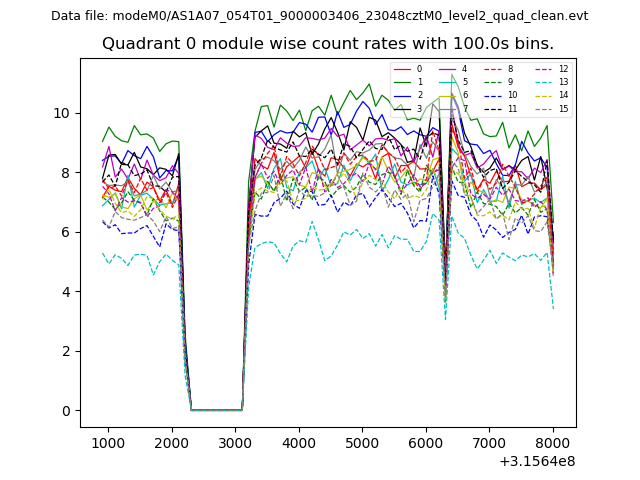 |
 |
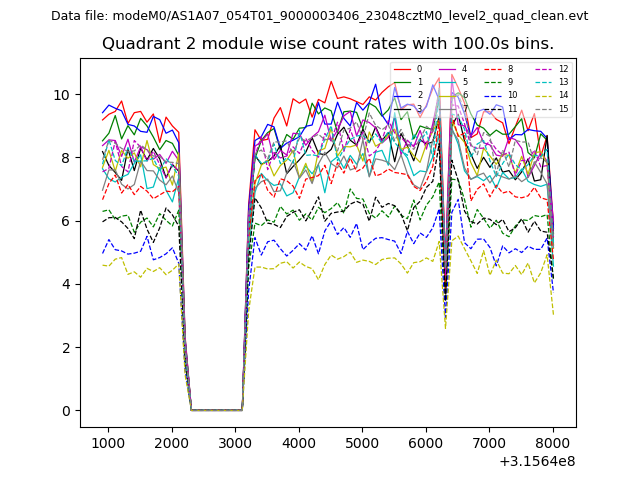
| Module-wise count rates for Quadrant B Data is divided into 100 sec bins |
 |
 |
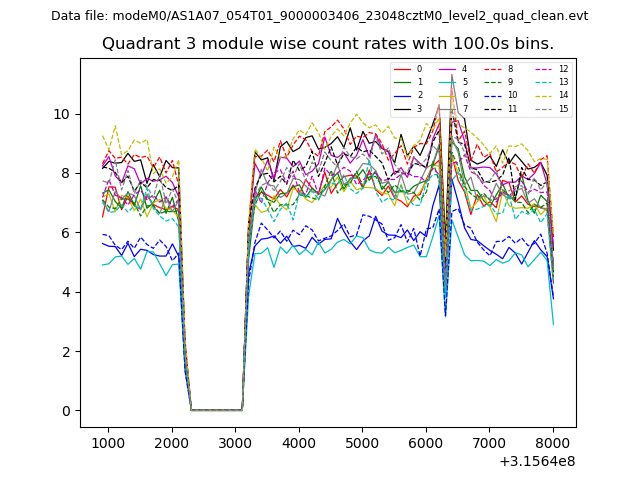
| Module-wise count rates for Quadrant C Data is divided into 100 sec bins |
 |
 |
| Module-wise count rates for Quadrant D Data is divided into 100 sec bins |
 |
 |
| Parameter | Plot |
|---|---|
| CZT HV Monitor | 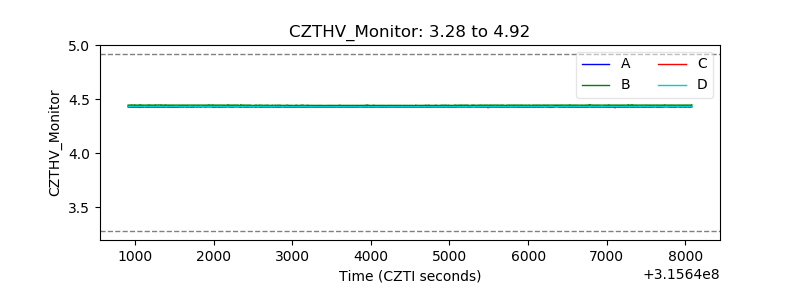 |
| D_VDD | 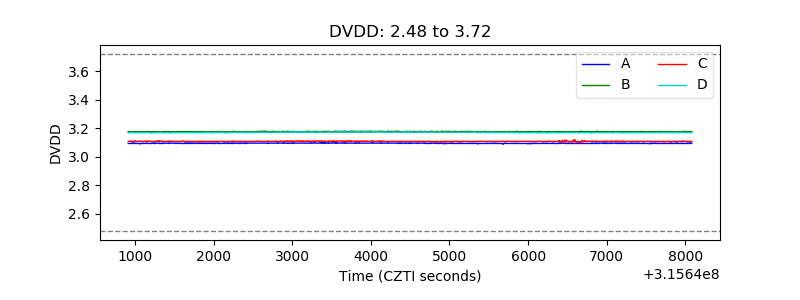 |
| Temperature 1 | 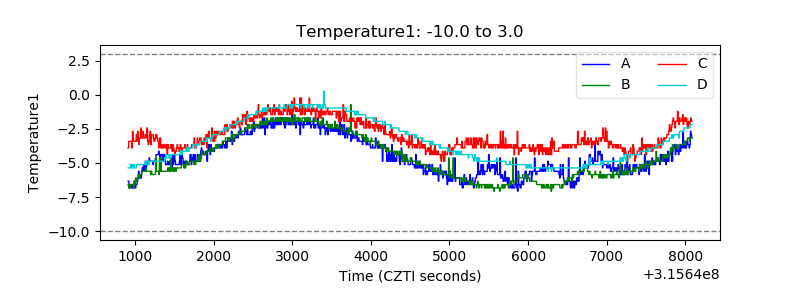 |
| Veto HV Monitor | 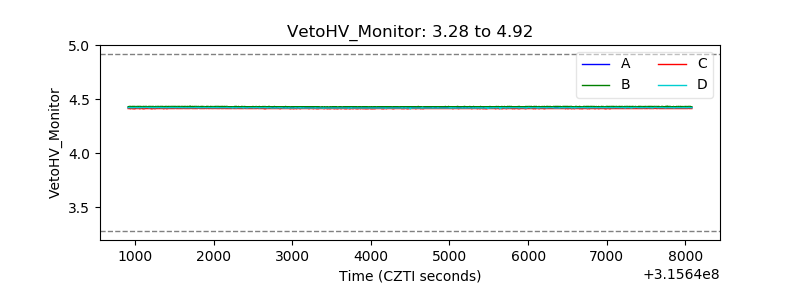 |
| Veto LLD | 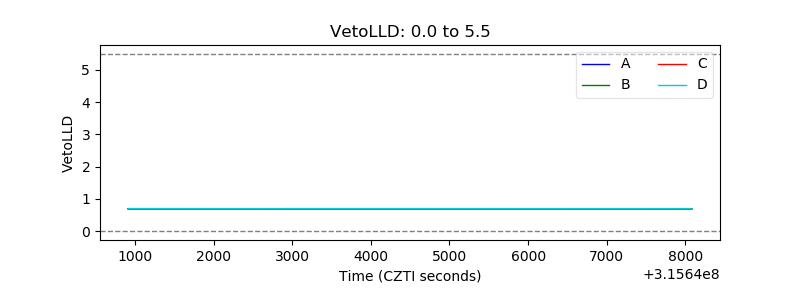 |
| Alpha Counter | 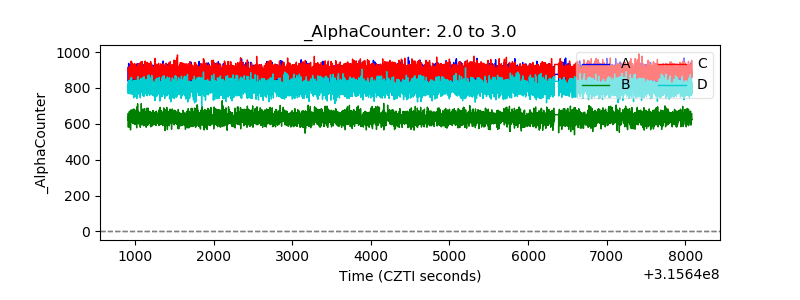 |
| _CPM_Rate | 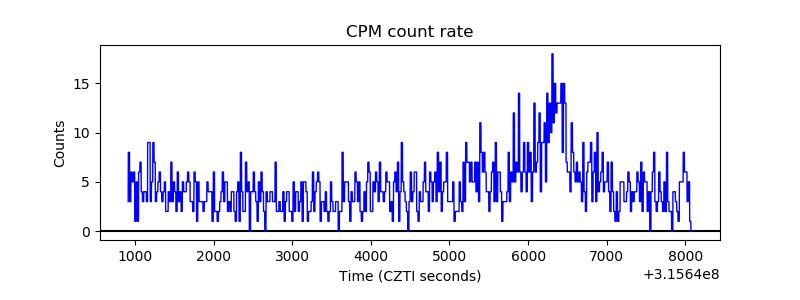 |
| CZT Counter | 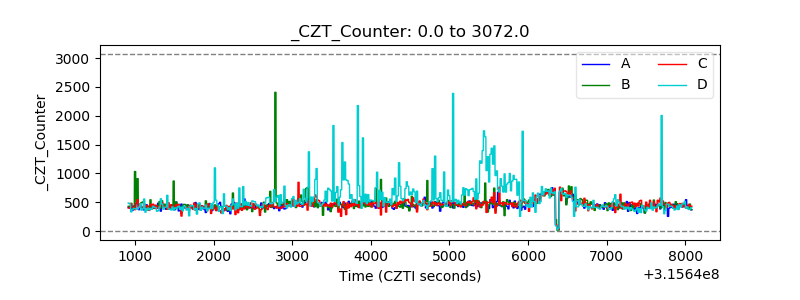 |
| +2.5 Volts monitor |  |
| +5 Volts monitor |  |
| _ROLL_ROT | 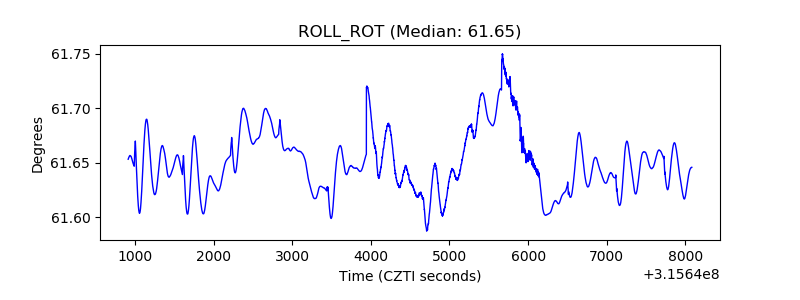 |
| _Roll_DEC | 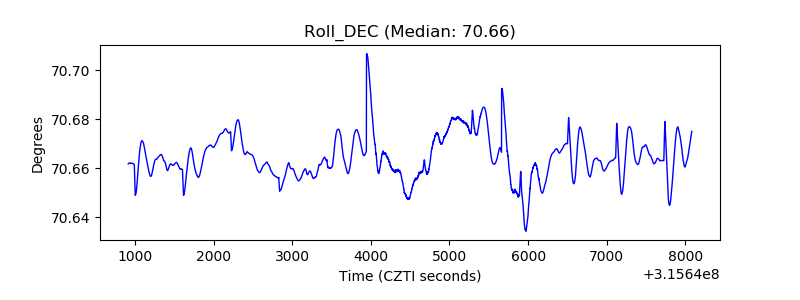 |
| _Roll_RA | 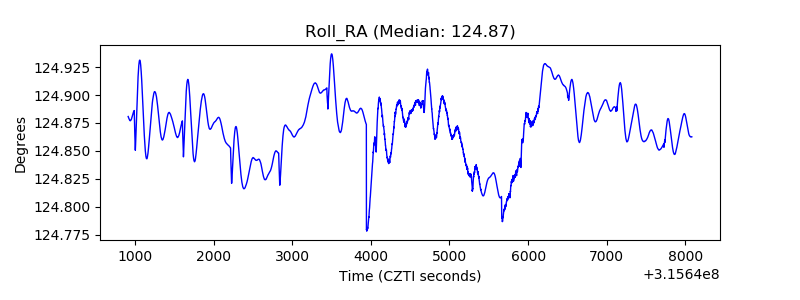 |
| Veto Counter | 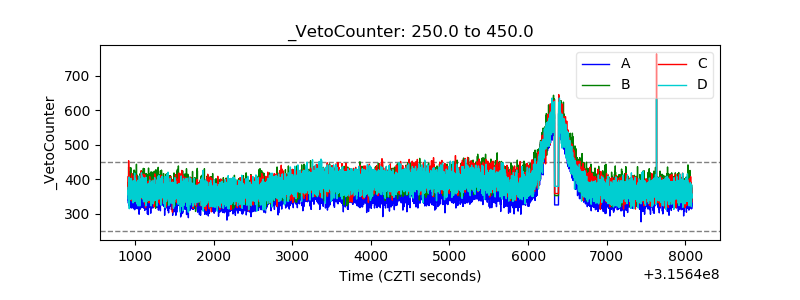 |