| Param | Original file | Final file |
|---|---|---|
| Filename | modeM0/AS1A07_054T01_9000003406_23049cztM0_level2.evt | modeM0/AS1A07_054T01_9000003406_23049cztM0_level2_quad_clean.evt |
| Size (bytes) | 487,445,760 | 107,254,080 |
| Size | 464.9 MB | 102.3 MB |
| Events in quadrant A | 3,267,732 | 697,874 |
| Events in quadrant B | 3,460,764 | 709,793 |
| Events in quadrant C | 3,456,273 | 673,082 |
| Events in quadrant D | 4,085,114 | 662,858 |
| Mode M0 | |||
|---|---|---|---|
| Quadrant | BADHDUFLAG | Total packets | Discarded packets |
| A | 0 | 14690 | 1 |
| B | 0 | 15031 | 1 |
| C | 0 | 14957 | 1 |
| D | 0 | 17121 | 1 |
| Mode SS | |||
|---|---|---|---|
| Quadrant | BADHDUFLAG | Total packets | Discarded packets |
| A | 0 | 146 | 0 |
| B | 0 | 146 | 0 |
| C | 0 | 146 | 0 |
| D | 0 | 146 | 0 |
| Mode M9 | |||
|---|---|---|---|
| Quadrant | BADHDUFLAG | Total packets | Discarded packets |
| A | 0 | 2 | 0 |
| B | 0 | 2 | 0 |
| C | 0 | 2 | 0 |
| D | 0 | 2 | 0 |
| Quadrant | Total seconds | Saturated seconds | Saturation percentage |
|---|---|---|---|
| A | 7245 | 154 | 2.125604% |
| B | 7245 | 189 | 2.608696% |
| C | 7245 | 184 | 2.539683% |
| D | 7246 | 282 | 3.891802% |
Noise dominated data is calculated using 1-second bins in cleaned event files. If a bin has >2000 counts, and if more than 50% of those come from <1% of pixels, then it is considered to be noise-dominated and hence unusable.
| Quadrant | # 1 sec bins | Bins with >0 counts | Bins with >2000 counts | High rate bins dominated by noise | Noise dominated (total time) | Noise dominated (detector-on time) | Marked lightcurve |
|---|---|---|---|---|---|---|---|
| A | 7430 | 7246 | 0 | 0 | 0.00% | 0.00% | 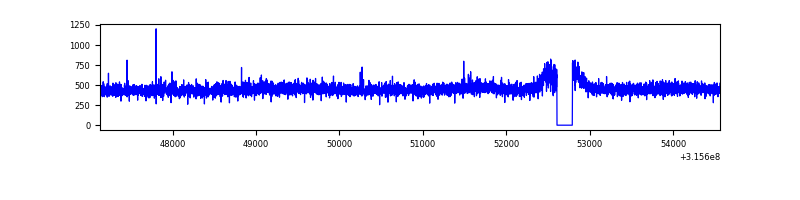 |
| B | 7430 | 7246 | 10 | 10 | 0.13% | 0.14% | 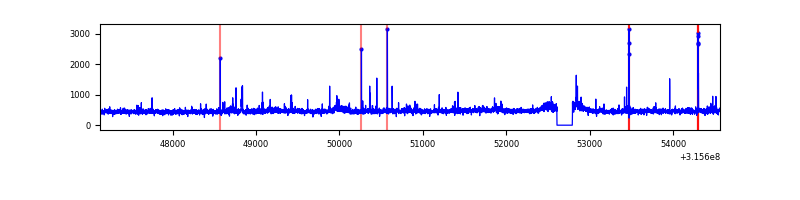 |
| C | 7430 | 7246 | 1 | 1 | 0.01% | 0.01% | 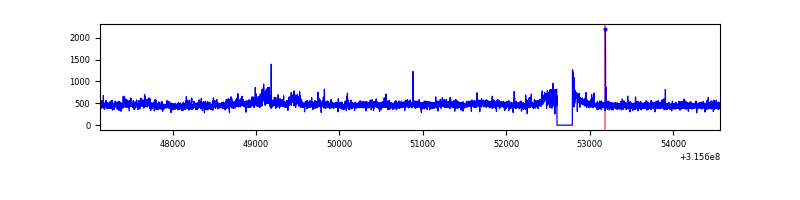 |
| D | 7431 | 7247 | 121 | 121 | 1.63% | 1.67% | 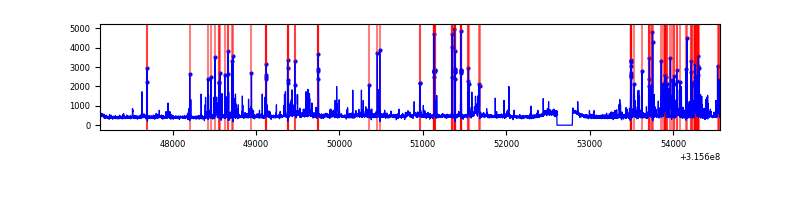 |
Top three noisy pixels from each quadrant. If the there are fewer than three noisy pixels in the level2.evt file, extra rows are filled as -1
| Pixel properties | Quadrant properties | ||||||
|---|---|---|---|---|---|---|---|
| Quadrant | DetID | PixID | Counts | Sigma | Mean | Median | Sigma |
| A | 13 | 254 | 11414 | 62.09 | 845 | 825 | 170.6 |
| A | 3 | 137 | 7677 | 40.17 | 845 | 825 | 170.6 |
| A | 0 | 226 | 7150 | 37.08 | 845 | 825 | 170.6 |
| B | 0 | 189 | 60829 | 370.76 | 843 | 821 | 161.9 |
| B | 4 | 216 | 30262 | 181.9 | 843 | 821 | 161.9 |
| B | 0 | 190 | 26386 | 157.95 | 843 | 821 | 161.9 |
| C | 3 | 233 | 130220 | 693.31 | 805 | 807 | 186.7 |
| C | 14 | 238 | 127654 | 679.56 | 805 | 807 | 186.7 |
| C | 0 | 10 | 17974 | 91.97 | 805 | 807 | 186.7 |
| D | 1 | 52 | 618526 | 3130.03 | 812 | 785 | 197.4 |
| D | 13 | 153 | 256847 | 1297.44 | 812 | 785 | 197.4 |
| D | 2 | 234 | 32211 | 159.23 | 812 | 785 | 197.4 |
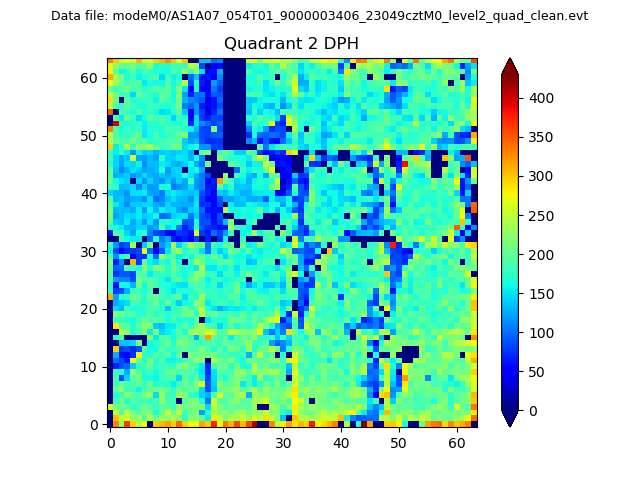
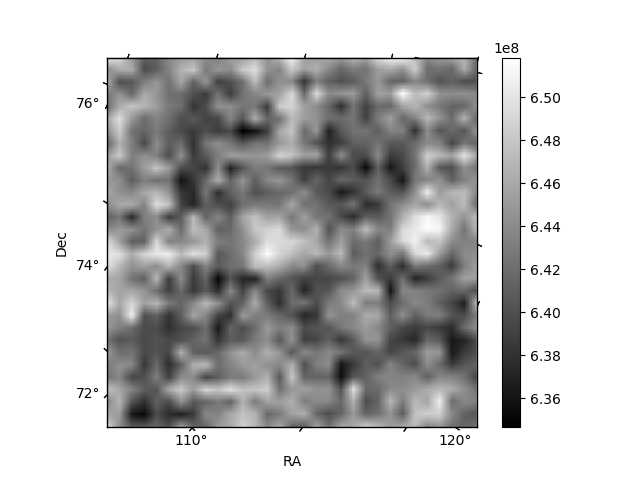
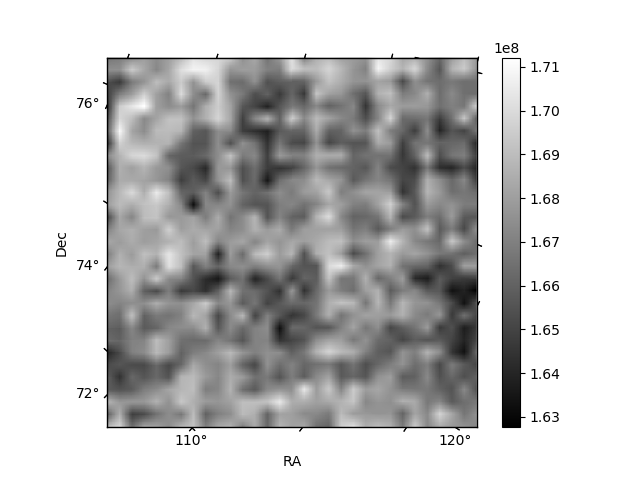
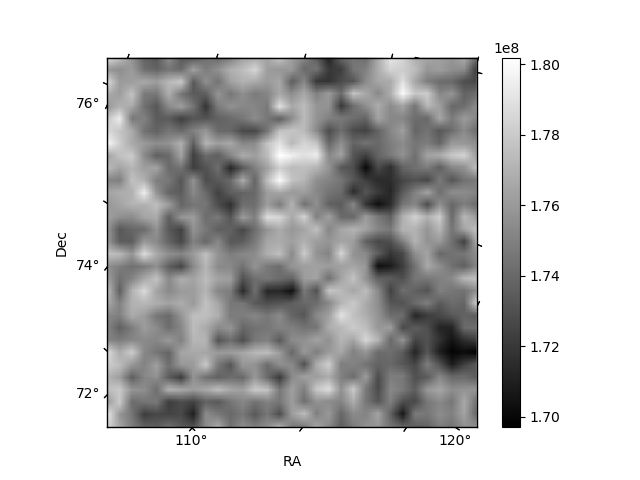
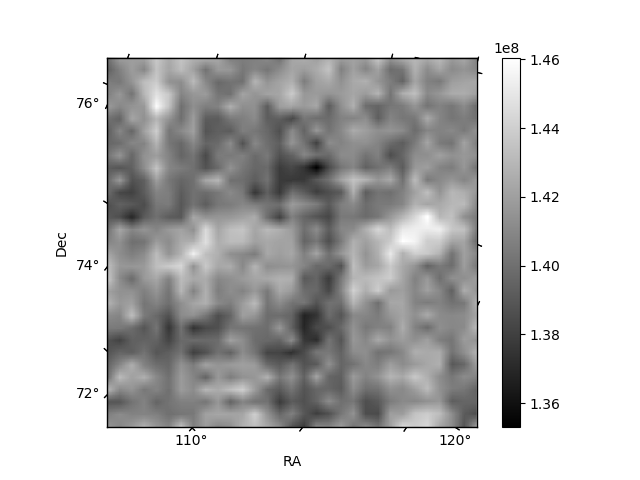
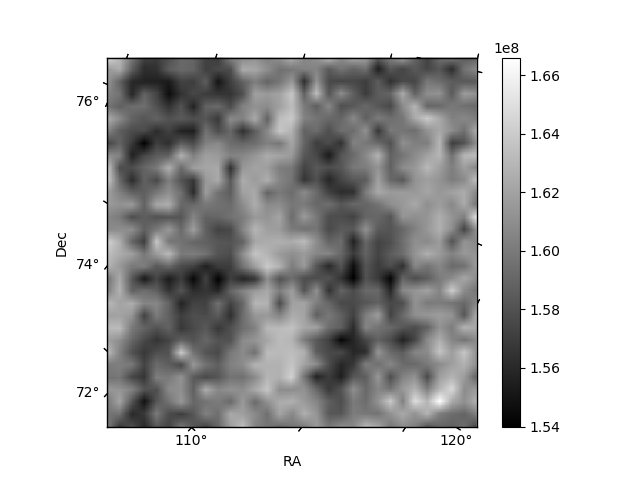
Histogram calculated using DETX and DETY for each event in the final _common_clean file
| Quadrant A | 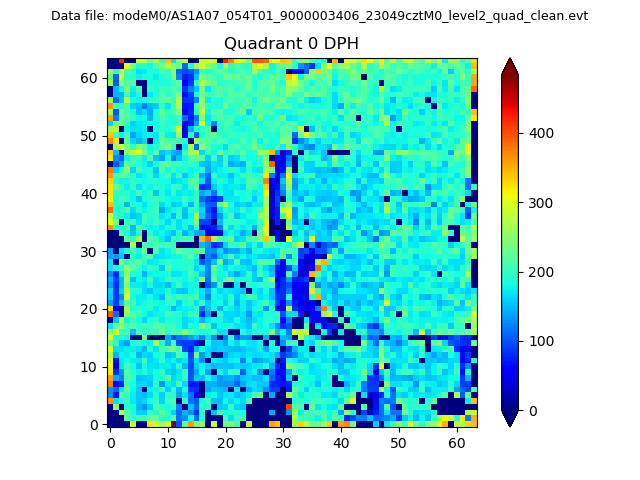 |
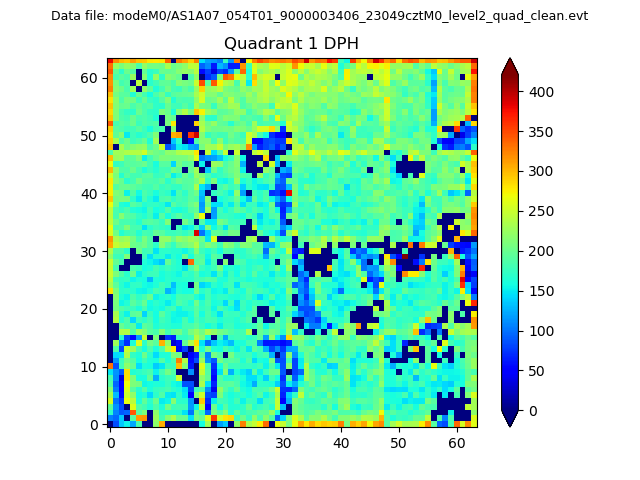 |
Quadrant B |
|---|---|---|---|
| Quadrant D | 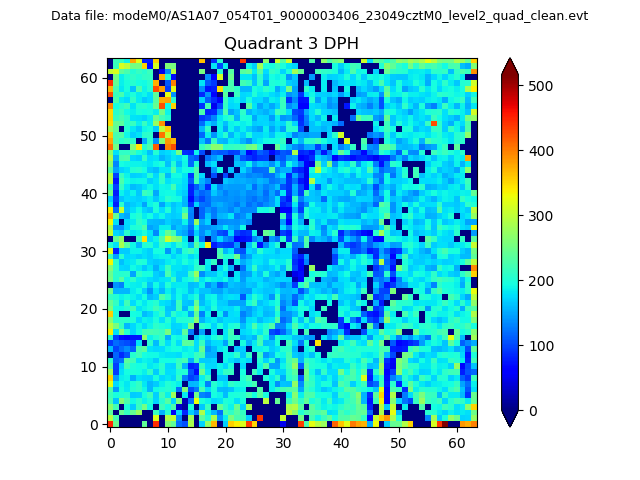 |
 |
Quadrant C |
| Plot type | Count rate plots | Images |
|---|---|---|
| Comparison with Poisson distribution Blue bars denote a histogram of data divided into 1 sec bins. Red curve is a Poisson curve with rate = median count rate of data. |
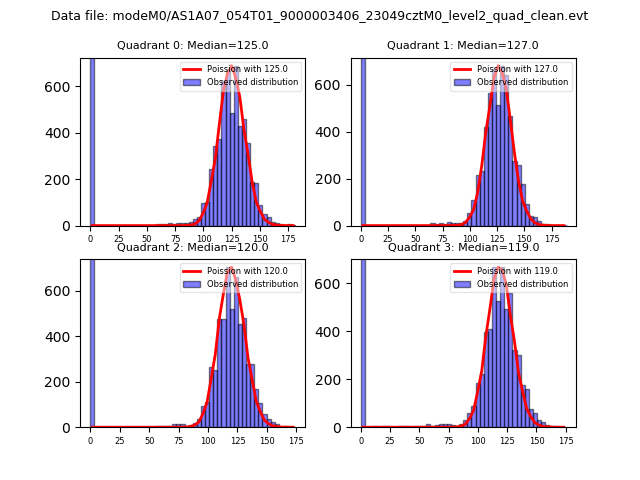 |
 |
| Quadrant-wise count rates Data is divided into 100 sec bins |
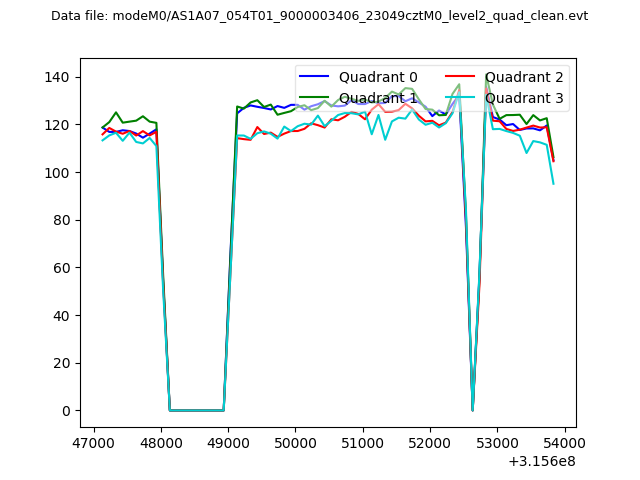 |
|
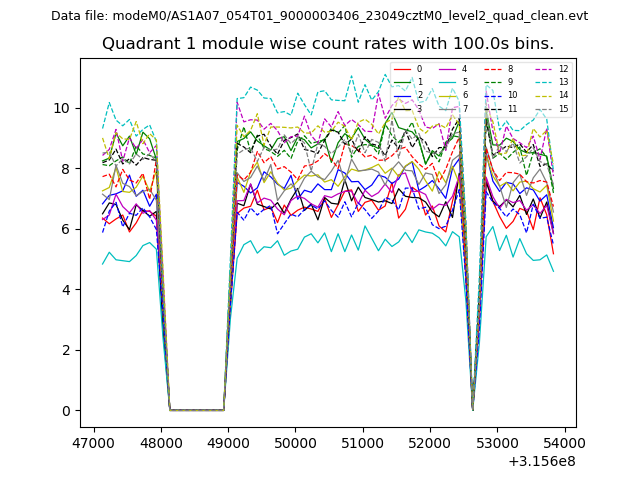
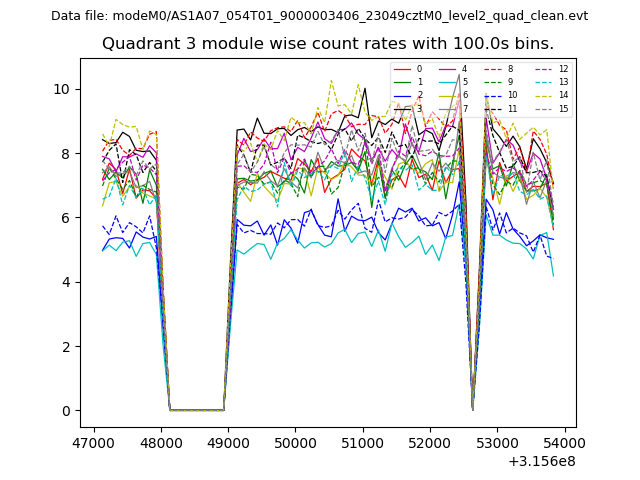
| Module-wise count rates for Quadrant A Data is divided into 100 sec bins |
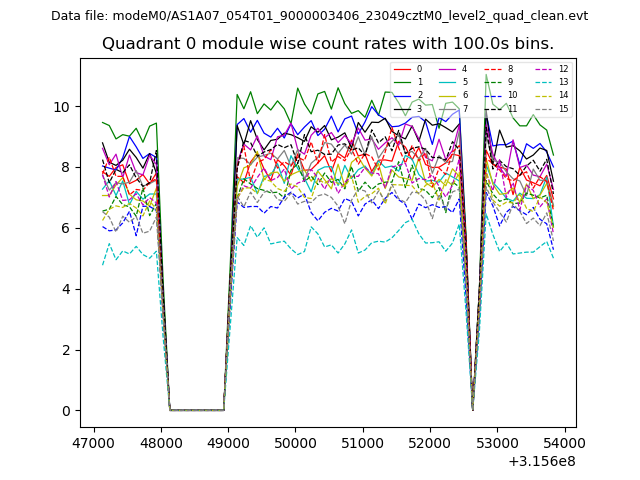 |
 |
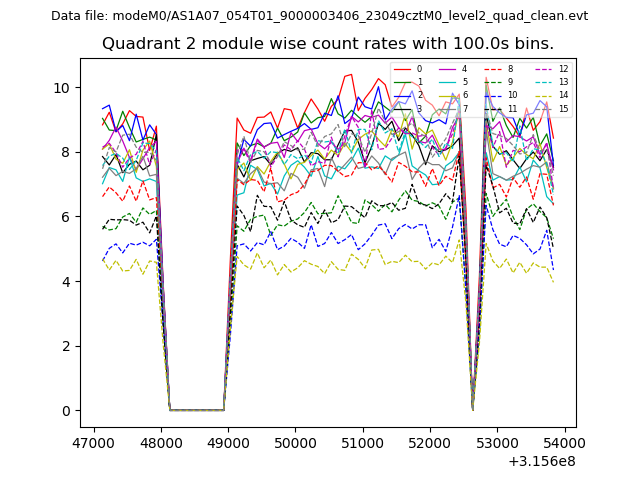
| Module-wise count rates for Quadrant B Data is divided into 100 sec bins |
 |
 |
| Module-wise count rates for Quadrant C Data is divided into 100 sec bins |
 |
 |
| Module-wise count rates for Quadrant D Data is divided into 100 sec bins |
 |
 |
| Parameter | Plot |
|---|---|
| CZT HV Monitor | 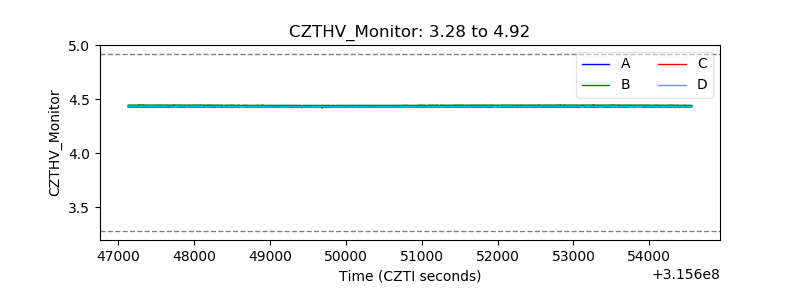 |
| D_VDD | 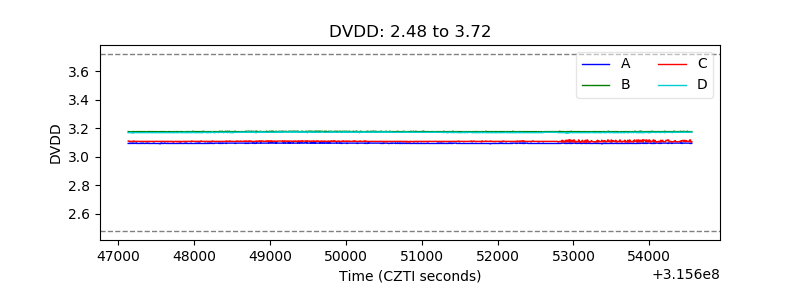 |
| Temperature 1 | 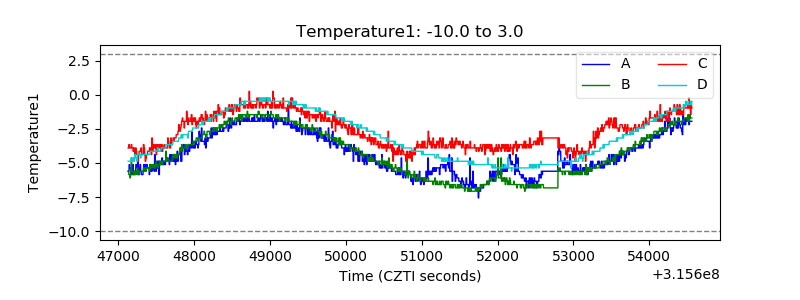 |
| Veto HV Monitor | 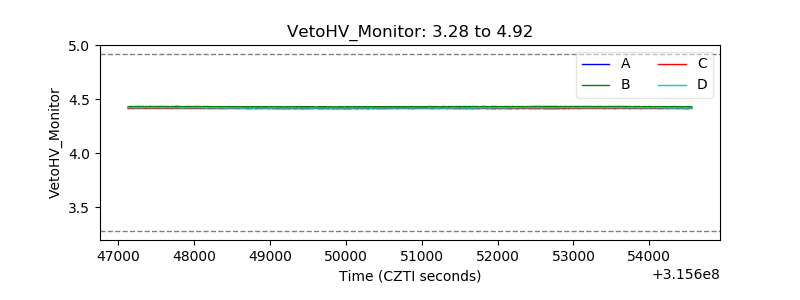 |
| Veto LLD | 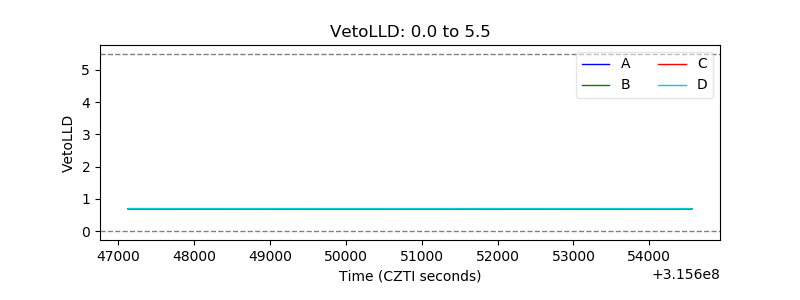 |
| Alpha Counter | 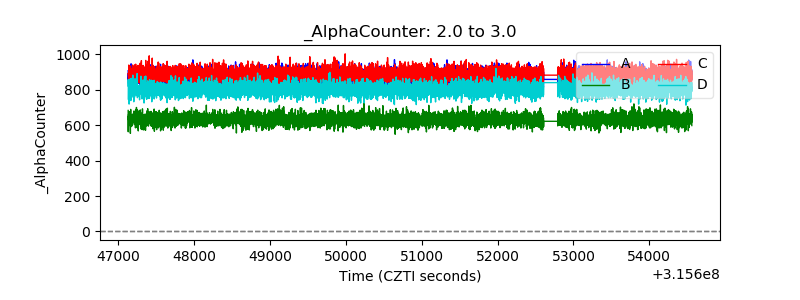 |
| _CPM_Rate | 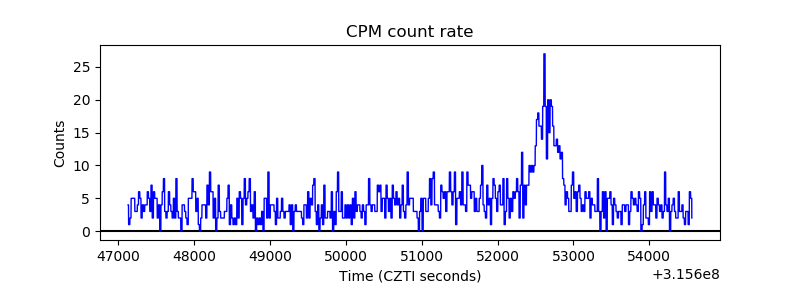 |
| CZT Counter | 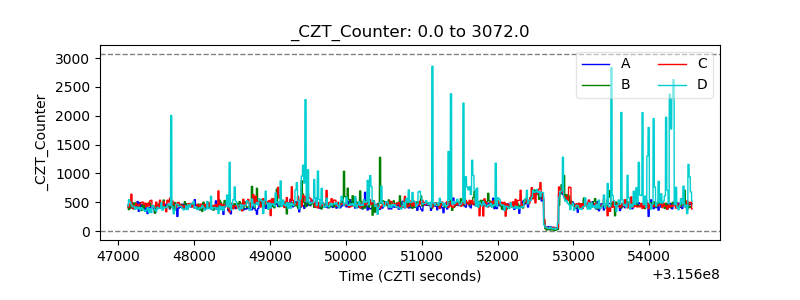 |
| +2.5 Volts monitor | 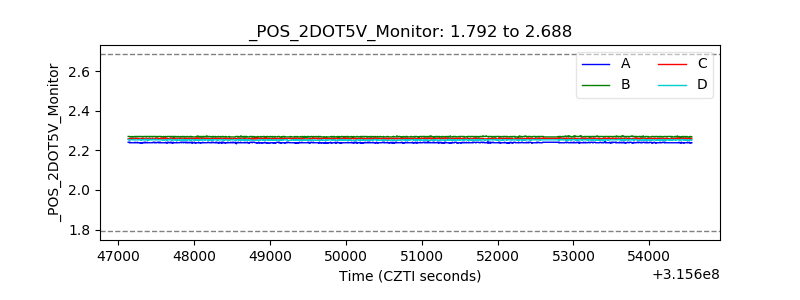 |
| +5 Volts monitor | 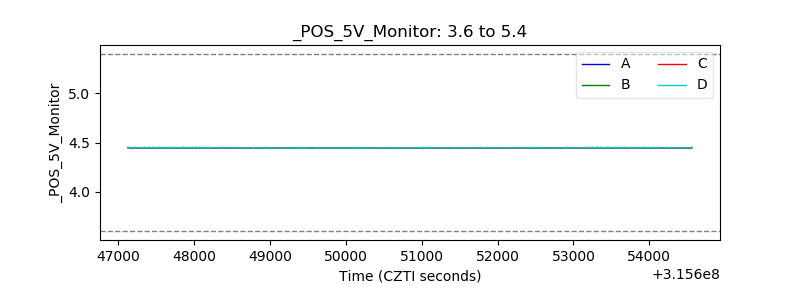 |
| _ROLL_ROT | 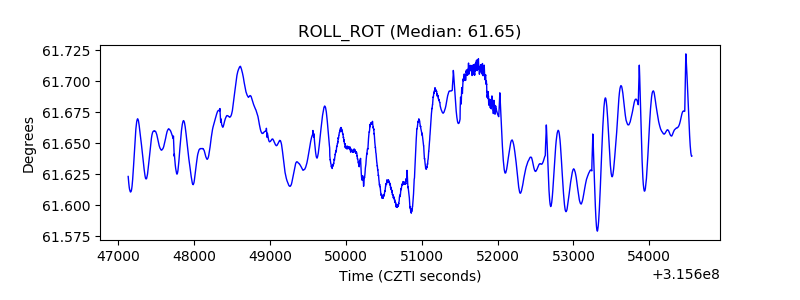 |
| _Roll_DEC | 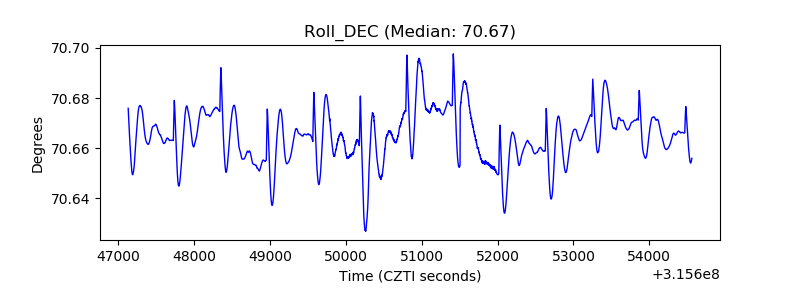 |
| _Roll_RA | 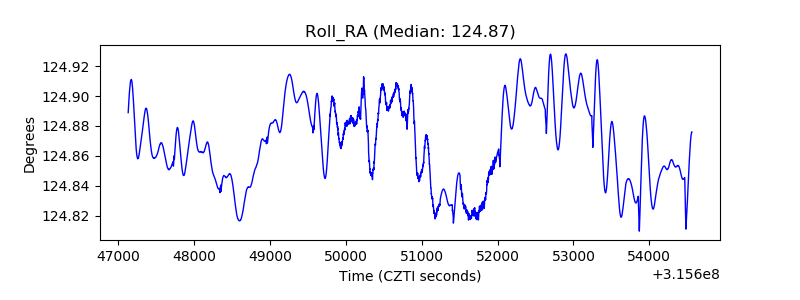 |
| Veto Counter | 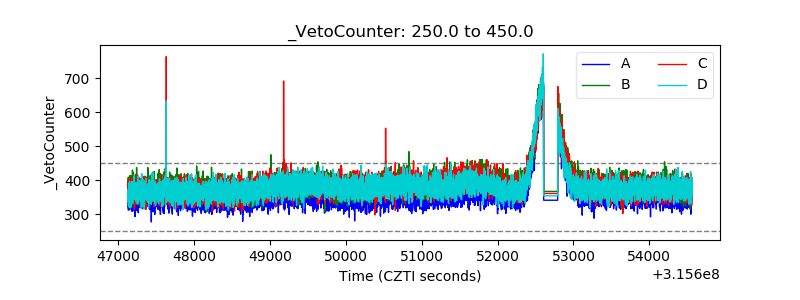 |