| Param | Original file | Final file |
|---|---|---|
| Filename | modeM0/AS1A07_054T01_9000003406_23052cztM0_level2.evt | modeM0/AS1A07_054T01_9000003406_23052cztM0_level2_quad_clean.evt |
| Size (bytes) | 1,366,580,160 | 266,497,920 |
| Size | 1.3 GB | 254.2 MB |
| Events in quadrant A | 8,140,159 | 1,778,788 |
| Events in quadrant B | 9,449,265 | 1,773,752 |
| Events in quadrant C | 9,202,405 | 1,681,930 |
| Events in quadrant D | 13,384,006 | 1,601,478 |
| Mode M0 | |||
|---|---|---|---|
| Quadrant | BADHDUFLAG | Total packets | Discarded packets |
| A | 0 | 36229 | 3 |
| B | 0 | 39695 | 3 |
| C | 0 | 38815 | 3 |
| D | 0 | 51853 | 3 |
| Mode SS | |||
|---|---|---|---|
| Quadrant | BADHDUFLAG | Total packets | Discarded packets |
| A | 0 | 366 | 0 |
| B | 0 | 366 | 0 |
| C | 0 | 366 | 0 |
| D | 0 | 366 | 0 |
| Mode M9 | |||
|---|---|---|---|
| Quadrant | BADHDUFLAG | Total packets | Discarded packets |
| A | 0 | 19 | 0 |
| B | 0 | 19 | 0 |
| C | 0 | 19 | 0 |
| D | 0 | 19 | 0 |
| Quadrant | Total seconds | Saturated seconds | Saturation percentage |
|---|---|---|---|
| A | 17917 | 126 | 0.703243% |
| B | 17918 | 474 | 2.645385% |
| C | 17918 | 407 | 2.271459% |
| D | 17918 | 1545 | 8.622614% |
Noise dominated data is calculated using 1-second bins in cleaned event files. If a bin has >2000 counts, and if more than 50% of those come from <1% of pixels, then it is considered to be noise-dominated and hence unusable.
| Quadrant | # 1 sec bins | Bins with >0 counts | Bins with >2000 counts | High rate bins dominated by noise | Noise dominated (total time) | Noise dominated (detector-on time) | Marked lightcurve |
|---|---|---|---|---|---|---|---|
| A | 19882 | 17920 | 0 | 0 | 0.00% | 0.00% | 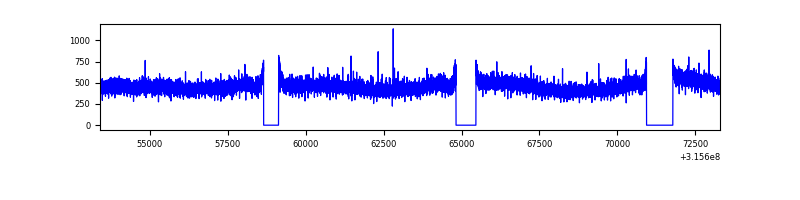 |
| B | 19883 | 17921 | 225 | 225 | 1.13% | 1.26% | 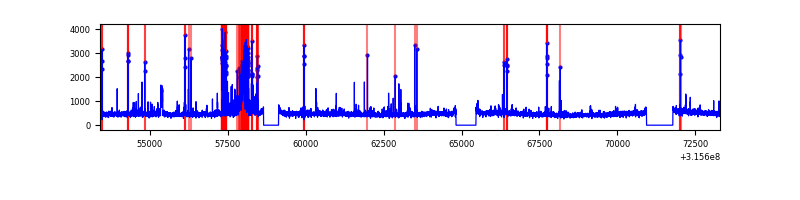 |
| C | 19883 | 17921 | 119 | 119 | 0.60% | 0.66% | 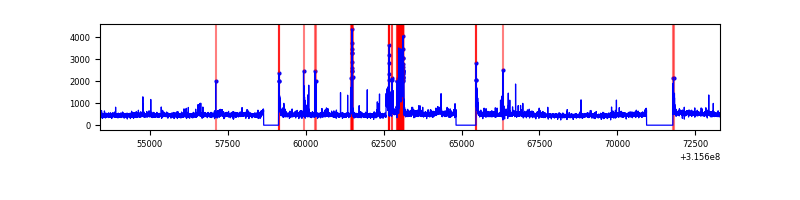 |
| D | 19882 | 17919 | 1250 | 1250 | 6.29% | 6.98% | 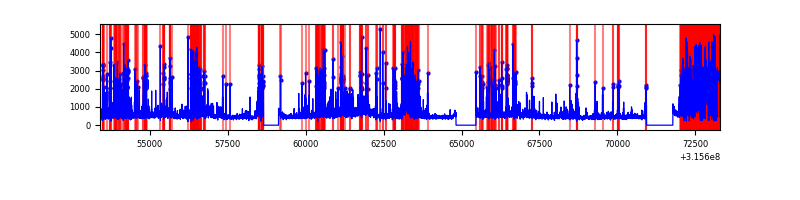 |
Top three noisy pixels from each quadrant. If the there are fewer than three noisy pixels in the level2.evt file, extra rows are filled as -1
| Pixel properties | Quadrant properties | ||||||
|---|---|---|---|---|---|---|---|
| Quadrant | DetID | PixID | Counts | Sigma | Mean | Median | Sigma |
| A | 13 | 254 | 27280 | 59.83 | 2106 | 2058 | 421.6 |
| A | 3 | 137 | 18916 | 39.99 | 2106 | 2058 | 421.6 |
| A | 0 | 226 | 17897 | 37.57 | 2106 | 2058 | 421.6 |
| B | 3 | 64 | 765227 | 1926.32 | 2085 | 2031 | 396.2 |
| B | 0 | 190 | 143067 | 355.98 | 2085 | 2031 | 396.2 |
| B | 0 | 189 | 110183 | 272.98 | 2085 | 2031 | 396.2 |
| C | 10 | 9 | 685050 | 1474.91 | 2003 | 2012 | 463.1 |
| C | 14 | 238 | 319983 | 686.61 | 2003 | 2012 | 463.1 |
| C | 0 | 10 | 241651 | 517.46 | 2003 | 2012 | 463.1 |
| D | 1 | 52 | 4053391 | 8504.62 | 1953 | 1892 | 476.4 |
| D | 13 | 153 | 1217970 | 2552.7 | 1953 | 1892 | 476.4 |
| D | 13 | 172 | 173084 | 359.35 | 1953 | 1892 | 476.4 |
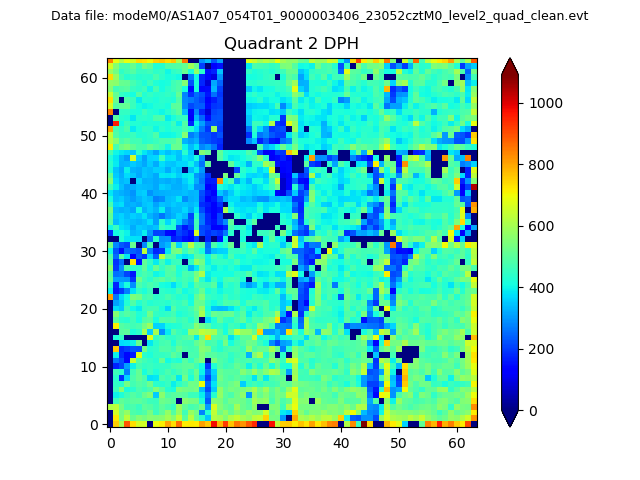
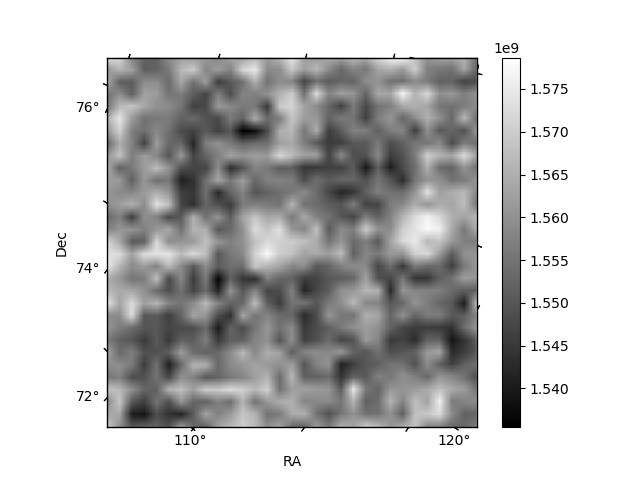
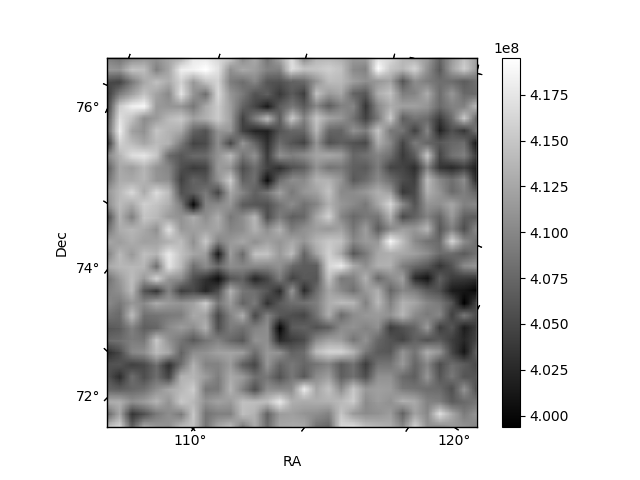
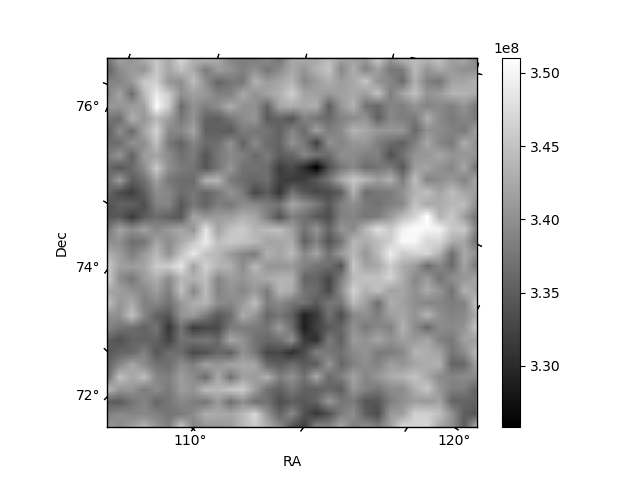
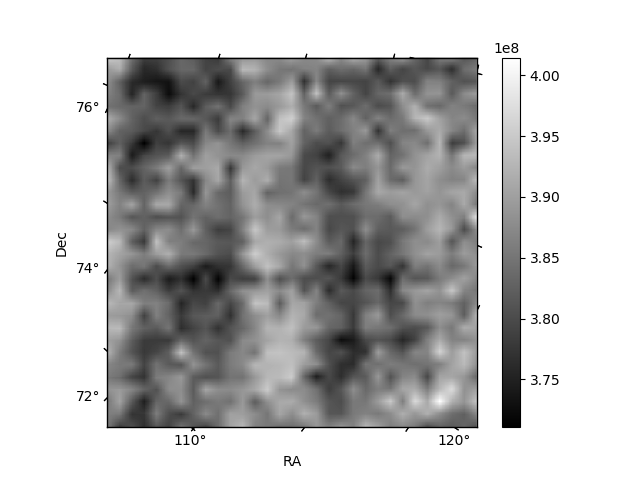
Histogram calculated using DETX and DETY for each event in the final _common_clean file
| Quadrant A | 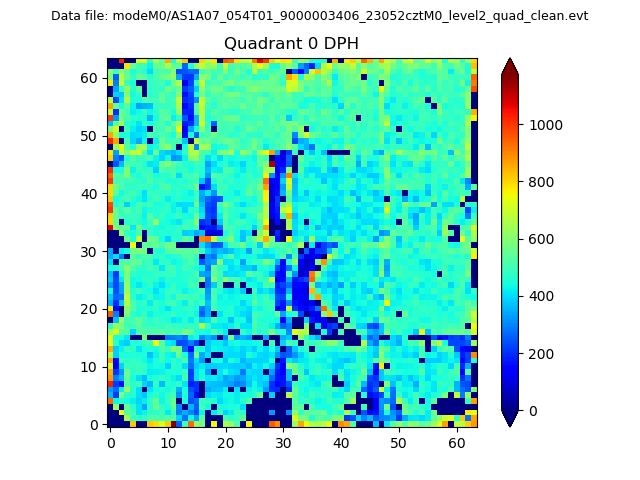 |
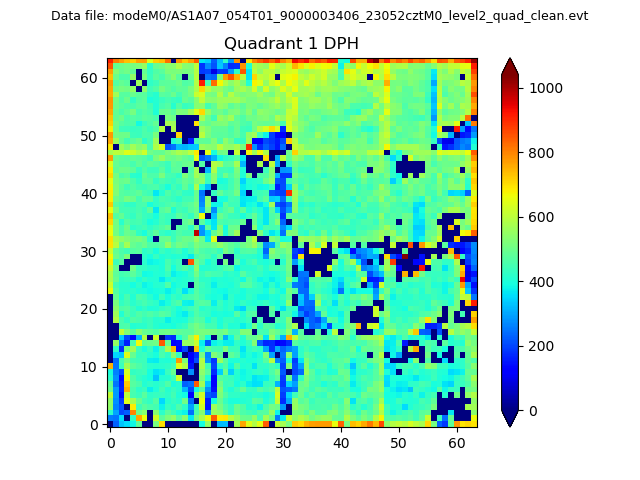 |
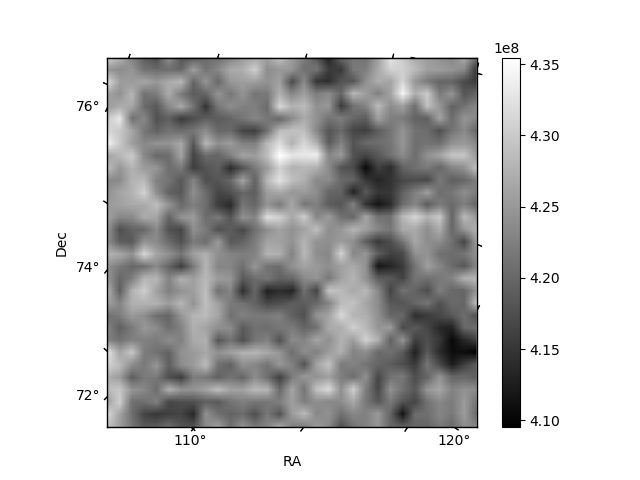
Quadrant B |
|---|---|---|---|
| Quadrant D | 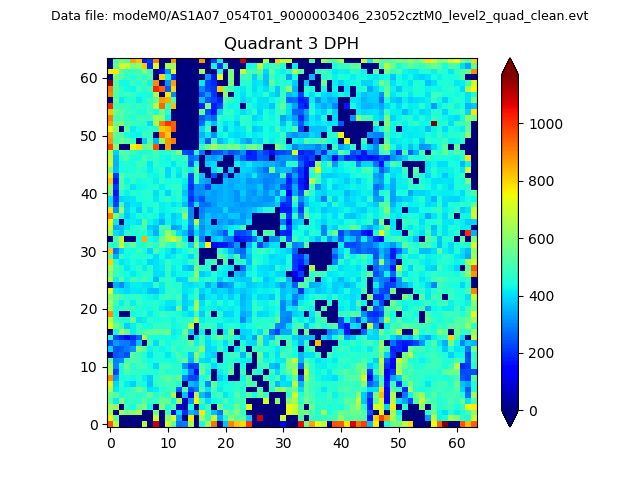 |
 |
Quadrant C |
| Plot type | Count rate plots | Images |
|---|---|---|
| Comparison with Poisson distribution Blue bars denote a histogram of data divided into 1 sec bins. Red curve is a Poisson curve with rate = median count rate of data. |
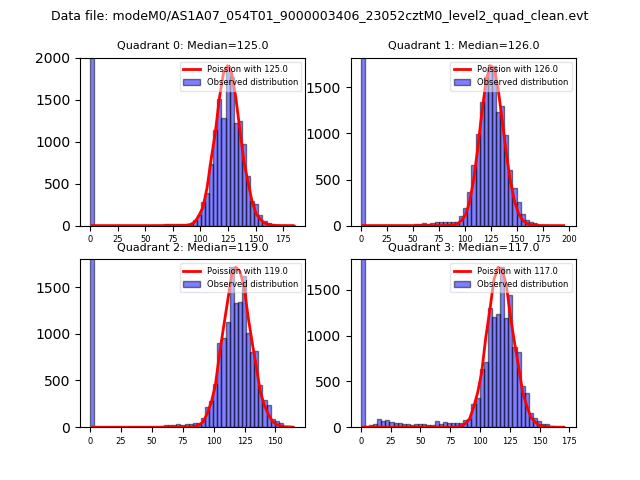 |
 |
| Quadrant-wise count rates Data is divided into 100 sec bins |
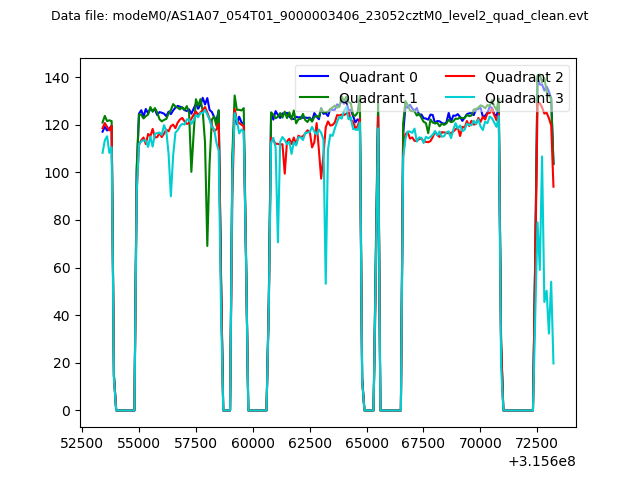 |
|
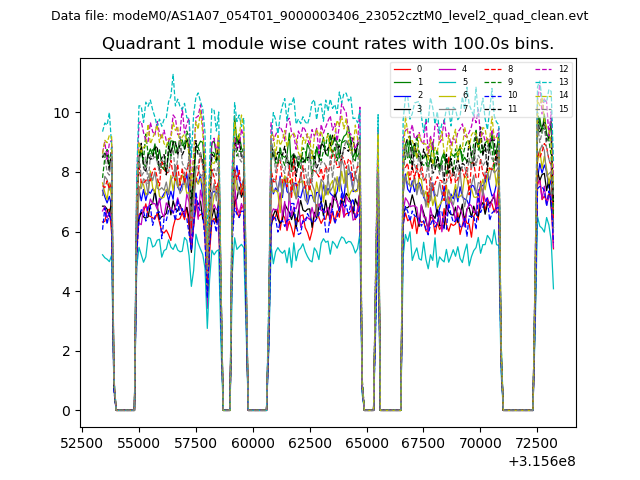
| Module-wise count rates for Quadrant A Data is divided into 100 sec bins |
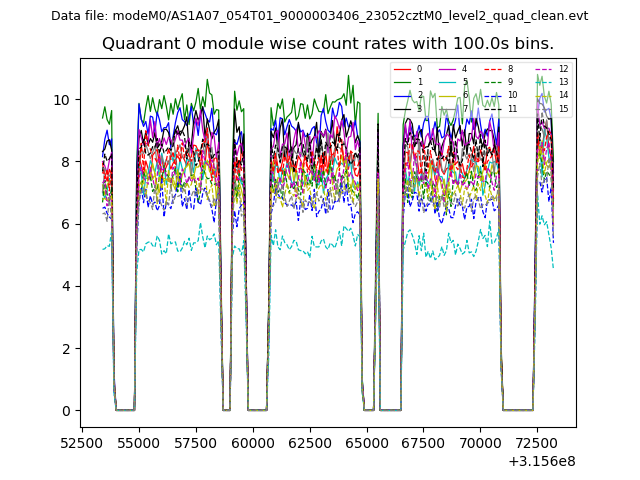 |
 |
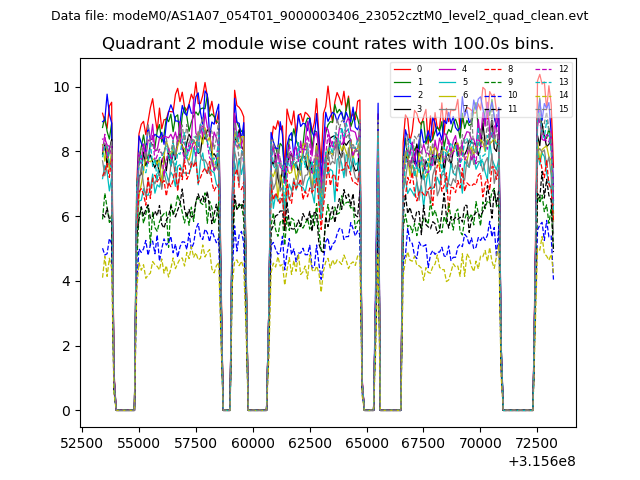
| Module-wise count rates for Quadrant B Data is divided into 100 sec bins |
 |
 |
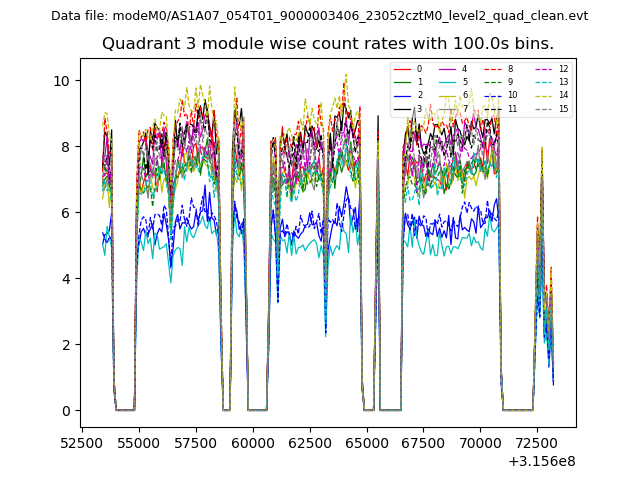
| Module-wise count rates for Quadrant C Data is divided into 100 sec bins |
 |
 |
| Module-wise count rates for Quadrant D Data is divided into 100 sec bins |
 |
 |
| Parameter | Plot |
|---|---|
| CZT HV Monitor | 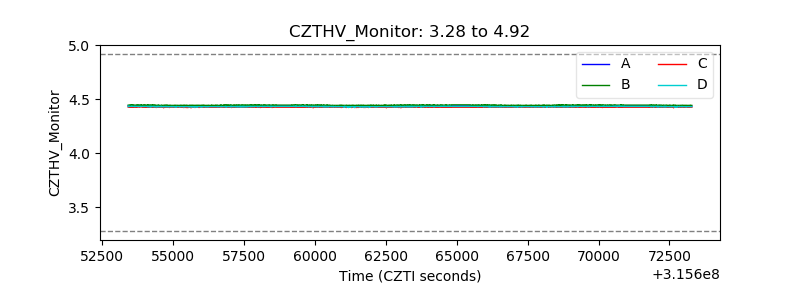 |
| D_VDD | 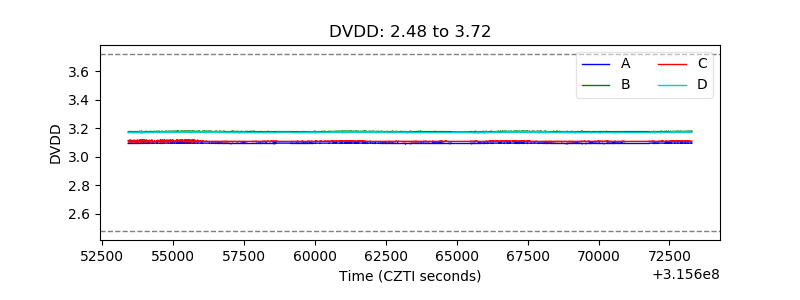 |
| Temperature 1 | 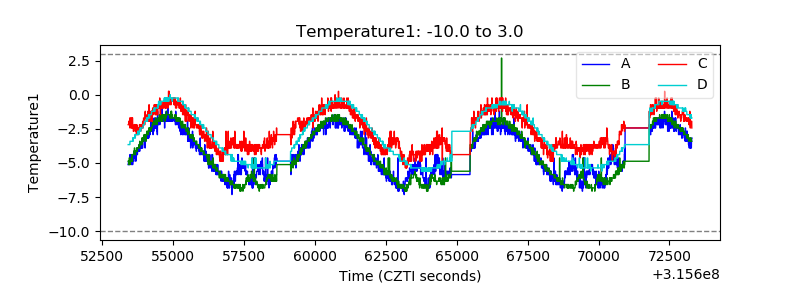 |
| Veto HV Monitor | 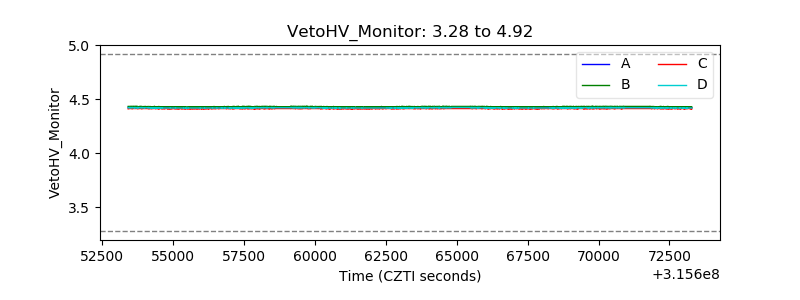 |
| Veto LLD | 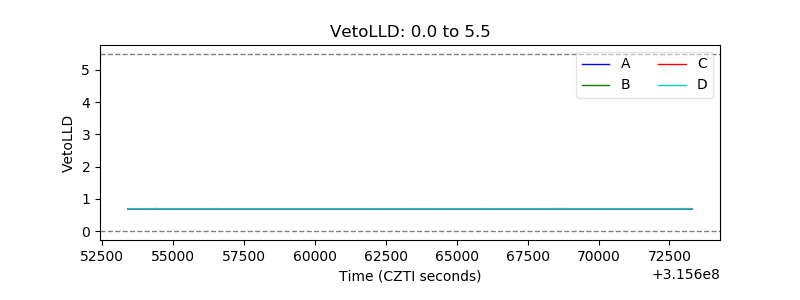 |
| Alpha Counter | 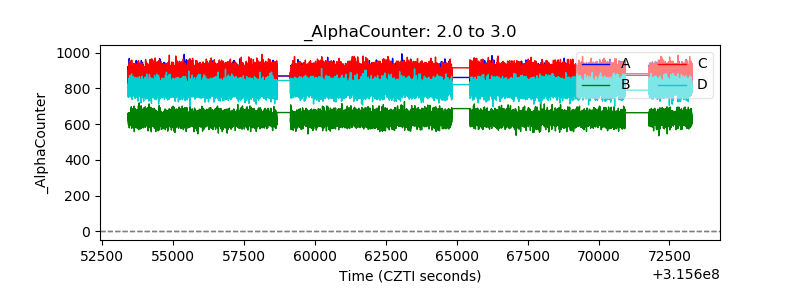 |
| _CPM_Rate | 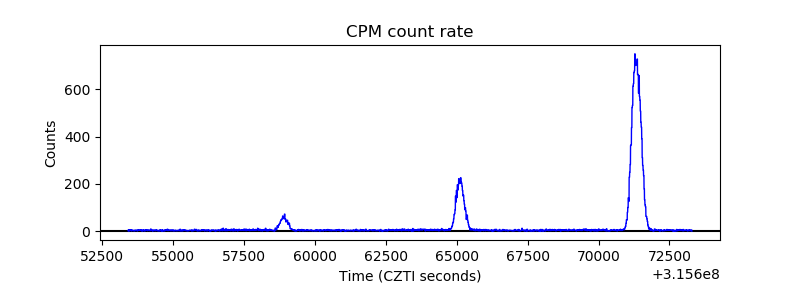 |
| CZT Counter | 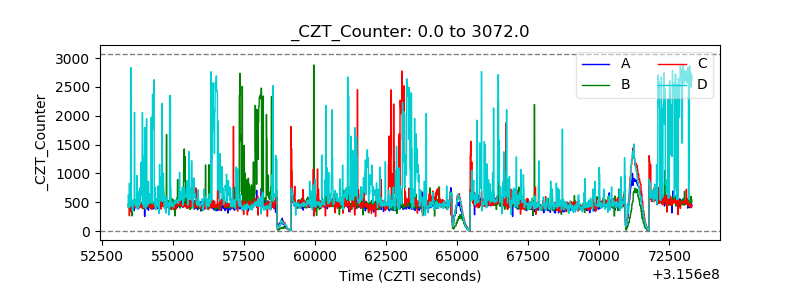 |
| +2.5 Volts monitor |  |
| +5 Volts monitor |  |
| _ROLL_ROT | 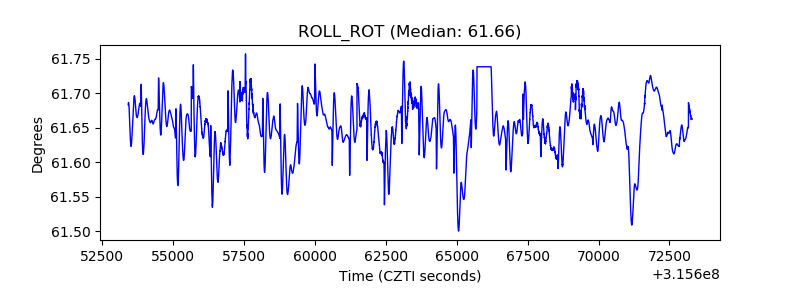 |
| _Roll_DEC | 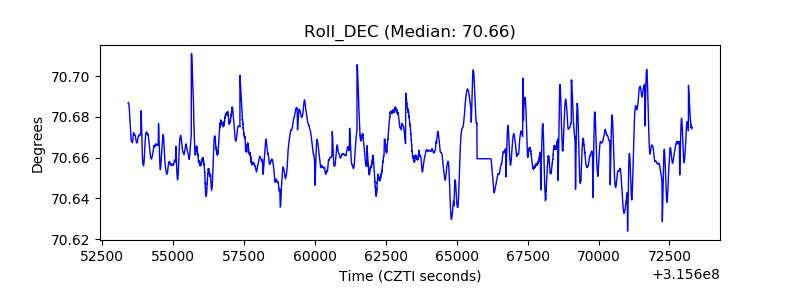 |
| _Roll_RA | 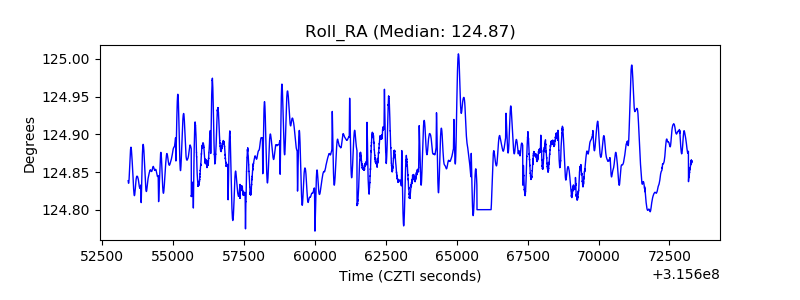 |
| Veto Counter | 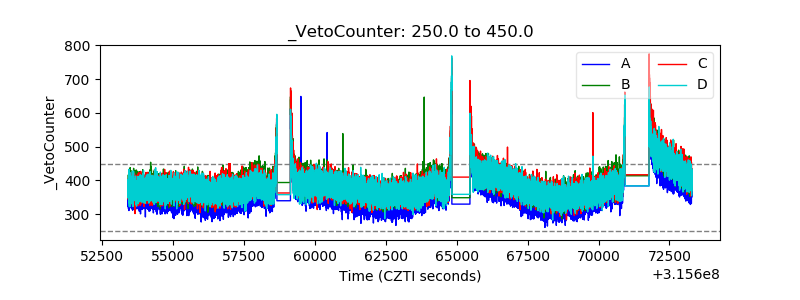 |