| Param | Original file | Final file |
|---|---|---|
| Filename | modeM0/AS1A07_054T01_9000003406_23053cztM0_level2.evt | modeM0/AS1A07_054T01_9000003406_23053cztM0_level2_quad_clean.evt |
| Size (bytes) | 517,199,040 | 108,437,760 |
| Size | 493.2 MB | 103.4 MB |
| Events in quadrant A | 2,856,500 | 758,165 |
| Events in quadrant B | 3,053,136 | 762,986 |
| Events in quadrant C | 2,965,514 | 727,768 |
| Events in quadrant D | 6,370,567 | 605,401 |
| Mode M0 | |||
|---|---|---|---|
| Quadrant | BADHDUFLAG | Total packets | Discarded packets |
| A | 0 | 12694 | 1 |
| B | 0 | 13184 | 1 |
| C | 0 | 12914 | 1 |
| D | 0 | 23297 | 2 |
| Mode SS | |||
|---|---|---|---|
| Quadrant | BADHDUFLAG | Total packets | Discarded packets |
| A | 0 | 128 | 0 |
| B | 0 | 128 | 0 |
| C | 0 | 128 | 0 |
| D | 0 | 128 | 0 |
| Mode M9 | |||
|---|---|---|---|
| Quadrant | BADHDUFLAG | Total packets | Discarded packets |
| A | 0 | 9 | 0 |
| B | 0 | 9 | 0 |
| C | 0 | 9 | 0 |
| D | 0 | 9 | 0 |
| Quadrant | Total seconds | Saturated seconds | Saturation percentage |
|---|---|---|---|
| A | 6137 | 59 | 0.961382% |
| B | 6137 | 86 | 1.401336% |
| C | 6137 | 119 | 1.939058% |
| D | 6136 | 1439 | 23.451760% |
Noise dominated data is calculated using 1-second bins in cleaned event files. If a bin has >2000 counts, and if more than 50% of those come from <1% of pixels, then it is considered to be noise-dominated and hence unusable.
| Quadrant | # 1 sec bins | Bins with >0 counts | Bins with >2000 counts | High rate bins dominated by noise | Noise dominated (total time) | Noise dominated (detector-on time) | Marked lightcurve |
|---|---|---|---|---|---|---|---|
| A | 7127 | 6137 | 0 | 0 | 0.00% | 0.00% | 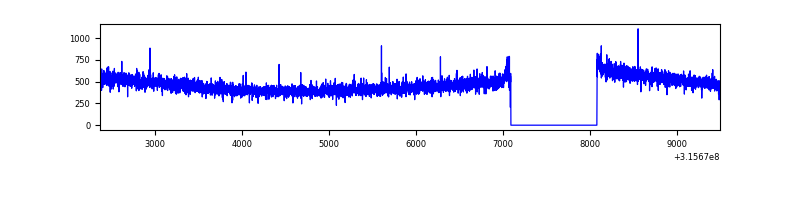 |
| B | 7127 | 6137 | 16 | 16 | 0.22% | 0.26% | 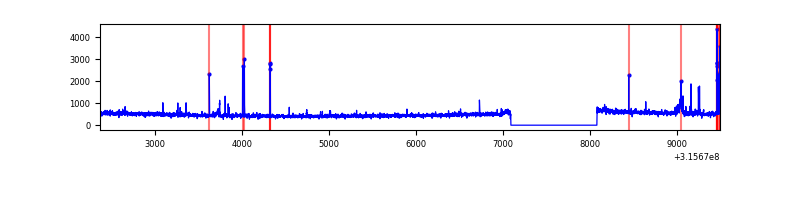 |
| C | 7127 | 6137 | 2 | 2 | 0.03% | 0.03% | 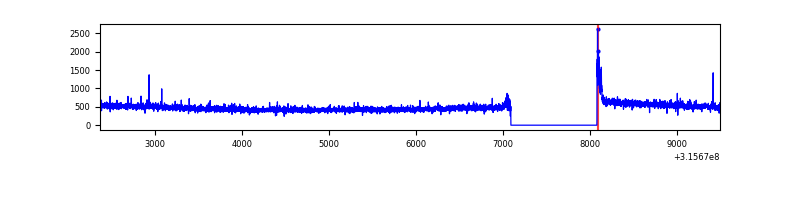 |
| D | 7126 | 6136 | 1280 | 1280 | 17.96% | 20.86% | 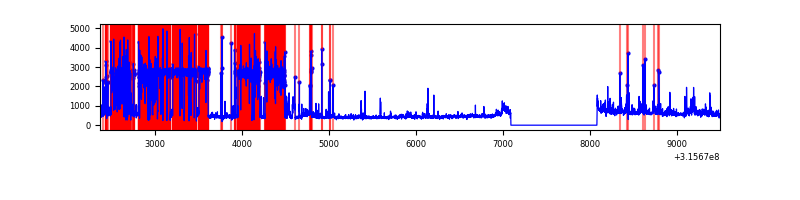 |
Top three noisy pixels from each quadrant. If the there are fewer than three noisy pixels in the level2.evt file, extra rows are filled as -1
| Pixel properties | Quadrant properties | ||||||
|---|---|---|---|---|---|---|---|
| Quadrant | DetID | PixID | Counts | Sigma | Mean | Median | Sigma |
| A | 13 | 254 | 9800 | 60.94 | 740 | 724 | 148.9 |
| A | 3 | 137 | 6454 | 38.47 | 740 | 724 | 148.9 |
| A | 0 | 226 | 6265 | 37.2 | 740 | 724 | 148.9 |
| B | 4 | 216 | 53777 | 377.8 | 737 | 717 | 140.4 |
| B | 3 | 64 | 50552 | 354.84 | 737 | 717 | 140.4 |
| B | 0 | 189 | 29086 | 202.0 | 737 | 717 | 140.4 |
| C | 14 | 238 | 112847 | 680.88 | 712 | 716 | 164.7 |
| C | 0 | 10 | 55588 | 333.19 | 712 | 716 | 164.7 |
| C | 0 | 207 | 15934 | 92.41 | 712 | 716 | 164.7 |
| D | 1 | 52 | 3589013 | 23344.58 | 629 | 610 | 153.7 |
| D | 13 | 153 | 163766 | 1061.42 | 629 | 610 | 153.7 |
| D | 12 | 227 | 151604 | 982.3 | 629 | 610 | 153.7 |
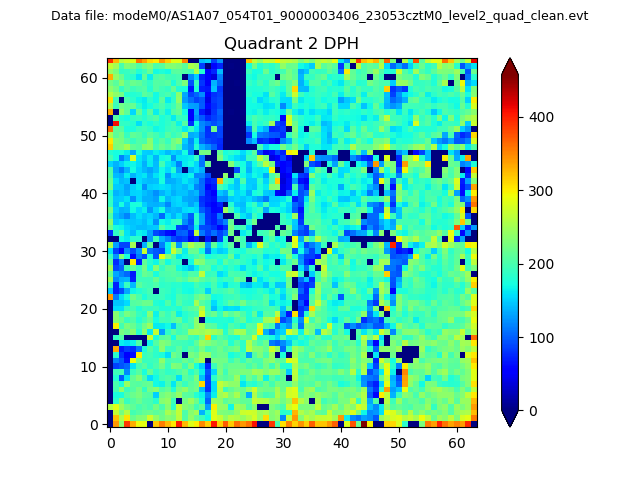
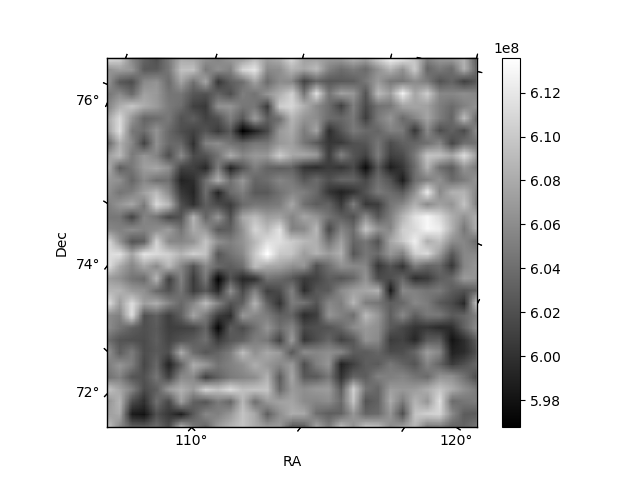
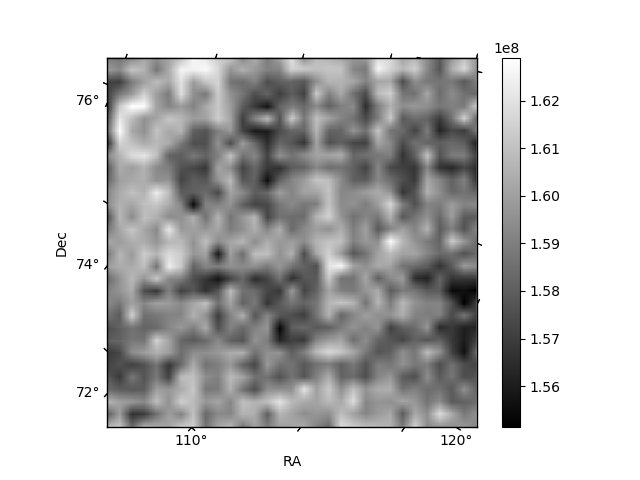
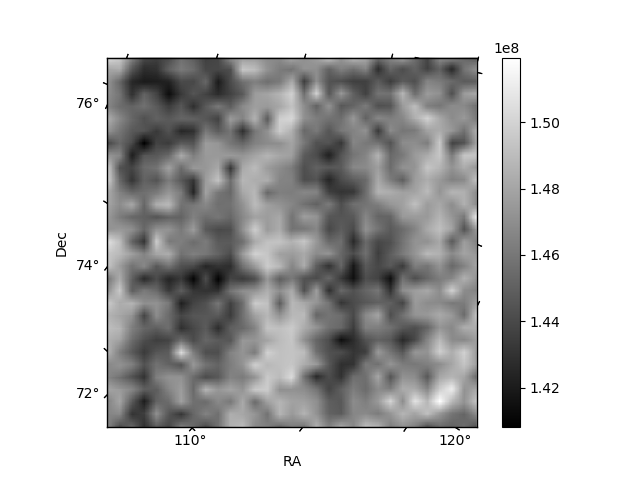
Histogram calculated using DETX and DETY for each event in the final _common_clean file
| Quadrant A | 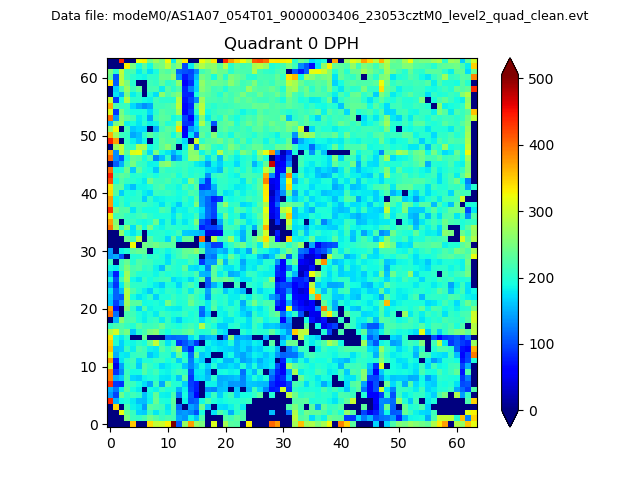 |
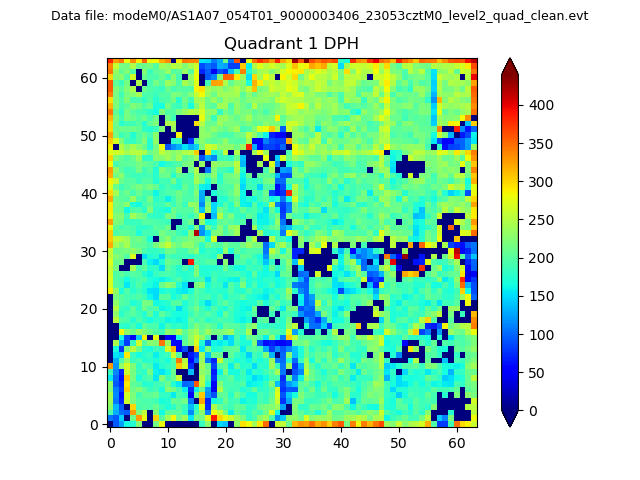 |
Quadrant B |
|---|---|---|---|
| Quadrant D | 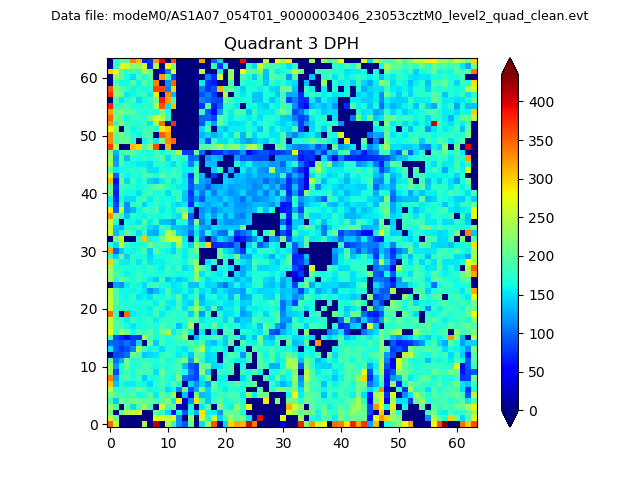 |
 |
Quadrant C |
| Plot type | Count rate plots | Images |
|---|---|---|
| Comparison with Poisson distribution Blue bars denote a histogram of data divided into 1 sec bins. Red curve is a Poisson curve with rate = median count rate of data. |
 |
 |
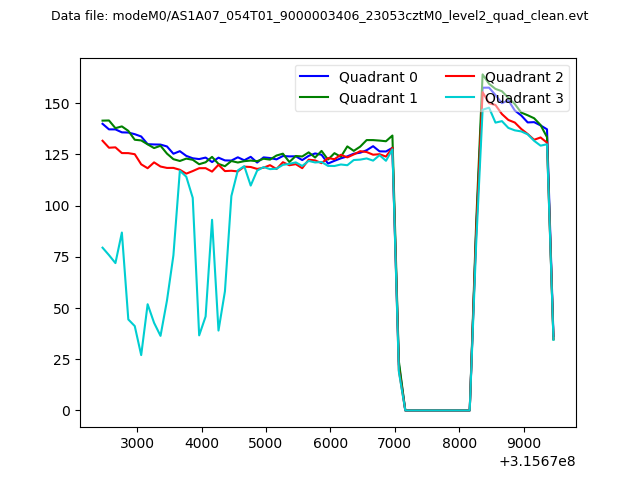
| Quadrant-wise count rates Data is divided into 100 sec bins |
 |
|
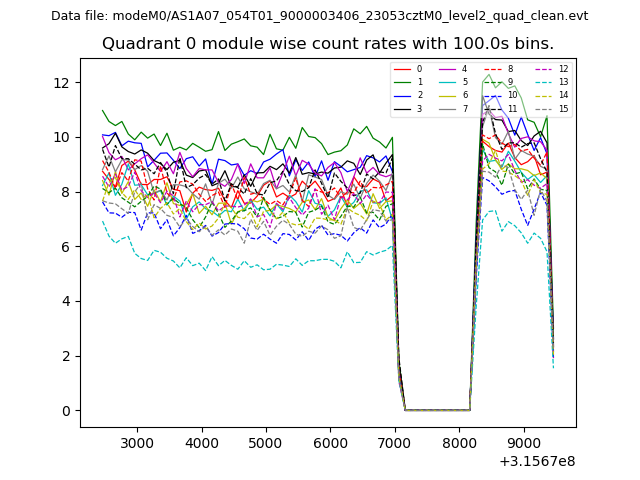
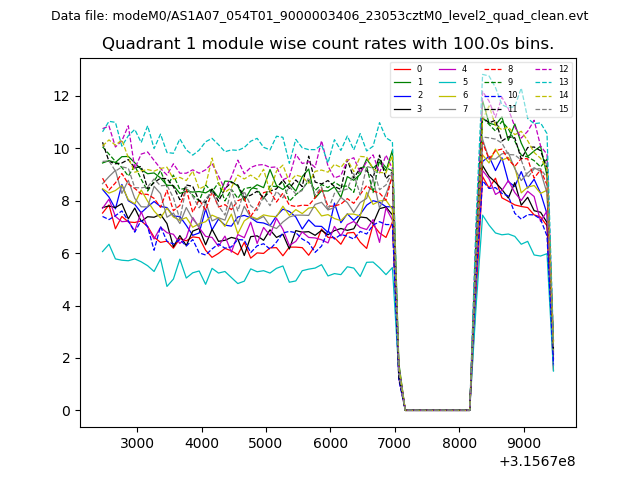
| Module-wise count rates for Quadrant A Data is divided into 100 sec bins |
 |
 |
| Module-wise count rates for Quadrant B Data is divided into 100 sec bins |
 |
 |
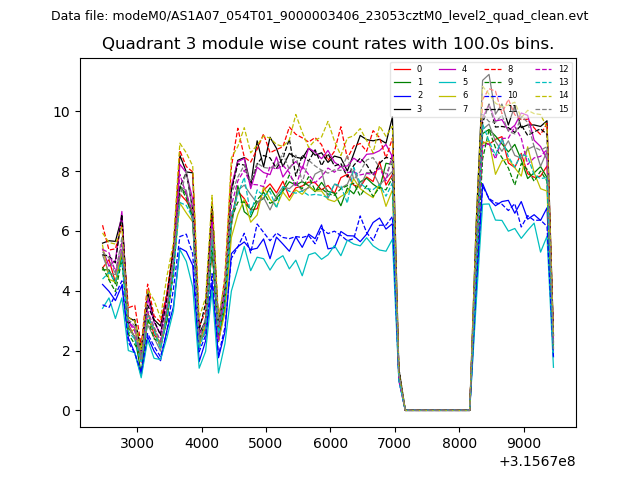
| Module-wise count rates for Quadrant C Data is divided into 100 sec bins |
 |
 |
| Module-wise count rates for Quadrant D Data is divided into 100 sec bins |
 |
 |
| Parameter | Plot |
|---|---|
| CZT HV Monitor | 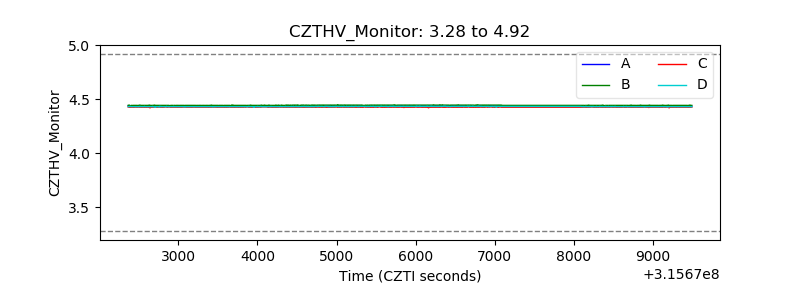 |
| D_VDD | 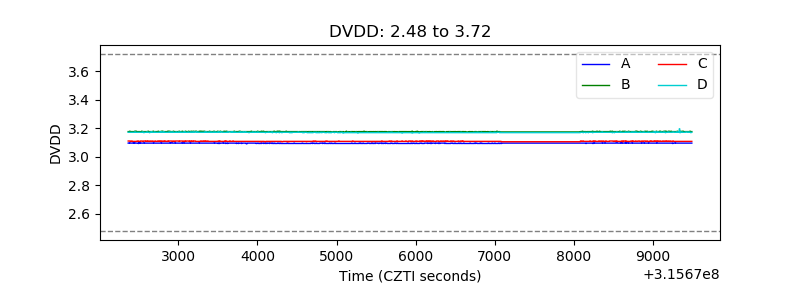 |
| Temperature 1 | 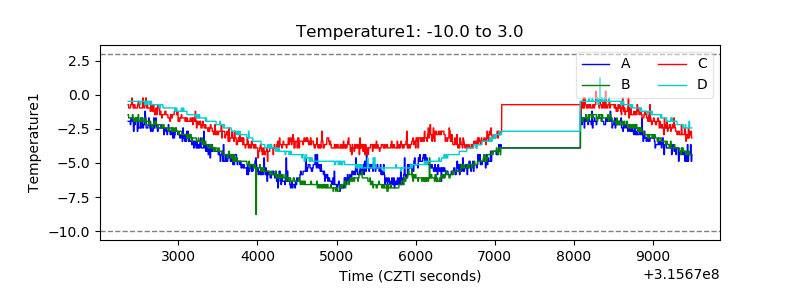 |
| Veto HV Monitor | 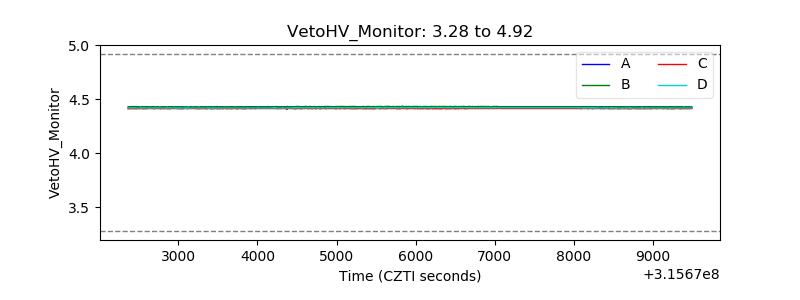 |
| Veto LLD | 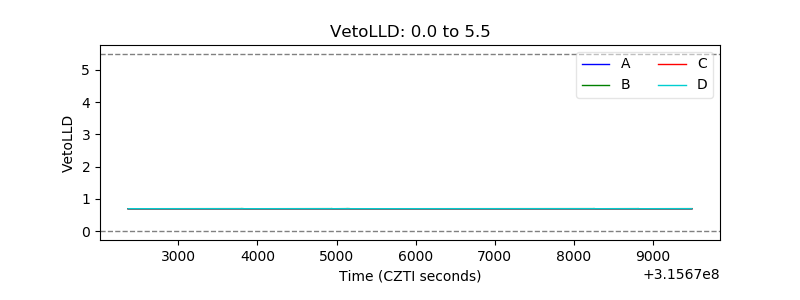 |
| Alpha Counter | 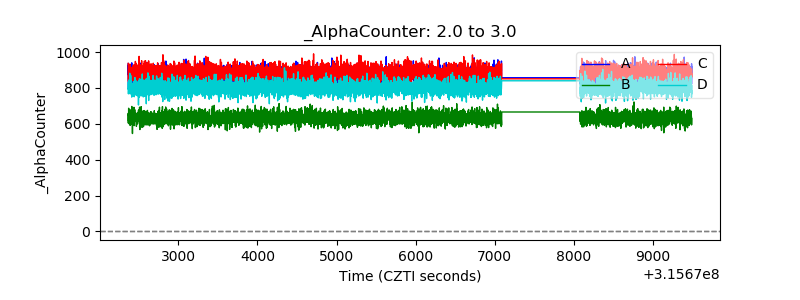 |
| _CPM_Rate | 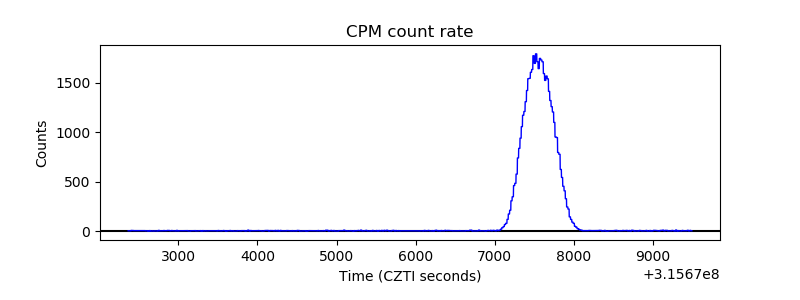 |
| CZT Counter | 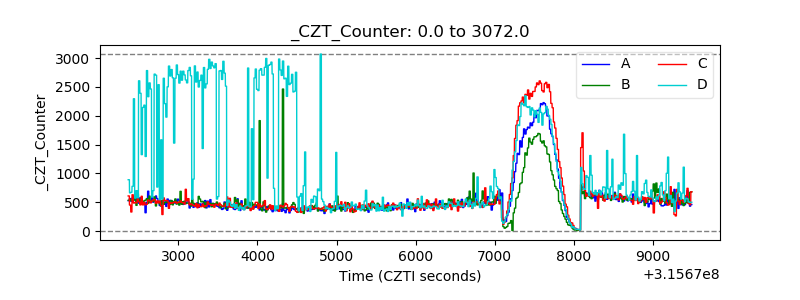 |
| +2.5 Volts monitor |  |
| +5 Volts monitor |  |
| _ROLL_ROT |  |
| _Roll_DEC |  |
| _Roll_RA | 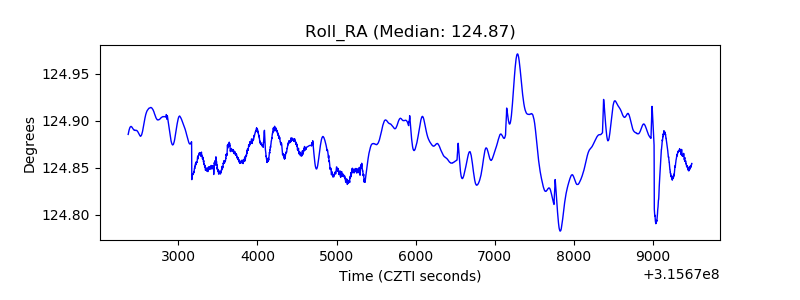 |
| Veto Counter | 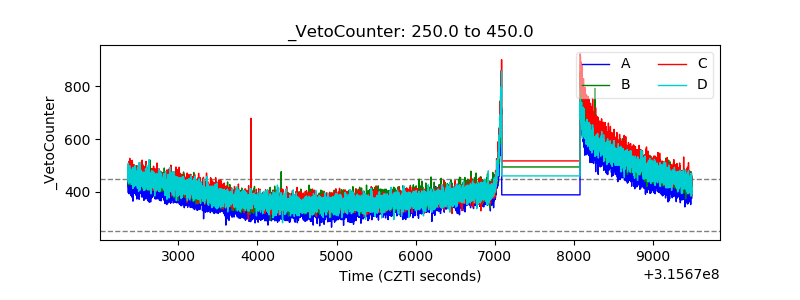 |