| Param | Original file | Final file |
|---|---|---|
| Filename | modeM0/AS1A07_054T01_9000003406_23056cztM0_level2.evt | modeM0/AS1A07_054T01_9000003406_23056cztM0_level2_quad_clean.evt |
| Size (bytes) | 518,552,640 | 128,168,640 |
| Size | 494.5 MB | 122.2 MB |
| Events in quadrant A | 3,100,395 | 876,762 |
| Events in quadrant B | 3,352,435 | 902,006 |
| Events in quadrant C | 3,358,620 | 870,428 |
| Events in quadrant D | 5,466,916 | 794,302 |
| Mode M0 | |||
|---|---|---|---|
| Quadrant | BADHDUFLAG | Total packets | Discarded packets |
| A | 0 | 13535 | 2 |
| B | 0 | 14151 | 2 |
| C | 0 | 14256 | 2 |
| D | 0 | 20615 | 2 |
| Mode SS | |||
|---|---|---|---|
| Quadrant | BADHDUFLAG | Total packets | Discarded packets |
| A | 0 | 128 | 0 |
| B | 0 | 128 | 0 |
| C | 0 | 128 | 0 |
| D | 0 | 128 | 0 |
| Mode M9 | |||
|---|---|---|---|
| Quadrant | BADHDUFLAG | Total packets | Discarded packets |
| A | 0 | 14 | 0 |
| B | 0 | 15 | 0 |
| C | 0 | 15 | 0 |
| D | 0 | 15 | 0 |
| Quadrant | Total seconds | Saturated seconds | Saturation percentage |
|---|---|---|---|
| A | 6279 | 25 | 0.398153% |
| B | 6279 | 72 | 1.146679% |
| C | 6279 | 112 | 1.783724% |
| D | 6279 | 647 | 10.304189% |
Noise dominated data is calculated using 1-second bins in cleaned event files. If a bin has >2000 counts, and if more than 50% of those come from <1% of pixels, then it is considered to be noise-dominated and hence unusable.
| Quadrant | # 1 sec bins | Bins with >0 counts | Bins with >2000 counts | High rate bins dominated by noise | Noise dominated (total time) | Noise dominated (detector-on time) | Marked lightcurve |
|---|---|---|---|---|---|---|---|
| A | 7559 | 6280 | 0 | 0 | 0.00% | 0.00% | 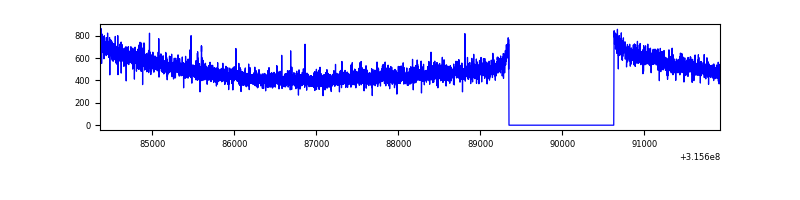 |
| B | 7559 | 6280 | 19 | 19 | 0.25% | 0.30% | 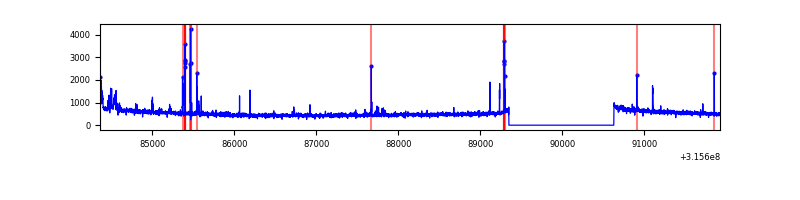 |
| C | 7559 | 6280 | 6 | 6 | 0.08% | 0.10% | 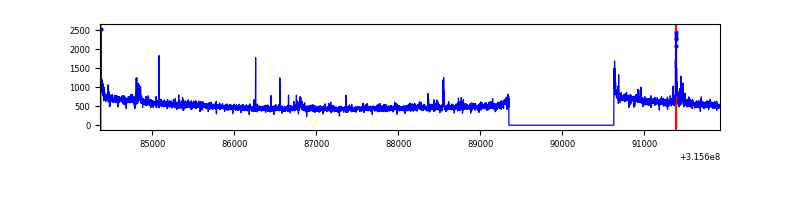 |
| D | 7559 | 6280 | 496 | 496 | 6.56% | 7.90% | 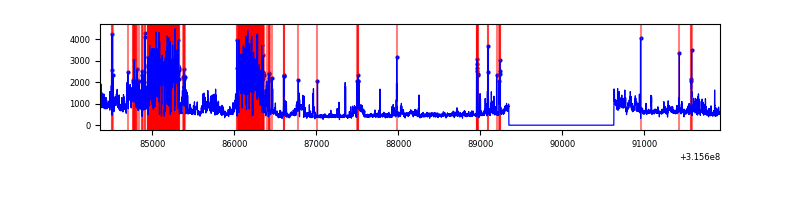 |
Top three noisy pixels from each quadrant. If the there are fewer than three noisy pixels in the level2.evt file, extra rows are filled as -1
| Pixel properties | Quadrant properties | ||||||
|---|---|---|---|---|---|---|---|
| Quadrant | DetID | PixID | Counts | Sigma | Mean | Median | Sigma |
| A | 13 | 254 | 10524 | 61.1 | 802 | 787 | 159.4 |
| A | 0 | 226 | 6992 | 38.93 | 802 | 787 | 159.4 |
| A | 3 | 137 | 6582 | 36.36 | 802 | 787 | 159.4 |
| B | 4 | 216 | 69043 | 453.27 | 810 | 792 | 150.6 |
| B | 3 | 64 | 46930 | 306.41 | 810 | 792 | 150.6 |
| B | 0 | 219 | 20559 | 131.28 | 810 | 792 | 150.6 |
| C | 14 | 238 | 127264 | 699.26 | 792 | 799 | 180.9 |
| C | 10 | 22 | 63959 | 349.23 | 792 | 799 | 180.9 |
| C | 0 | 10 | 26091 | 139.85 | 792 | 799 | 180.9 |
| D | 13 | 172 | 1244618 | 6721.49 | 760 | 741 | 185.1 |
| D | 1 | 52 | 1024029 | 5529.5 | 760 | 741 | 185.1 |
| D | 13 | 153 | 104165 | 558.87 | 760 | 741 | 185.1 |
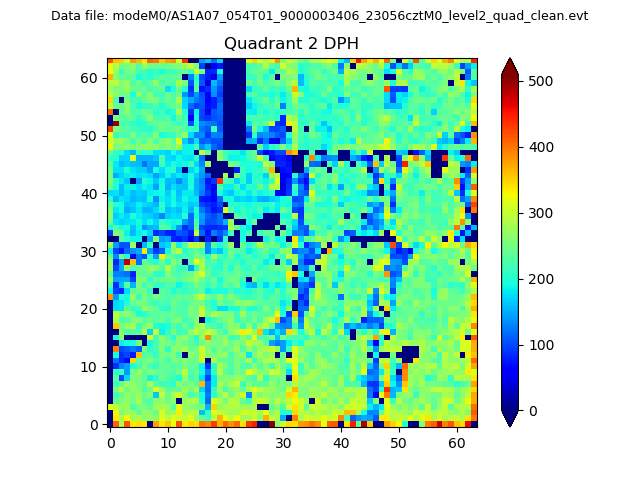
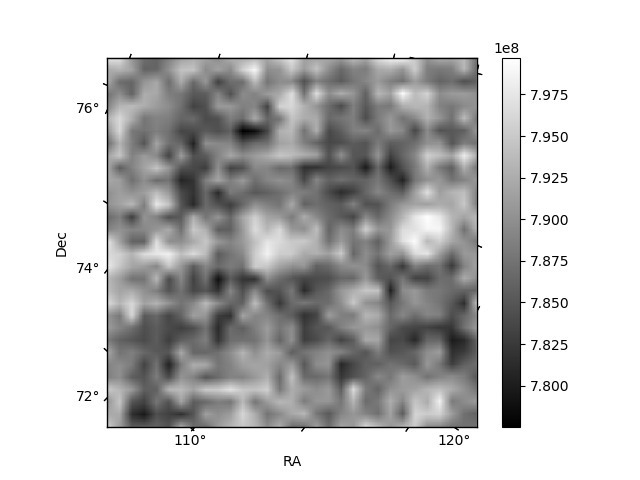
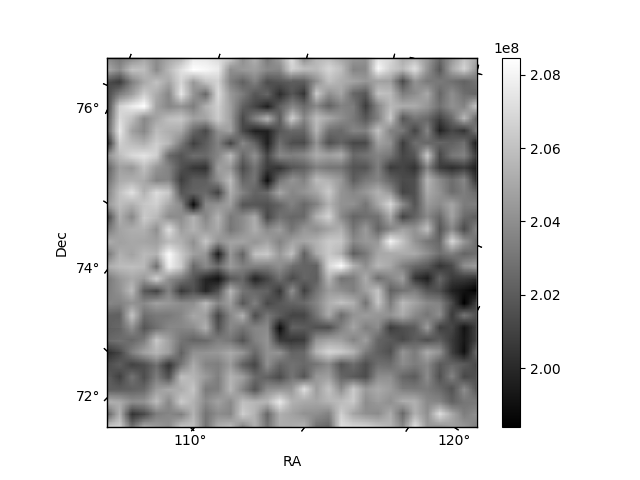
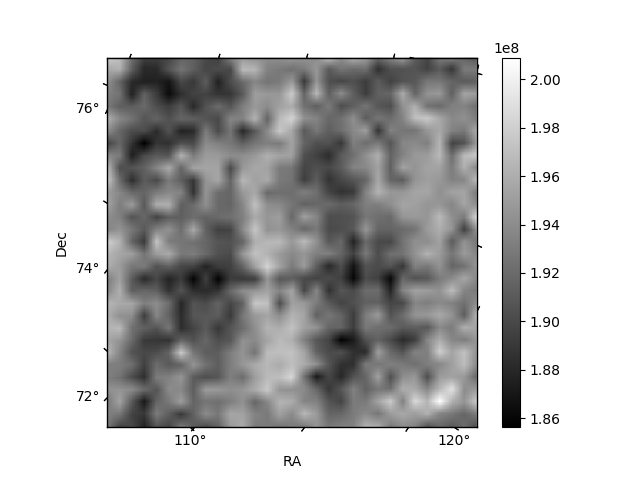
Histogram calculated using DETX and DETY for each event in the final _common_clean file
| Quadrant A | 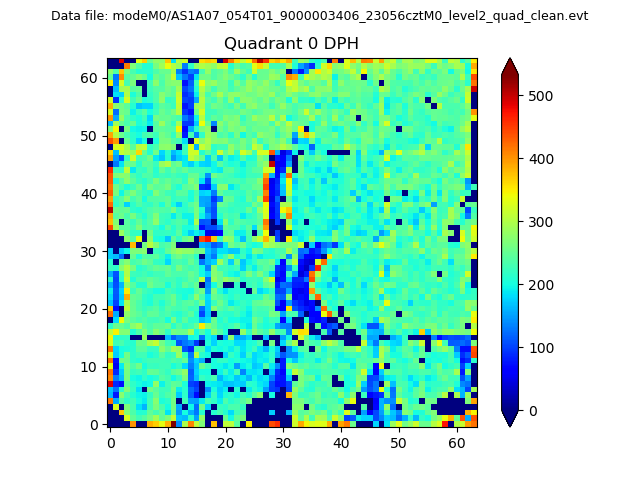 |
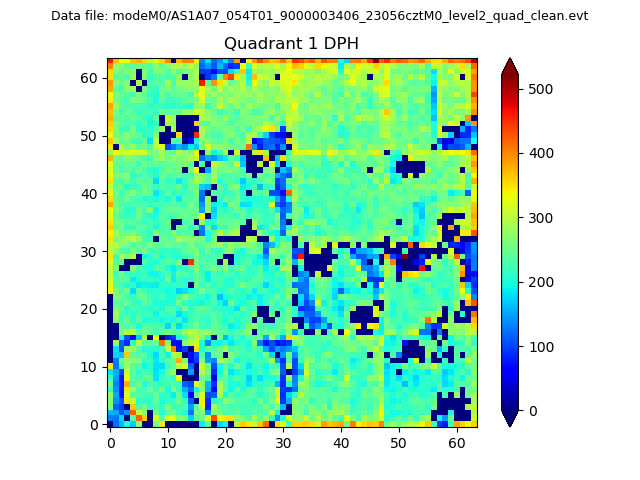 |
Quadrant B |
|---|---|---|---|
| Quadrant D | 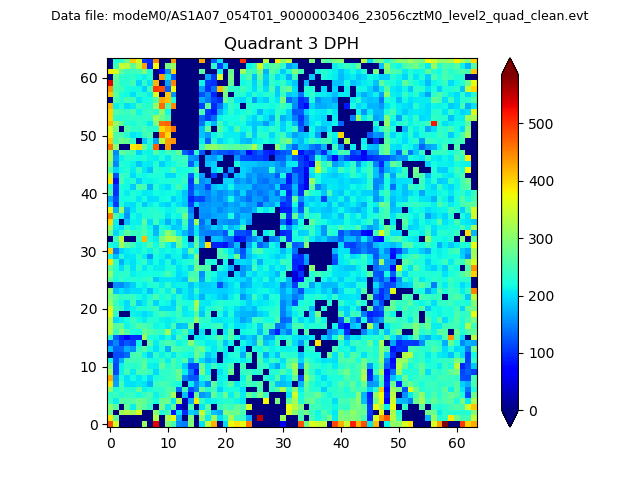 |
 |
Quadrant C |
| Plot type | Count rate plots | Images |
|---|---|---|
| Comparison with Poisson distribution Blue bars denote a histogram of data divided into 1 sec bins. Red curve is a Poisson curve with rate = median count rate of data. |
 |
 |
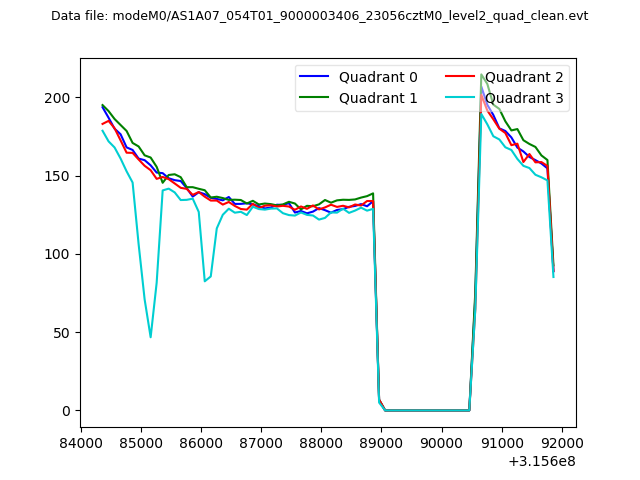
| Quadrant-wise count rates Data is divided into 100 sec bins |
 |
|
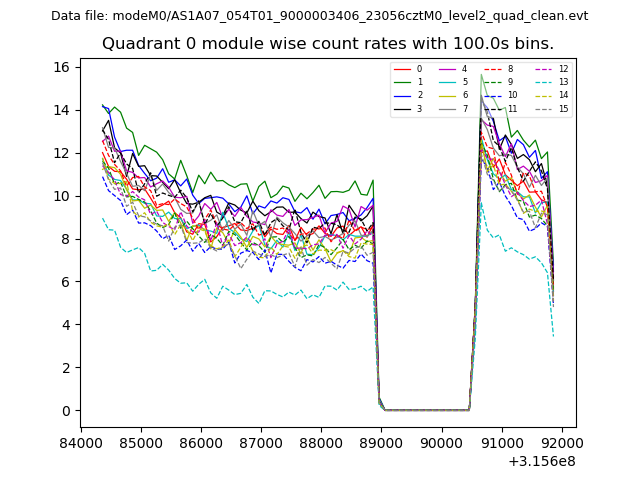
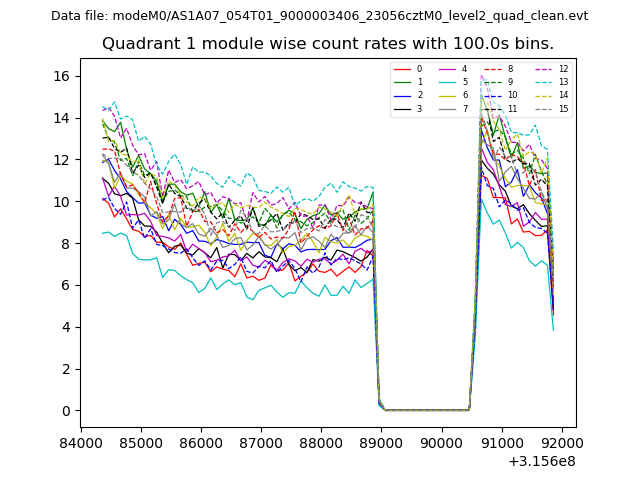
| Module-wise count rates for Quadrant A Data is divided into 100 sec bins |
 |
 |
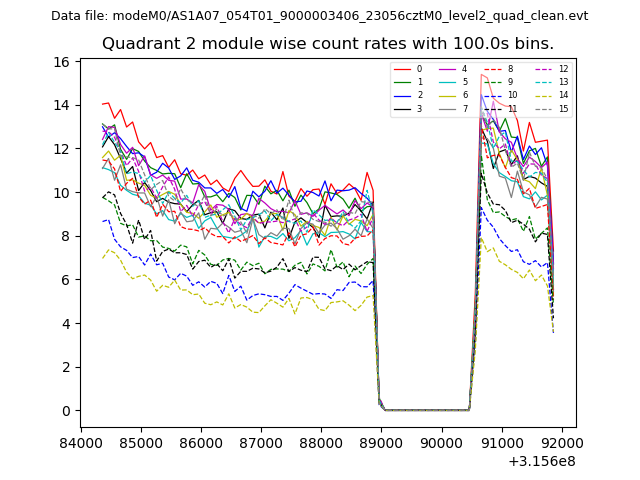
| Module-wise count rates for Quadrant B Data is divided into 100 sec bins |
 |
 |
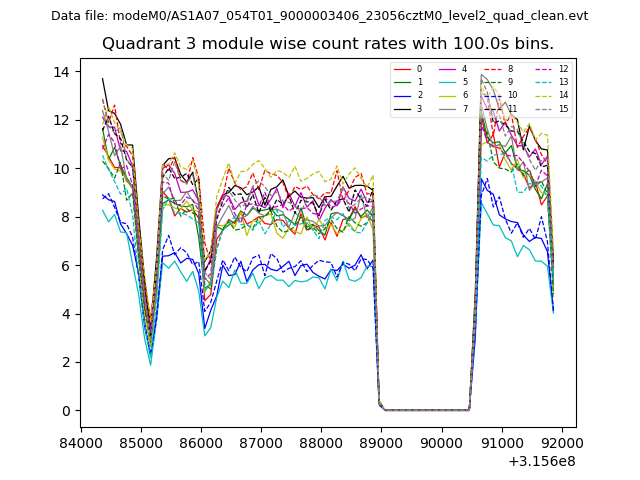
| Module-wise count rates for Quadrant C Data is divided into 100 sec bins |
 |
 |
| Module-wise count rates for Quadrant D Data is divided into 100 sec bins |
 |
 |
| Parameter | Plot |
|---|---|
| CZT HV Monitor | 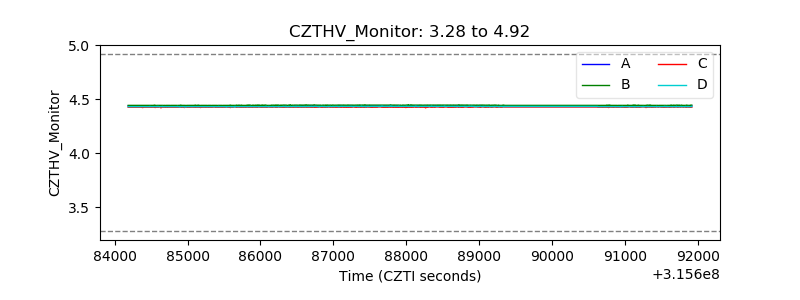 |
| D_VDD | 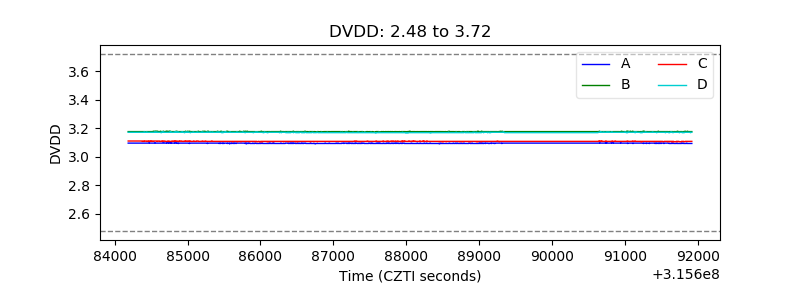 |
| Temperature 1 | 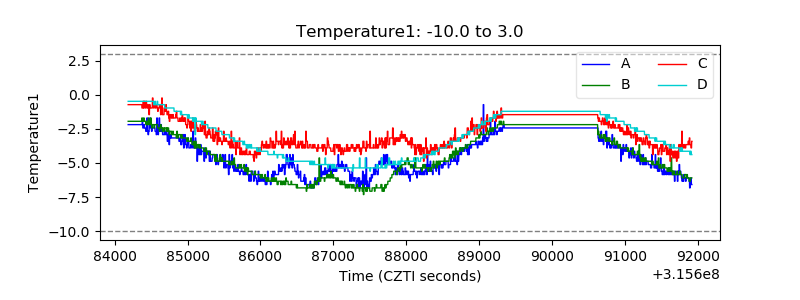 |
| Veto HV Monitor | 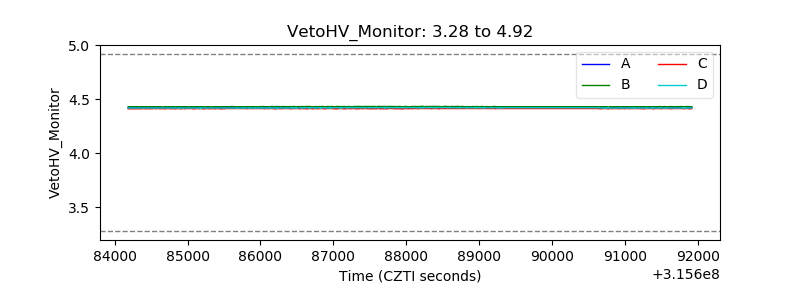 |
| Veto LLD | 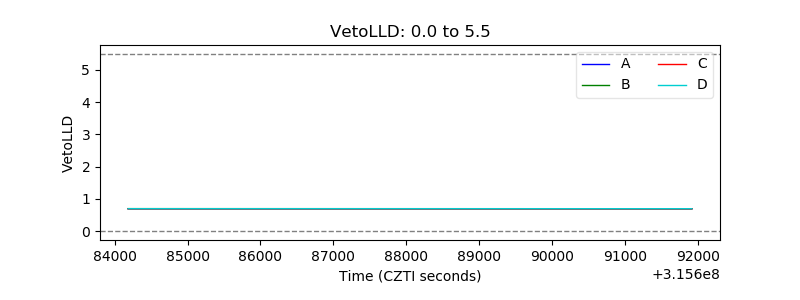 |
| Alpha Counter | 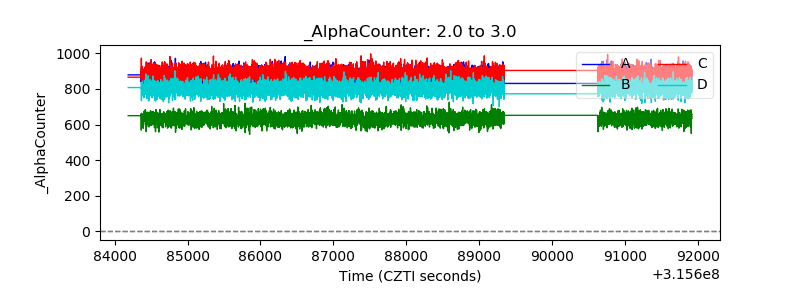 |
| _CPM_Rate | 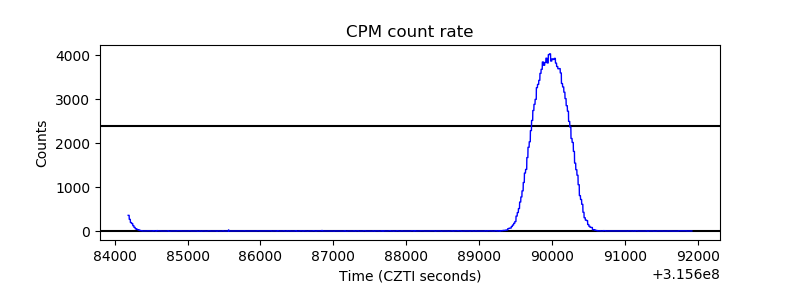 |
| CZT Counter | 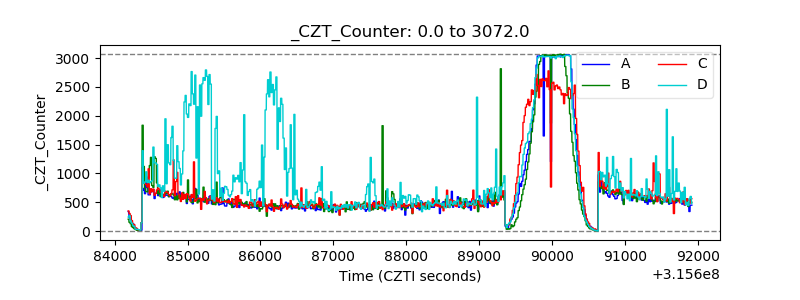 |
| +2.5 Volts monitor |  |
| +5 Volts monitor |  |
| _ROLL_ROT | 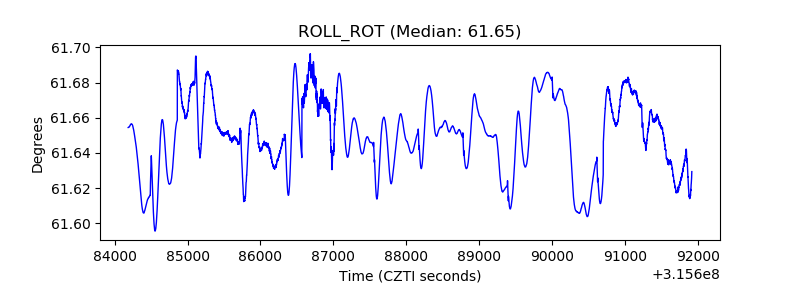 |
| _Roll_DEC | 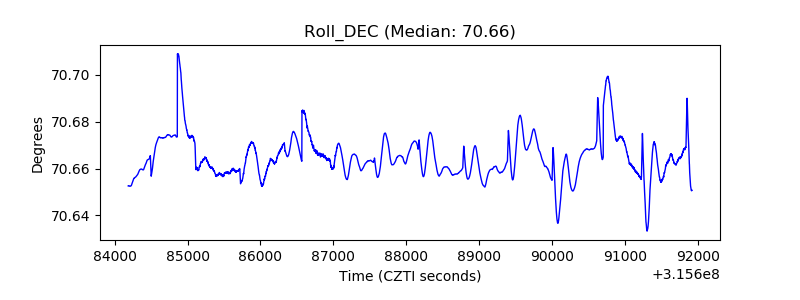 |
| _Roll_RA | 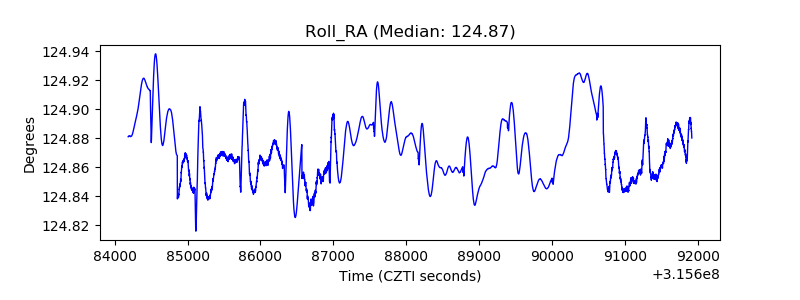 |
| Veto Counter | 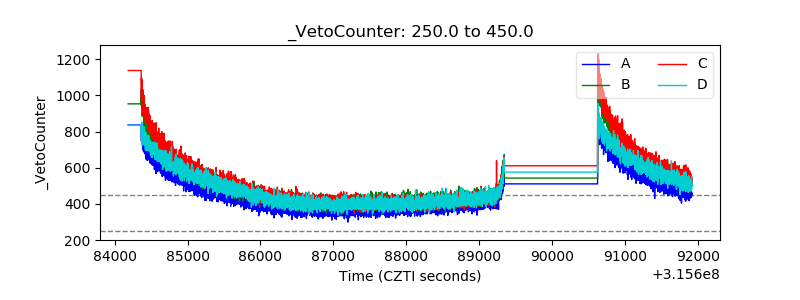 |