| Param | Original file | Final file |
|---|---|---|
| Filename | modeM0/AS1A07_054T01_9000003406_23058cztM0_level2.evt | modeM0/AS1A07_054T01_9000003406_23058cztM0_level2_quad_clean.evt |
| Size (bytes) | 365,690,880 | 86,803,200 |
| Size | 348.8 MB | 82.8 MB |
| Events in quadrant A | 2,378,688 | 571,519 |
| Events in quadrant B | 2,545,440 | 598,685 |
| Events in quadrant C | 2,499,687 | 574,450 |
| Events in quadrant D | 3,321,223 | 543,926 |
| Mode M0 | |||
|---|---|---|---|
| Quadrant | BADHDUFLAG | Total packets | Discarded packets |
| A | 0 | 10239 | 1 |
| B | 0 | 10660 | 1 |
| C | 0 | 10531 | 1 |
| D | 0 | 13184 | 1 |
| Mode SS | |||
|---|---|---|---|
| Quadrant | BADHDUFLAG | Total packets | Discarded packets |
| A | 0 | 98 | 0 |
| B | 0 | 98 | 0 |
| C | 0 | 98 | 0 |
| D | 0 | 98 | 0 |
| Mode M9 | |||
|---|---|---|---|
| Quadrant | BADHDUFLAG | Total packets | Discarded packets |
| A | 0 | 6 | 0 |
| B | 0 | 7 | 0 |
| C | 0 | 7 | 0 |
| D | 0 | 7 | 0 |
| Quadrant | Total seconds | Saturated seconds | Saturation percentage |
|---|---|---|---|
| A | 4845 | 8 | 0.165119% |
| B | 4845 | 58 | 1.197110% |
| C | 4845 | 65 | 1.341589% |
| D | 4845 | 64 | 1.320949% |
Noise dominated data is calculated using 1-second bins in cleaned event files. If a bin has >2000 counts, and if more than 50% of those come from <1% of pixels, then it is considered to be noise-dominated and hence unusable.
| Quadrant | # 1 sec bins | Bins with >0 counts | Bins with >2000 counts | High rate bins dominated by noise | Noise dominated (total time) | Noise dominated (detector-on time) | Marked lightcurve |
|---|---|---|---|---|---|---|---|
| A | 4845 | 4845 | 0 | 0 | 0.00% | 0.00% | 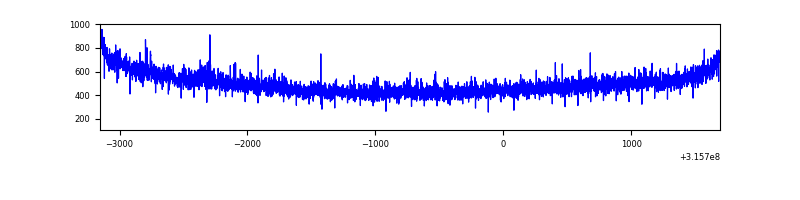 |
| B | 4845 | 4845 | 26 | 26 | 0.54% | 0.54% | 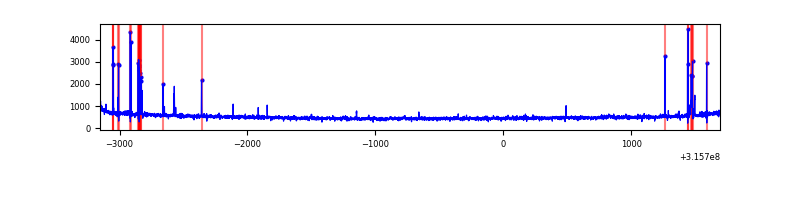 |
| C | 4845 | 4845 | 5 | 5 | 0.10% | 0.10% | 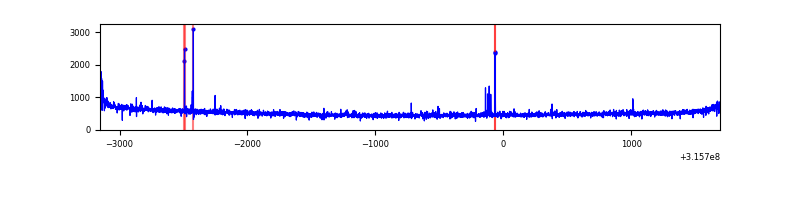 |
| D | 4845 | 4845 | 46 | 46 | 0.95% | 0.95% | 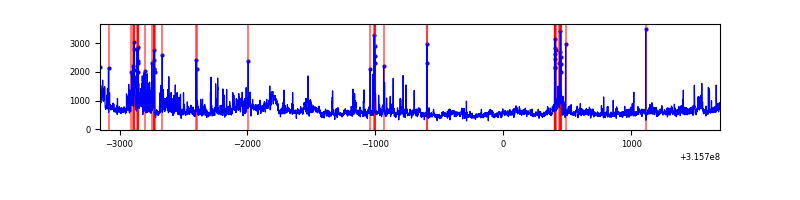 |
Top three noisy pixels from each quadrant. If the there are fewer than three noisy pixels in the level2.evt file, extra rows are filled as -1
| Pixel properties | Quadrant properties | ||||||
|---|---|---|---|---|---|---|---|
| Quadrant | DetID | PixID | Counts | Sigma | Mean | Median | Sigma |
| A | 2 | 79 | 7977 | 60.3 | 613 | 602 | 122.3 |
| A | 13 | 254 | 7673 | 57.81 | 613 | 602 | 122.3 |
| A | 6 | 16 | 7298 | 54.75 | 613 | 602 | 122.3 |
| B | 4 | 216 | 74874 | 644.96 | 619 | 605 | 115.2 |
| B | 5 | 172 | 31328 | 266.8 | 619 | 605 | 115.2 |
| B | 12 | 111 | 13219 | 109.54 | 619 | 605 | 115.2 |
| C | 14 | 238 | 98296 | 704.48 | 601 | 607 | 138.7 |
| C | 0 | 207 | 36241 | 256.97 | 601 | 607 | 138.7 |
| C | 0 | 10 | 15800 | 109.56 | 601 | 607 | 138.7 |
| D | 1 | 52 | 892839 | 6287.96 | 595 | 579 | 141.9 |
| D | 13 | 172 | 62473 | 436.18 | 595 | 579 | 141.9 |
| D | 12 | 227 | 50889 | 354.55 | 595 | 579 | 141.9 |
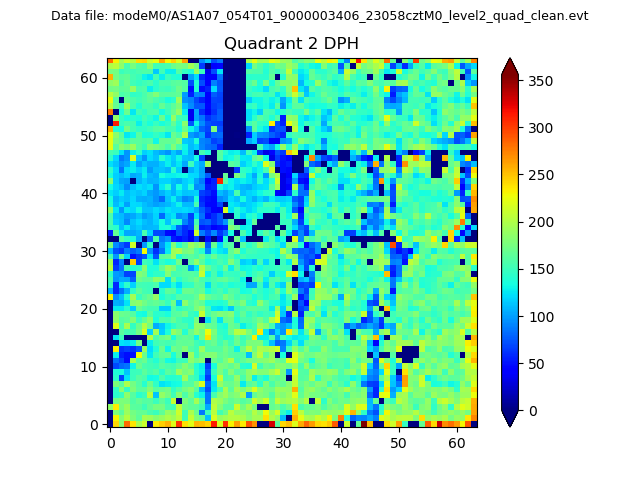
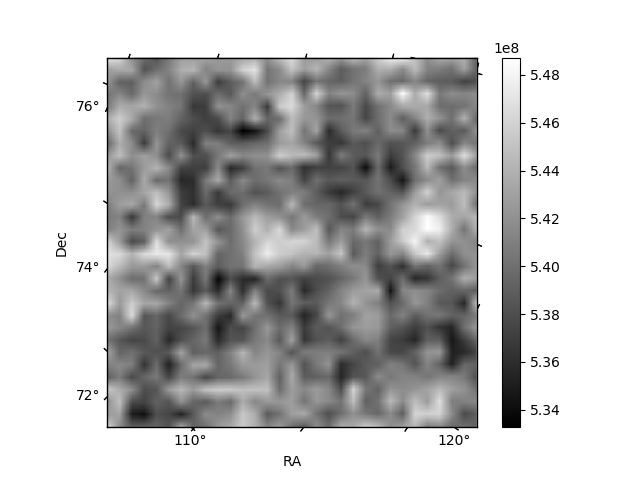
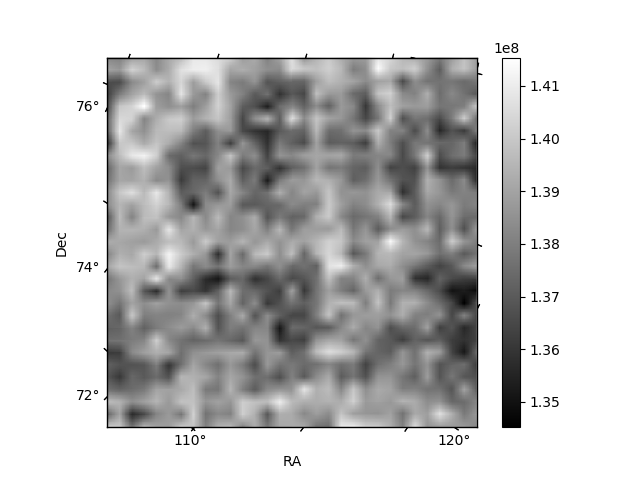
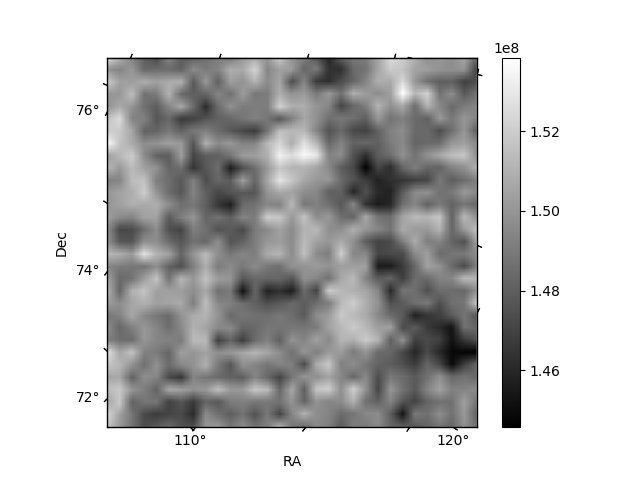
Histogram calculated using DETX and DETY for each event in the final _common_clean file
| Quadrant A | 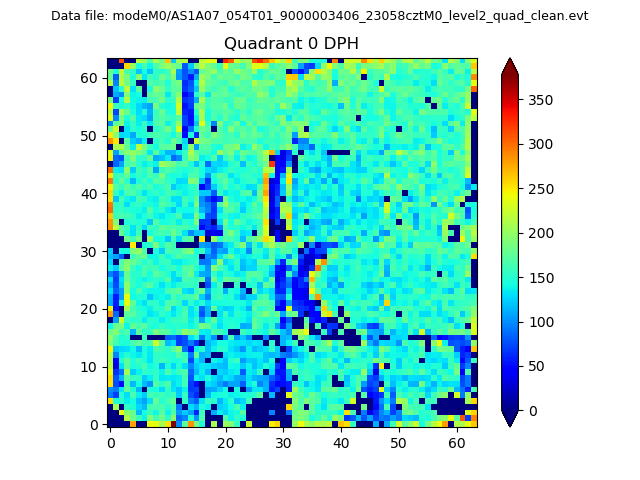 |
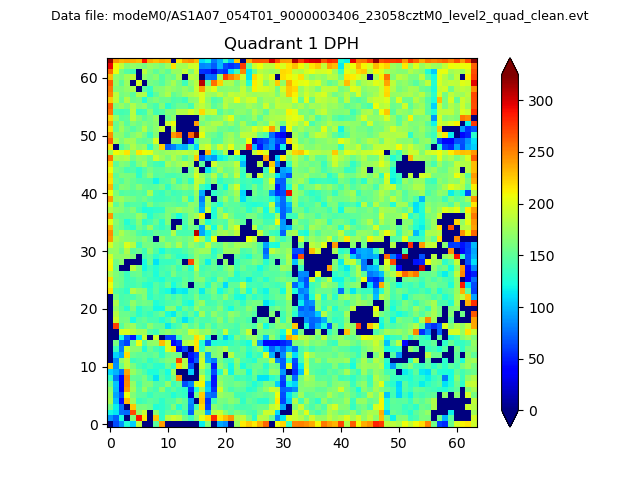 |
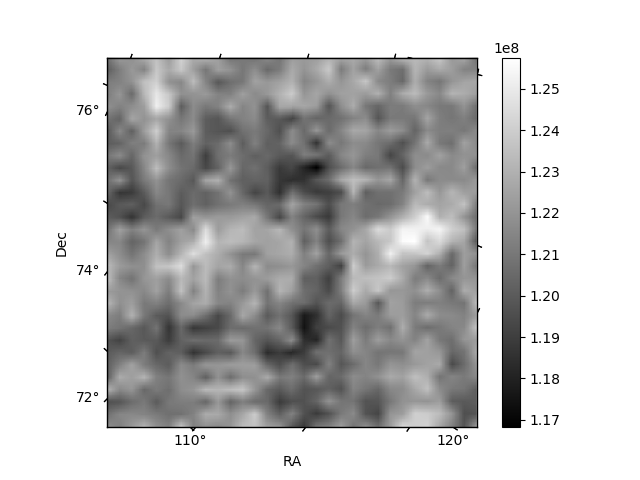
Quadrant B |
|---|---|---|---|
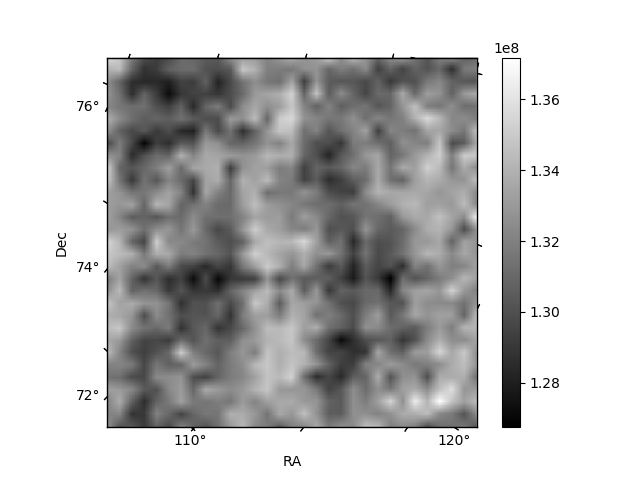
| Quadrant D | 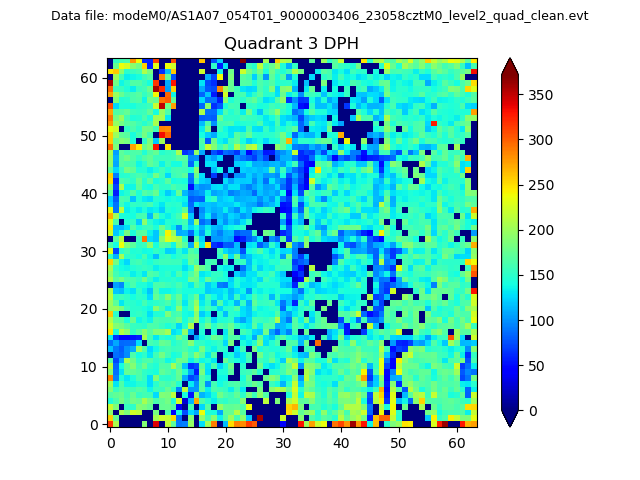 |
 |
Quadrant C |
| Plot type | Count rate plots | Images |
|---|---|---|
| Comparison with Poisson distribution Blue bars denote a histogram of data divided into 1 sec bins. Red curve is a Poisson curve with rate = median count rate of data. |
 |
 |
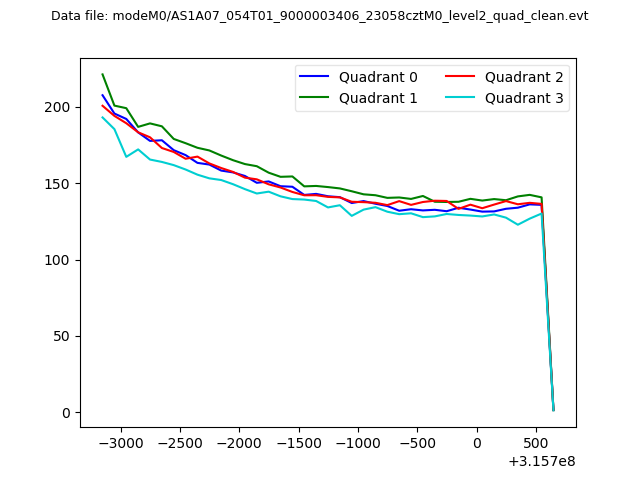
| Quadrant-wise count rates Data is divided into 100 sec bins |
 |
|
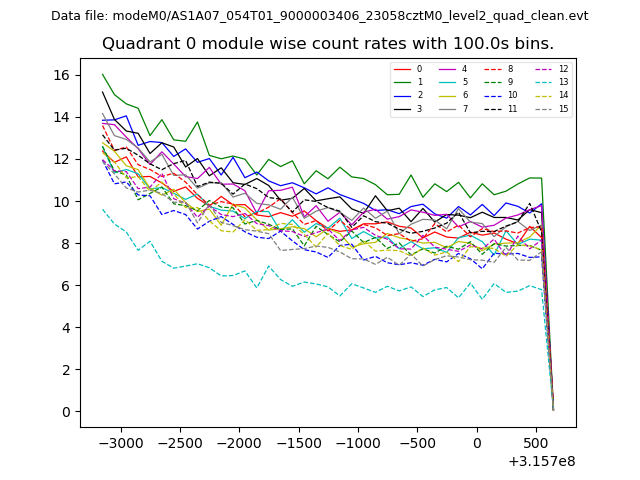
| Module-wise count rates for Quadrant A Data is divided into 100 sec bins |
 |
 |
| Module-wise count rates for Quadrant B Data is divided into 100 sec bins |
 |
 |
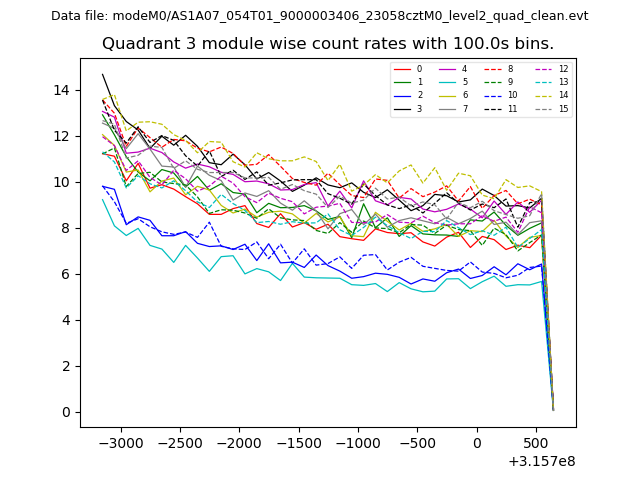
| Module-wise count rates for Quadrant C Data is divided into 100 sec bins |
 |
 |
| Module-wise count rates for Quadrant D Data is divided into 100 sec bins |
 |
 |
| Parameter | Plot |
|---|---|
| CZT HV Monitor |  |
| D_VDD | 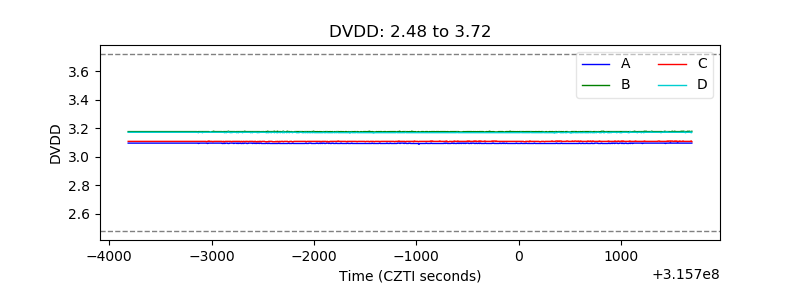 |
| Temperature 1 | 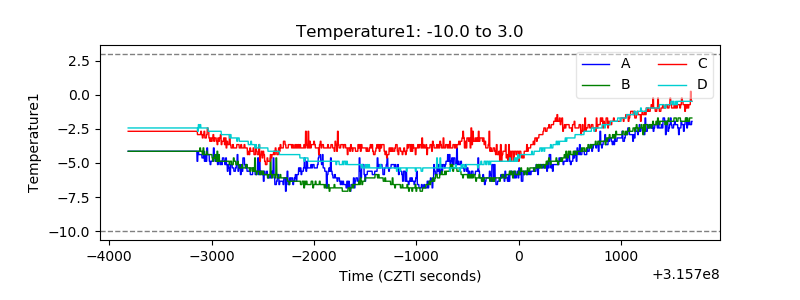 |
| Veto HV Monitor | 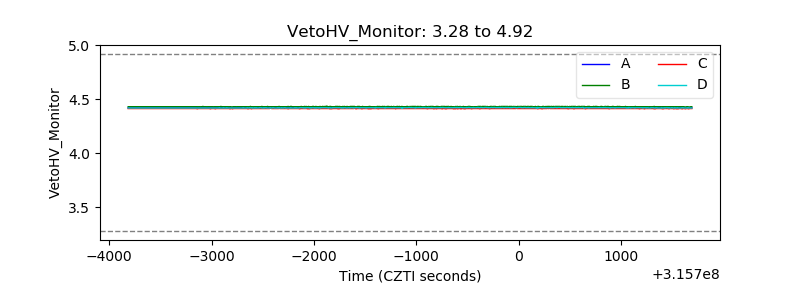 |
| Veto LLD | 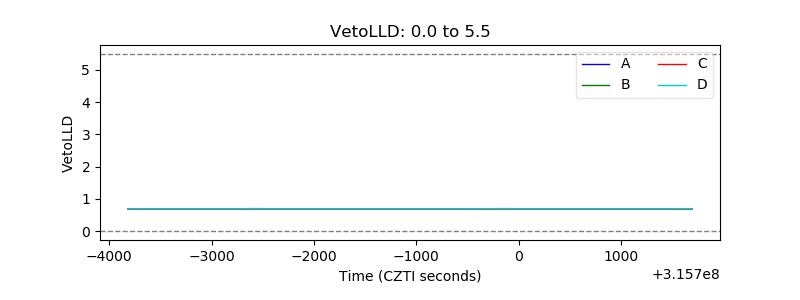 |
| Alpha Counter |  |
| _CPM_Rate | 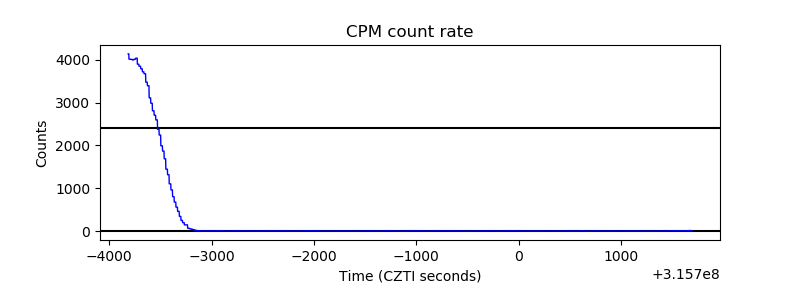 |
| CZT Counter | 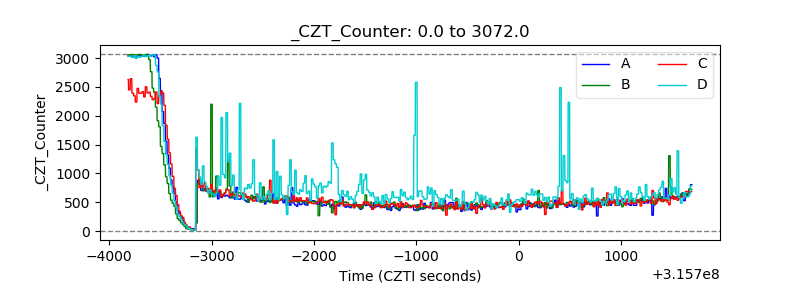 |
| +2.5 Volts monitor |  |
| +5 Volts monitor |  |
| _ROLL_ROT |  |
| _Roll_DEC | 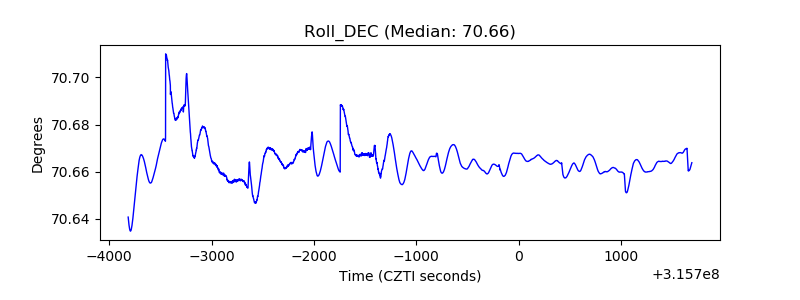 |
| _Roll_RA | 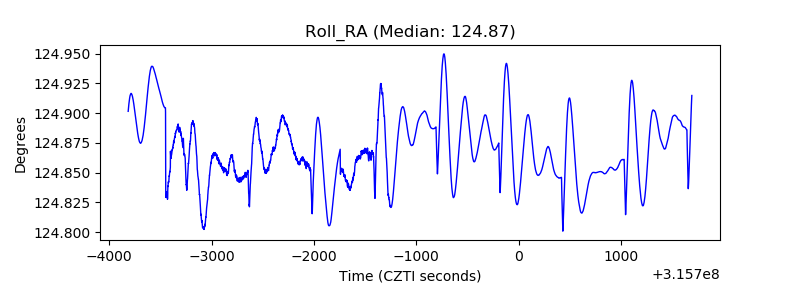 |
| Veto Counter | 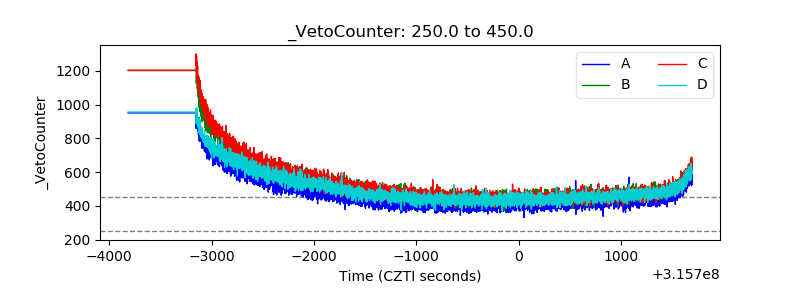 |