| Param | Original file | Final file |
|---|---|---|
| Filename | modeM0/AS1A07_054T01_9000003406_23236cztM0_level2.evt | modeM0/AS1A07_054T01_9000003406_23236cztM0_level2_quad_clean.evt |
| Size (bytes) | 338,310,720 | 81,288,000 |
| Size | 322.6 MB | 77.5 MB |
| Events in quadrant A | 2,332,371 | 532,976 |
| Events in quadrant B | 2,347,695 | 549,346 |
| Events in quadrant C | 2,582,045 | 522,307 |
| Events in quadrant D | 2,651,849 | 515,481 |
| Mode M0 | |||
|---|---|---|---|
| Quadrant | BADHDUFLAG | Total packets | Discarded packets |
| A | 0 | 10917 | 802 |
| B | 0 | 10937 | 746 |
| C | 0 | 11728 | 885 |
| D | 0 | 12080 | 754 |
| Mode SS | |||
|---|---|---|---|
| Quadrant | BADHDUFLAG | Total packets | Discarded packets |
| A | 0 | 105 | 13 |
| B | 0 | 106 | 12 |
| C | 0 | 105 | 9 |
| D | 0 | 105 | 9 |
| Mode M9 | |||
|---|---|---|---|
| Quadrant | BADHDUFLAG | Total packets | Discarded packets |
| A | 0 | 5 | 1 |
| B | 0 | 4 | 0 |
| C | 0 | 4 | 0 |
| D | 0 | 4 | 0 |
| Quadrant | Total seconds | Saturated seconds | Saturation percentage |
|---|---|---|---|
| A | 4858 | 10 | 0.205846% |
| B | 4891 | 33 | 0.674709% |
| C | 4882 | 106 | 2.171241% |
| D | 4896 | 44 | 0.898693% |
Noise dominated data is calculated using 1-second bins in cleaned event files. If a bin has >2000 counts, and if more than 50% of those come from <1% of pixels, then it is considered to be noise-dominated and hence unusable.
| Quadrant | # 1 sec bins | Bins with >0 counts | Bins with >2000 counts | High rate bins dominated by noise | Noise dominated (total time) | Noise dominated (detector-on time) | Marked lightcurve |
|---|---|---|---|---|---|---|---|
| A | 5649 | 4963 | 0 | 0 | 0.00% | 0.00% | 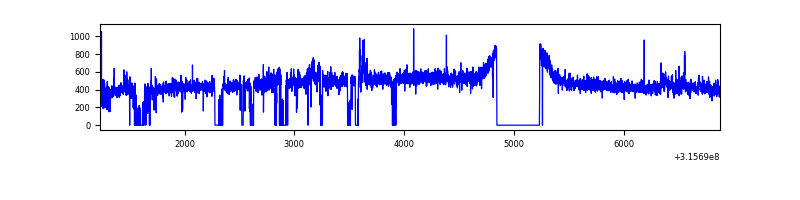 |
| B | 5649 | 4996 | 3 | 3 | 0.05% | 0.06% | 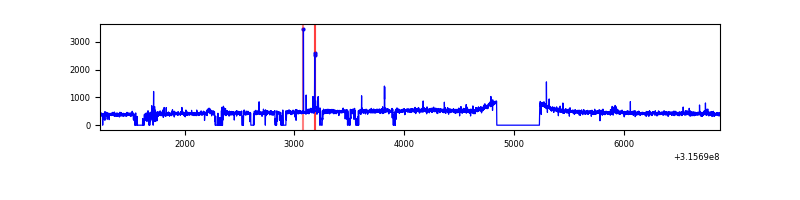 |
| C | 5649 | 4990 | 34 | 34 | 0.60% | 0.68% | 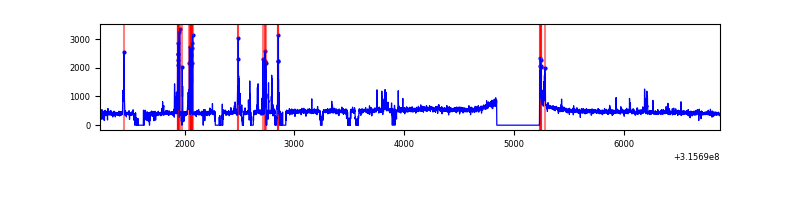 |
| D | 5649 | 5005 | 25 | 25 | 0.44% | 0.50% | 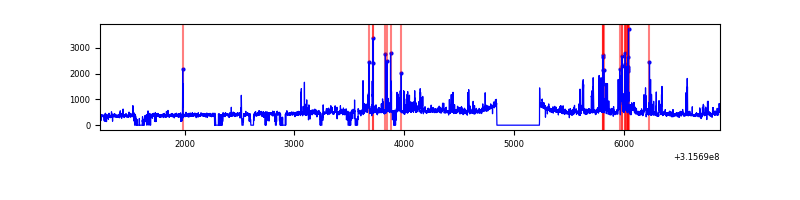 |
Top three noisy pixels from each quadrant. If the there are fewer than three noisy pixels in the level2.evt file, extra rows are filled as -1
| Pixel properties | Quadrant properties | ||||||
|---|---|---|---|---|---|---|---|
| Quadrant | DetID | PixID | Counts | Sigma | Mean | Median | Sigma |
| A | 13 | 252 | 66103 | 551.3 | 584 | 572 | 118.9 |
| A | 6 | 16 | 11831 | 94.72 | 584 | 572 | 118.9 |
| A | 13 | 254 | 7306 | 56.65 | 584 | 572 | 118.9 |
| B | 12 | 111 | 13579 | 113.89 | 588 | 573 | 114.2 |
| B | 11 | 111 | 12066 | 100.64 | 588 | 573 | 114.2 |
| B | 14 | 111 | 10603 | 87.83 | 588 | 573 | 114.2 |
| C | 8 | 208 | 252144 | 1893.45 | 565 | 568 | 132.9 |
| C | 14 | 238 | 88644 | 662.89 | 565 | 568 | 132.9 |
| C | 10 | 9 | 15027 | 108.82 | 565 | 568 | 132.9 |
| D | 7 | 238 | 249952 | 1775.18 | 574 | 556 | 140.5 |
| D | 1 | 52 | 120998 | 857.29 | 574 | 556 | 140.5 |
| D | 2 | 152 | 51384 | 361.79 | 574 | 556 | 140.5 |
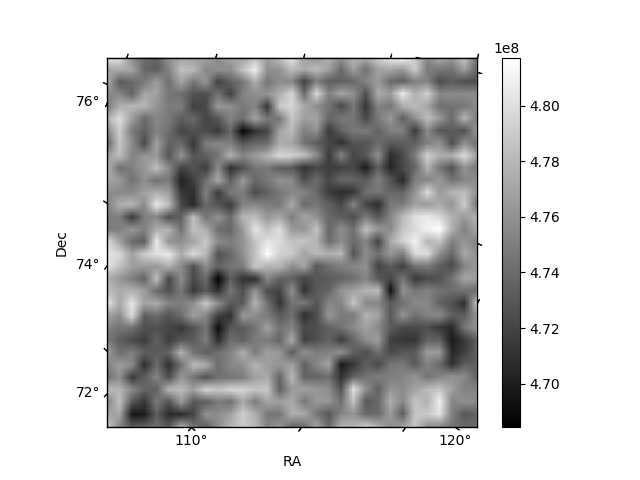
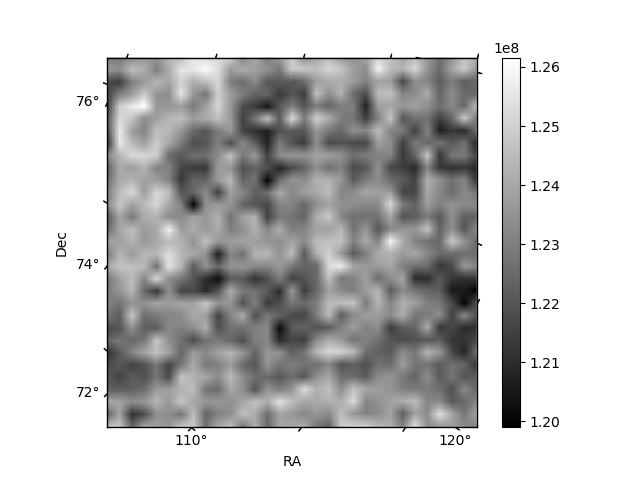
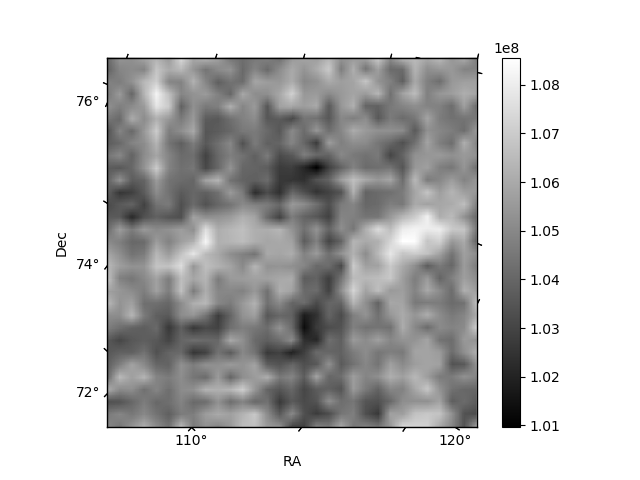
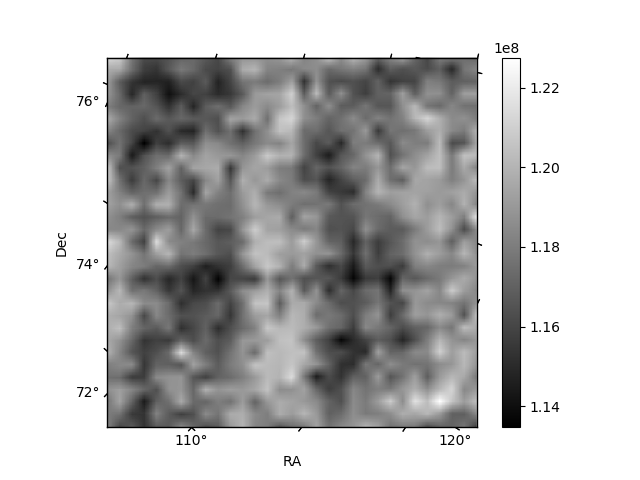
Histogram calculated using DETX and DETY for each event in the final _common_clean file
| Quadrant A | 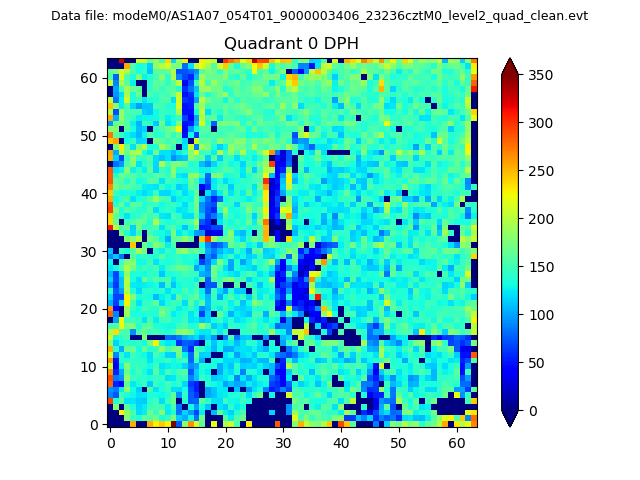 |
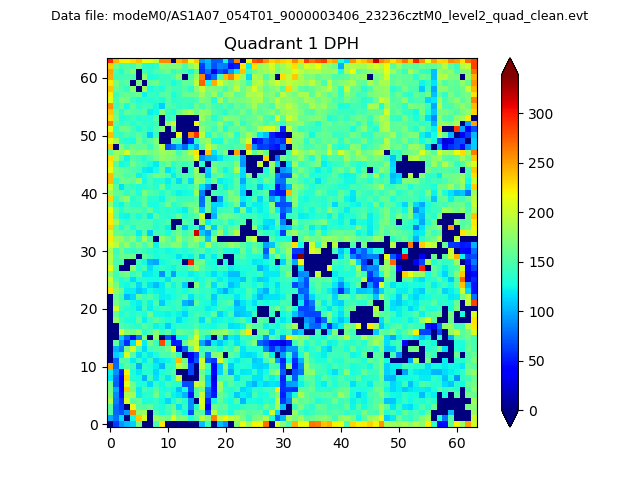 |
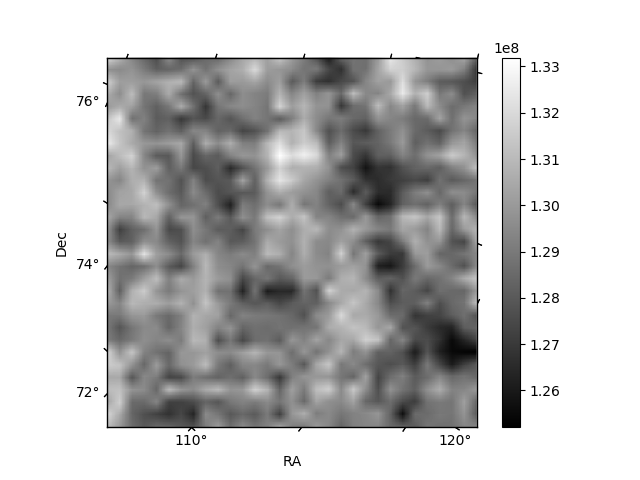
Quadrant B |
|---|---|---|---|
| Quadrant D | 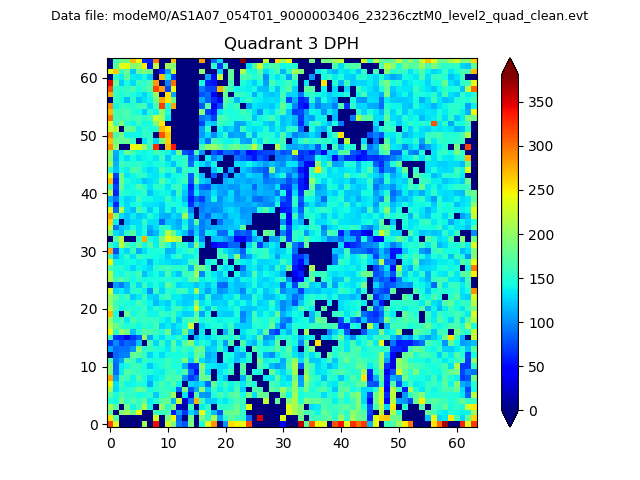 |
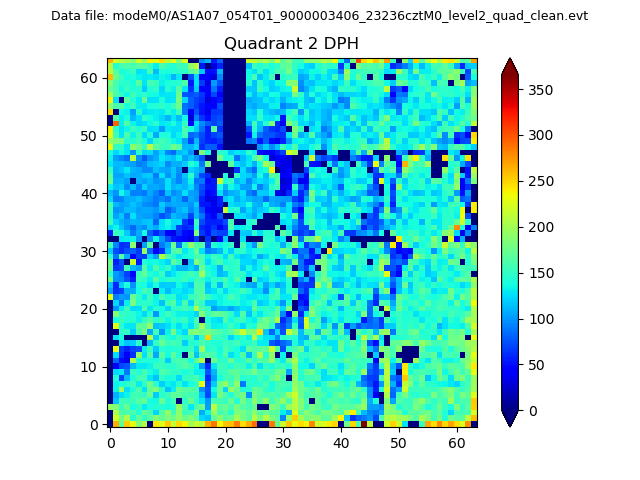 |
Quadrant C |
| Plot type | Count rate plots | Images |
|---|---|---|
| Comparison with Poisson distribution Blue bars denote a histogram of data divided into 1 sec bins. Red curve is a Poisson curve with rate = median count rate of data. |
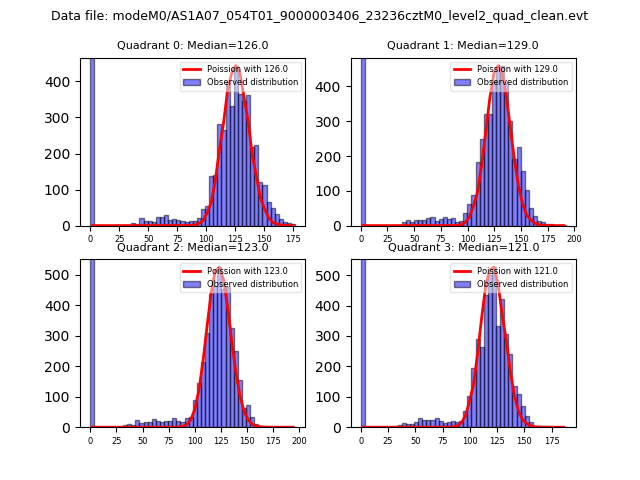 |
 |
| Quadrant-wise count rates Data is divided into 100 sec bins |
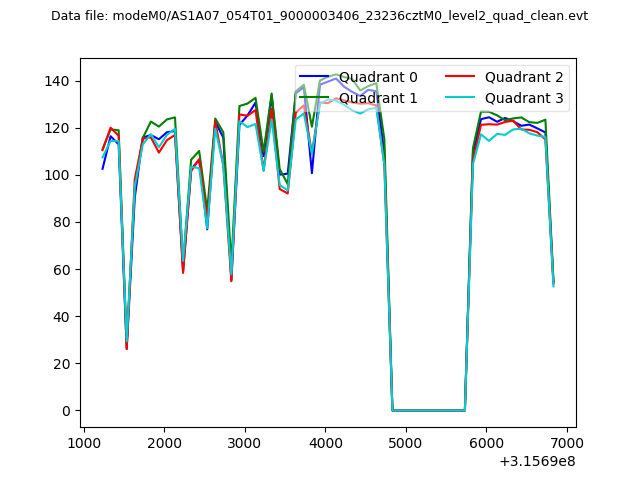 |
|
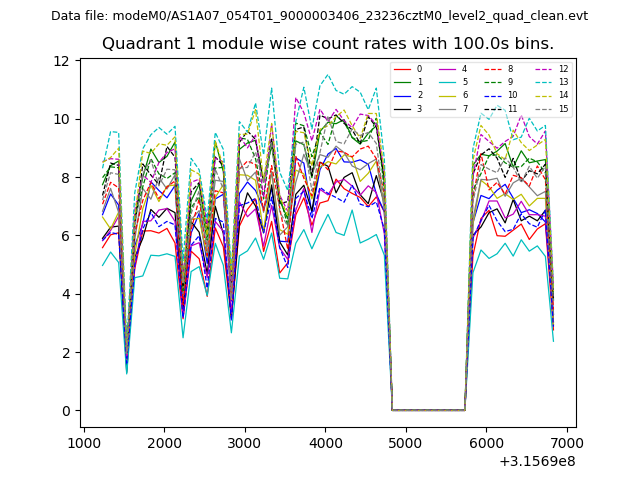
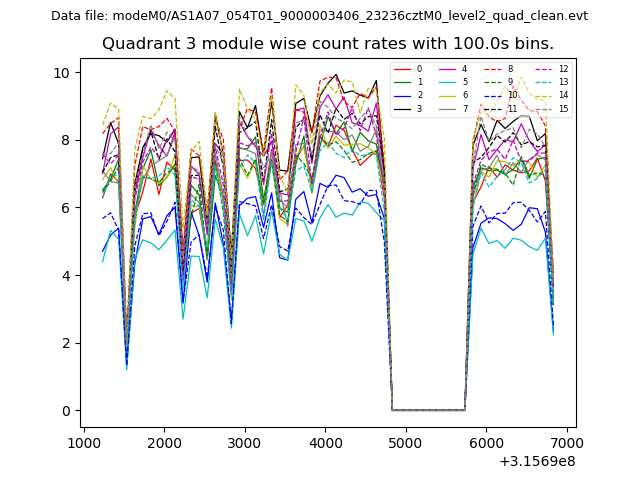
| Module-wise count rates for Quadrant A Data is divided into 100 sec bins |
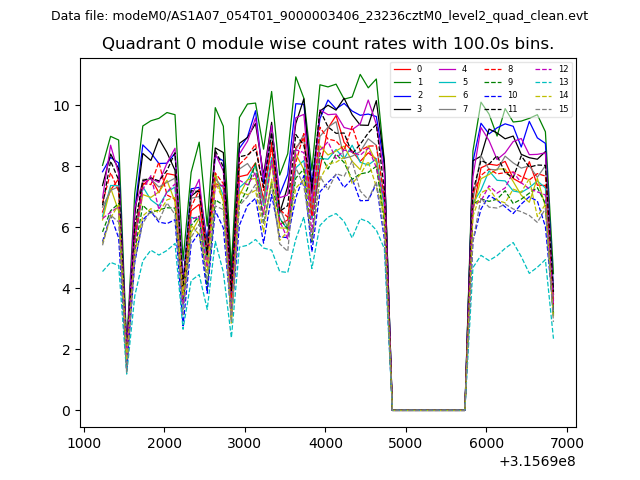 |
 |
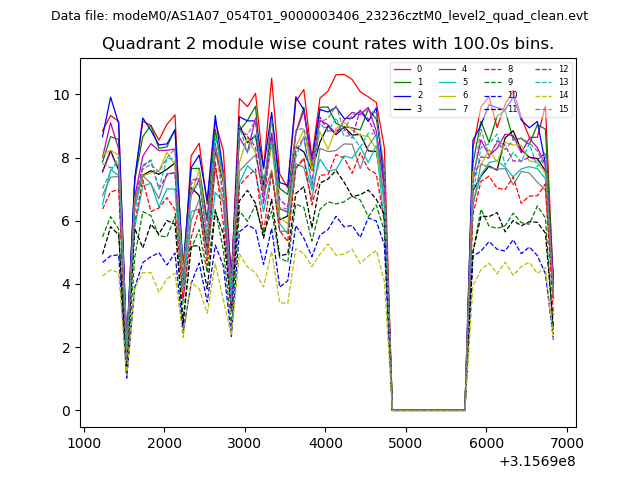
| Module-wise count rates for Quadrant B Data is divided into 100 sec bins |
 |
 |
| Module-wise count rates for Quadrant C Data is divided into 100 sec bins |
 |
 |
| Module-wise count rates for Quadrant D Data is divided into 100 sec bins |
 |
 |
| Parameter | Plot |
|---|---|
| CZT HV Monitor | 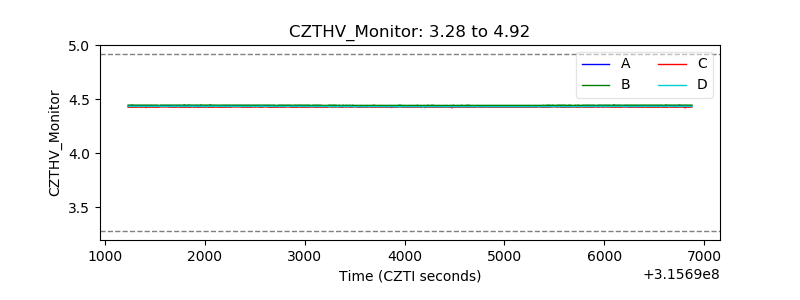 |
| D_VDD | 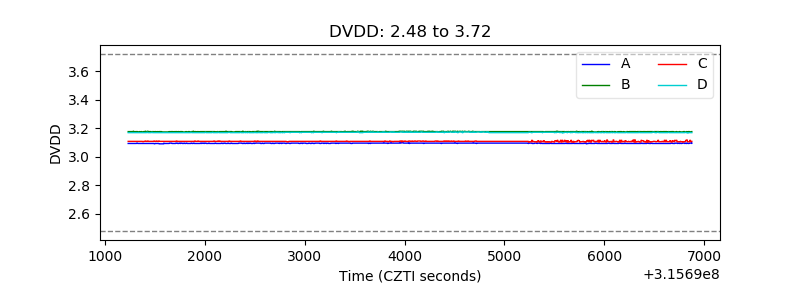 |
| Temperature 1 | 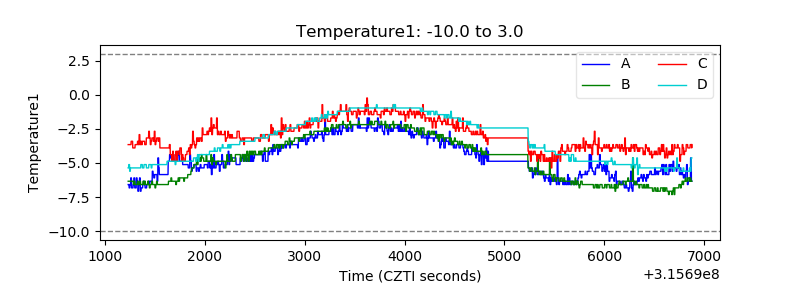 |
| Veto HV Monitor | 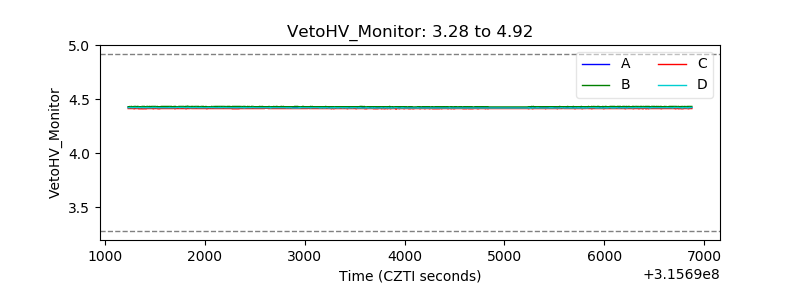 |
| Veto LLD | 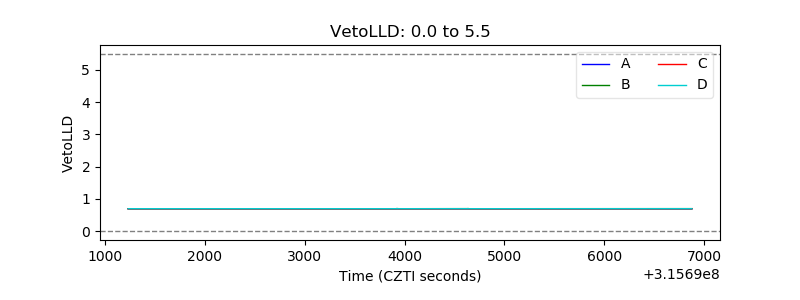 |
| Alpha Counter | 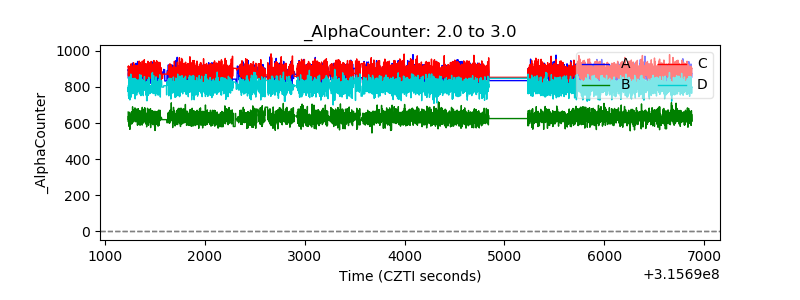 |
| _CPM_Rate | 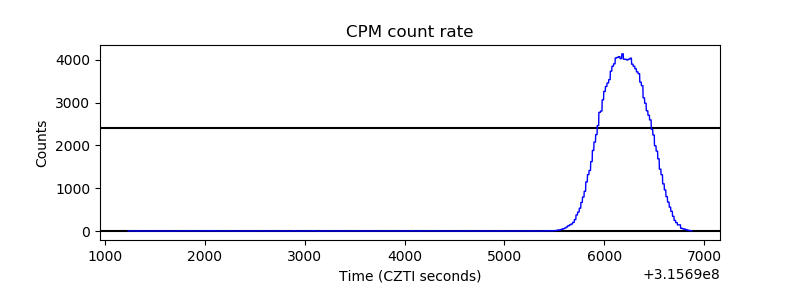 |
| CZT Counter | 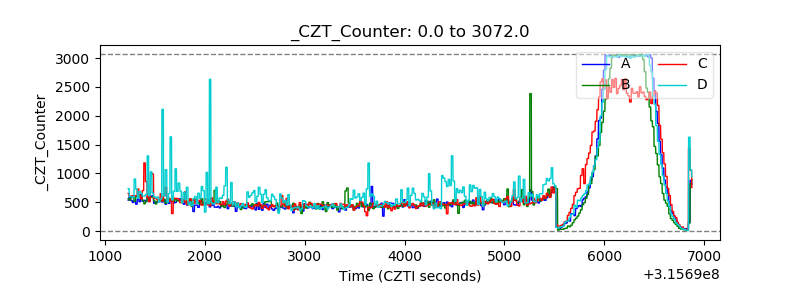 |
| +2.5 Volts monitor |  |
| +5 Volts monitor |  |
| _ROLL_ROT |  |
| _Roll_DEC | 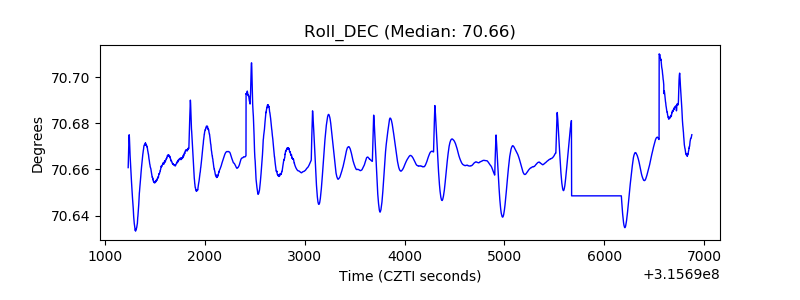 |
| _Roll_RA | 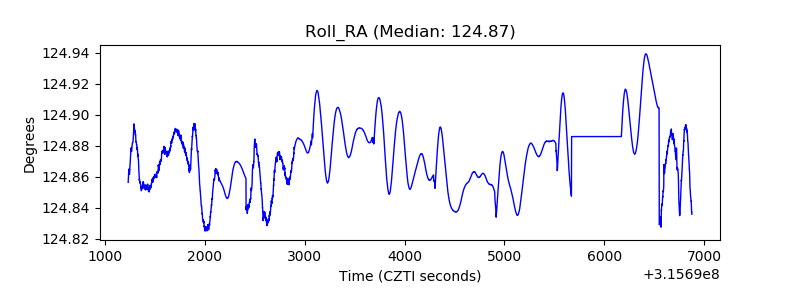 |
| Veto Counter |  |