| Param | Original file | Final file |
|---|---|---|
| Filename | modeM0/AS1A07_138T05_9000003410cztM0_level2.fits | modeM0/AS1A07_138T05_9000003410cztM0_level2_quad_clean.evt |
| Size (bytes) | 410,192,640 | 368,205,120 |
| Size | 391.2 MB | 351.1 MB |
| Events in quadrant A | 2,482,828 | 2,093,910 |
| Events in quadrant B | 2,432,816 | 2,192,995 |
| Events in quadrant C | 2,494,918 | 2,094,165 |
| Events in quadrant D | 2,164,788 | 1,922,820 |
| Mode SS | |||
|---|---|---|---|
| Quadrant | BADHDUFLAG | Total packets | Discarded packets |
| A | 0 | 842 | 0 |
| B | 0 | 842 | 0 |
| C | 0 | 842 | 0 |
| D | 0 | 842 | 0 |
| Mode M9 | |||
|---|---|---|---|
| Quadrant | BADHDUFLAG | Total packets | Discarded packets |
| A | 0 | 58 | 0 |
| B | 0 | 58 | 0 |
| C | 0 | 58 | 0 |
| D | 0 | 58 | 0 |
| Mode M0 | |||
|---|---|---|---|
| Quadrant | BADHDUFLAG | Total packets | Discarded packets |
| A | 0 | 105603 | 0 |
| B | 0 | 89401 | 0 |
| C | 0 | 91126 | 0 |
| D | 0 | 109116 | 0 |
| Quadrant | Total seconds | Saturated seconds | Saturation percentage |
|---|---|---|---|
| A | 41461 | 2029 | 4.893756% |
| B | 41461 | 657 | 1.584622% |
| C | 41461 | 915 | 2.206893% |
| D | 41461 | 1421 | 3.427317% |
Noise dominated data is calculated using 1-second bins in cleaned event files. If a bin has >2000 counts, and if more than 50% of those come from <1% of pixels, then it is considered to be noise-dominated and hence unusable.
| Quadrant | # 1 sec bins | Bins with >0 counts | Bins with >2000 counts | High rate bins dominated by noise | Noise dominated (total time) | Noise dominated (detector-on time) | Marked lightcurve |
|---|---|---|---|---|---|---|---|
| A | 47171 | 41454 | 0 | 0 | 0.00% | 0.00% | 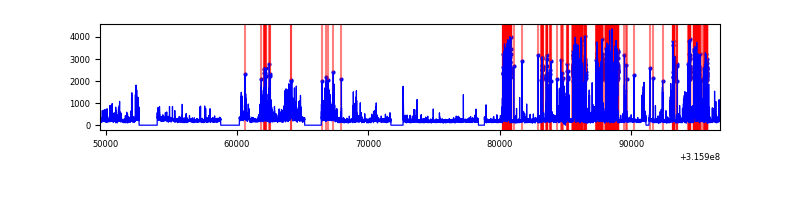 |
| B | 47171 | 41459 | 0 | 0 | 0.00% | 0.00% | 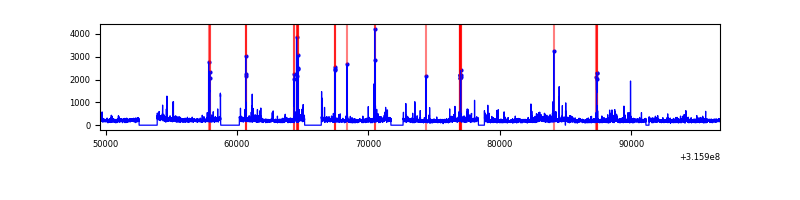 |
| C | 47171 | 41460 | 0 | 0 | 0.00% | 0.00% | 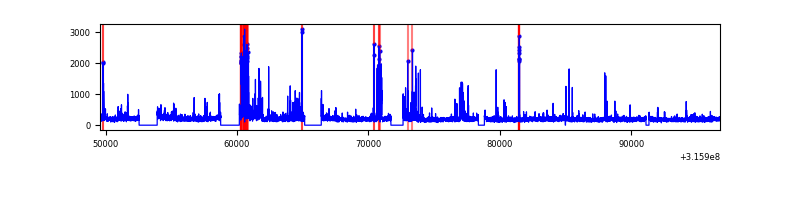 |
| D | 47171 | 41455 | 0 | 0 | 0.00% | 0.00% | 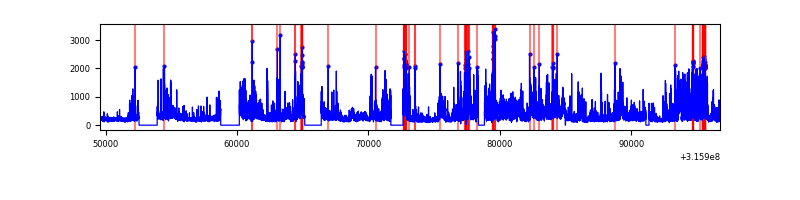 |
Top three noisy pixels from each quadrant. If the there are fewer than three noisy pixels in the level2.evt file, extra rows are filled as -1
| Pixel properties | Quadrant properties | ||||||
|---|---|---|---|---|---|---|---|
| Quadrant | DetID | PixID | Counts | Sigma | Mean | Median | Sigma |
| A | 0 | 29 | 2298 | 10.52 | 645 | 606 | 160.9 |
| A | 7 | 110 | 2086 | 9.2 | 645 | 606 | 160.9 |
| A | 14 | 79 | 1793 | 7.38 | 645 | 606 | 160.9 |
| B | 2 | 9 | 1973 | 10.42 | 645 | 614 | 130.5 |
| B | 3 | 80 | 1697 | 8.3 | 645 | 614 | 130.5 |
| B | 2 | 8 | 1656 | 7.99 | 645 | 614 | 130.5 |
| C | 1 | 80 | 1951 | 7.88 | 659 | 618 | 169.1 |
| C | 1 | 81 | 1895 | 7.55 | 659 | 618 | 169.1 |
| C | 12 | 241 | 1712 | 6.47 | 659 | 618 | 169.1 |
| D | 4 | 246 | 1627 | 6.44 | 617 | 562 | 165.4 |
| D | 7 | 3 | 1512 | 5.74 | 617 | 562 | 165.4 |
| D | 10 | 189 | 1499 | 5.66 | 617 | 562 | 165.4 |
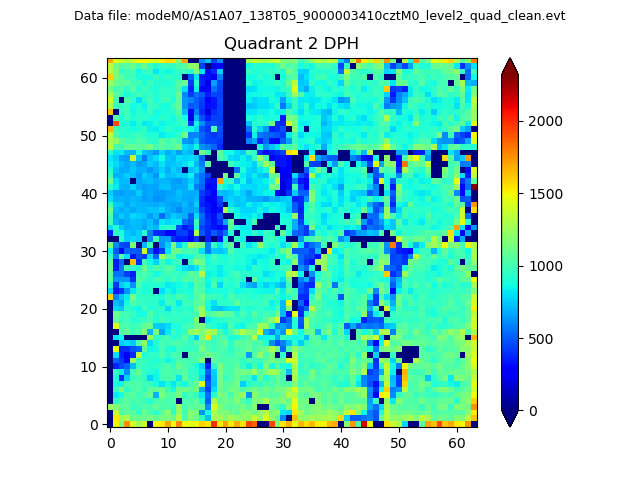
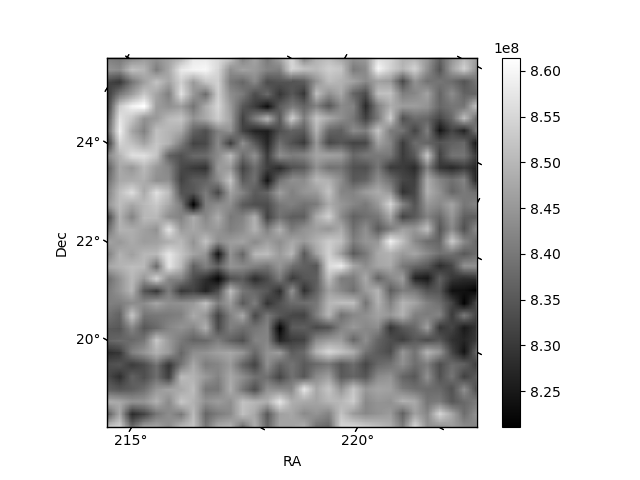
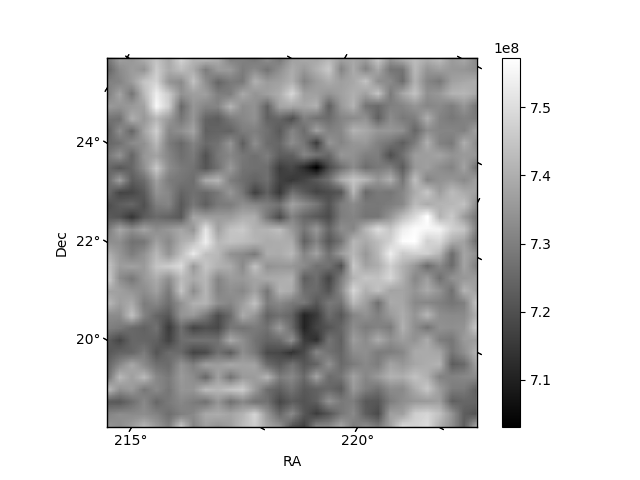
Histogram calculated using DETX and DETY for each event in the final _common_clean file
| Quadrant A | 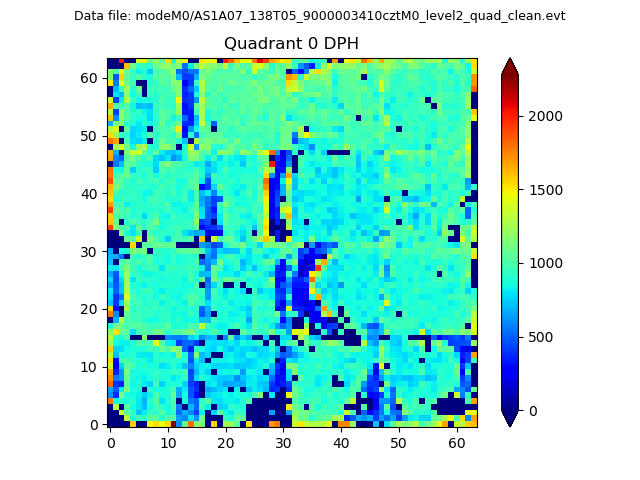 |
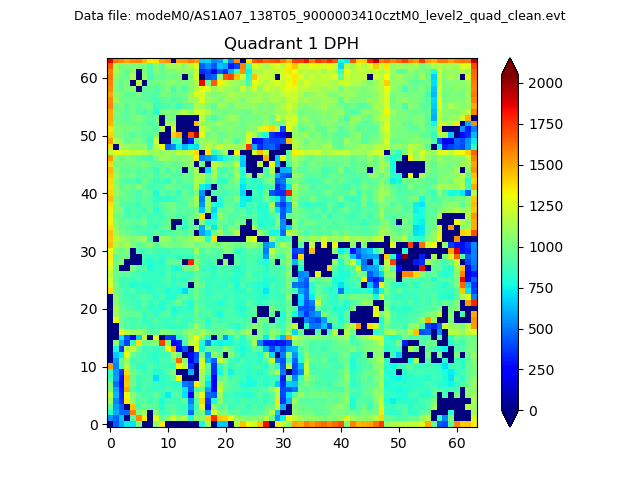 |
Quadrant B |
|---|---|---|---|
| Quadrant D | 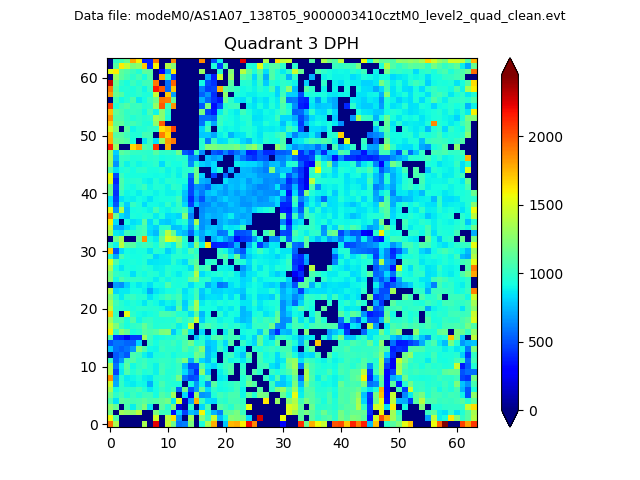 |
 |
Quadrant C |
| Plot type | Count rate plots | Images |
|---|---|---|
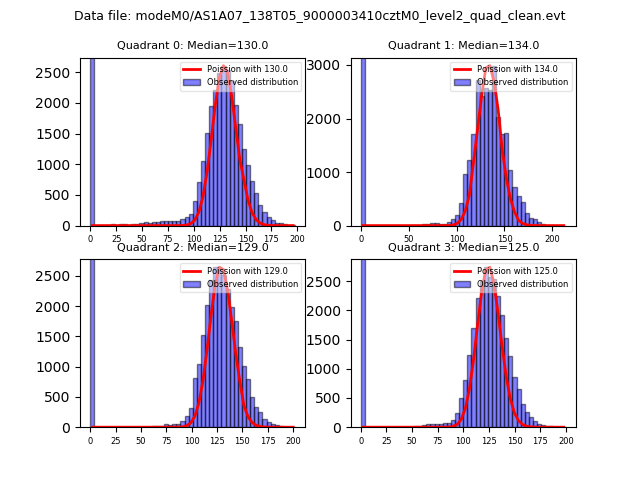
| Comparison with Poisson distribution Blue bars denote a histogram of data divided into 1 sec bins. Red curve is a Poisson curve with rate = median count rate of data. |
 |
 |
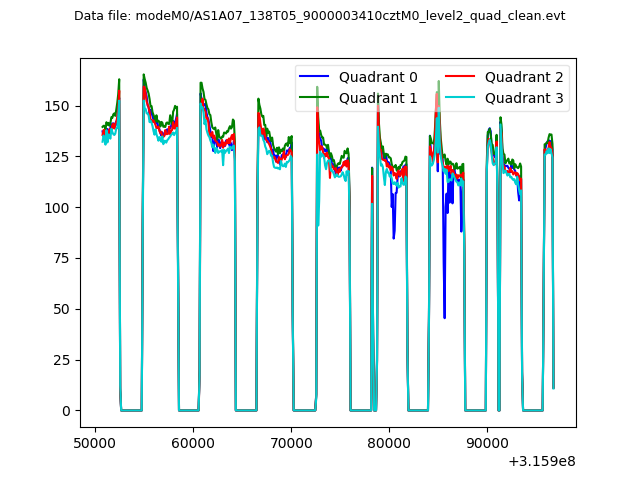
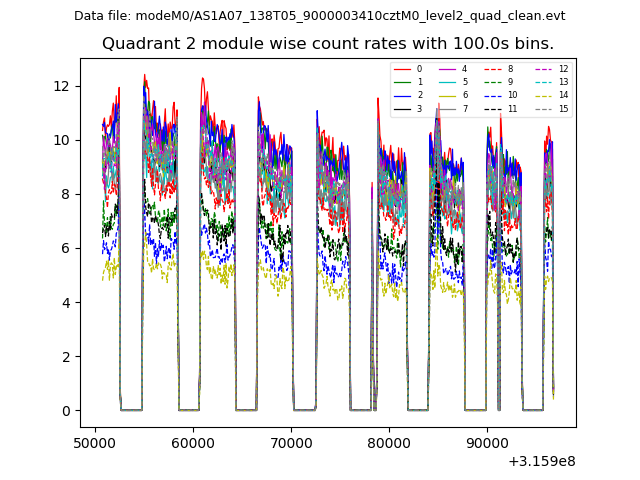
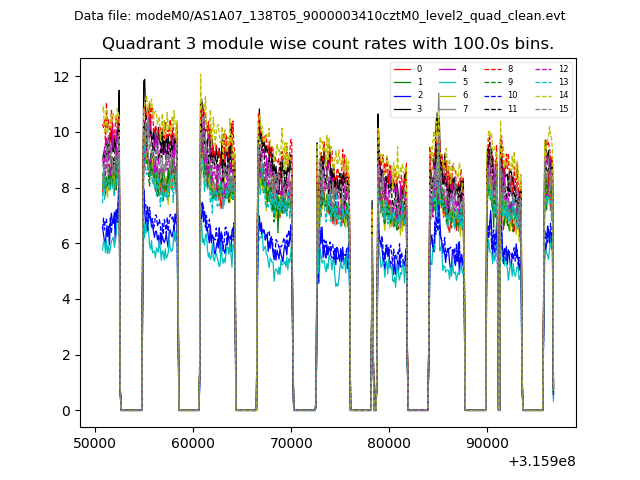
| Quadrant-wise count rates Data is divided into 100 sec bins |
 |
|
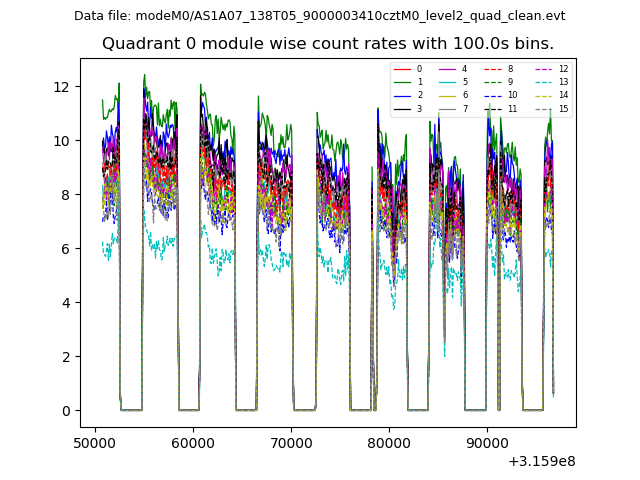
| Module-wise count rates for Quadrant A Data is divided into 100 sec bins |
 |
 |
| Module-wise count rates for Quadrant B Data is divided into 100 sec bins |
 |
 |
| Module-wise count rates for Quadrant C Data is divided into 100 sec bins |
 |
 |
| Module-wise count rates for Quadrant D Data is divided into 100 sec bins |
 |
 |
| Parameter | Plot |
|---|---|
| CZT HV Monitor | 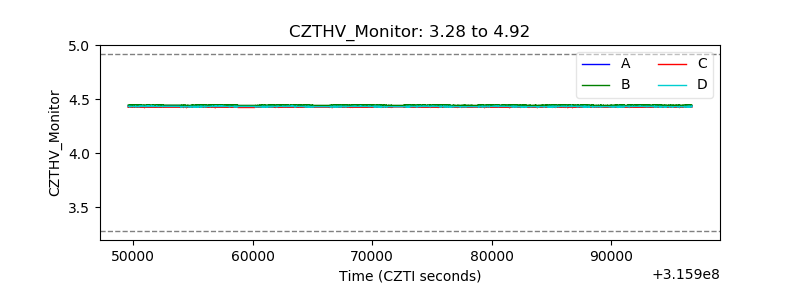 |
| D_VDD | 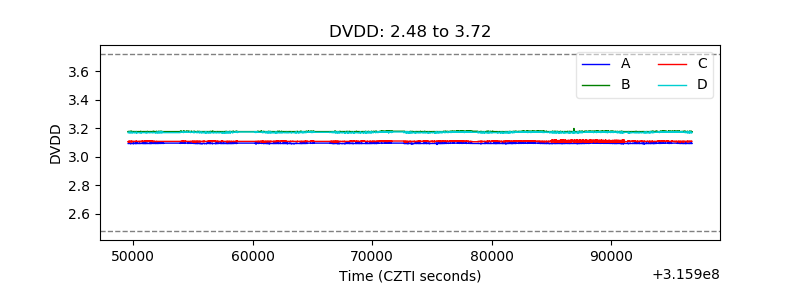 |
| Temperature 1 | 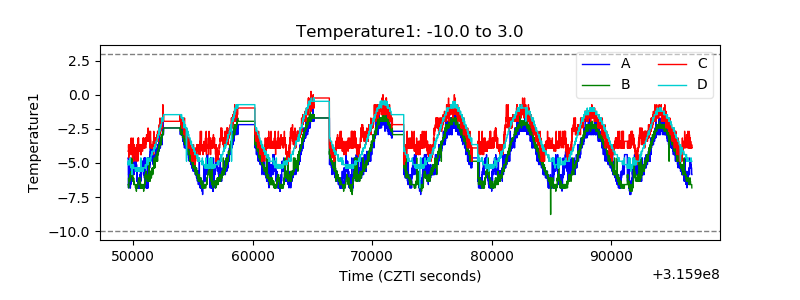 |
| Veto HV Monitor | 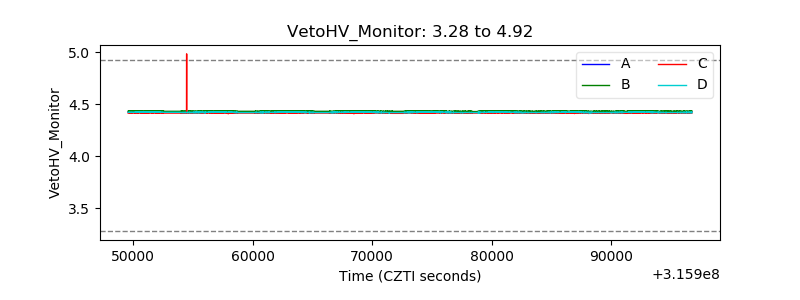 |
| Veto LLD |  |
| Alpha Counter | 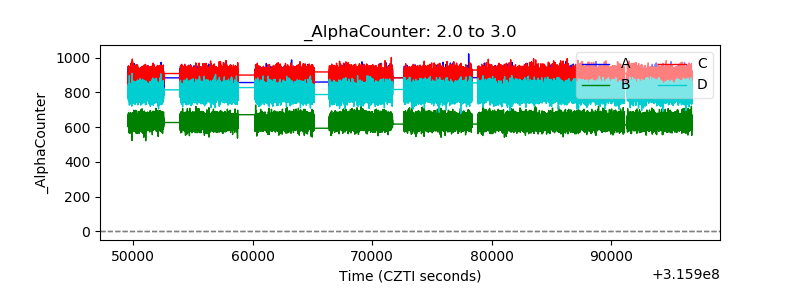 |
| _CPM_Rate | 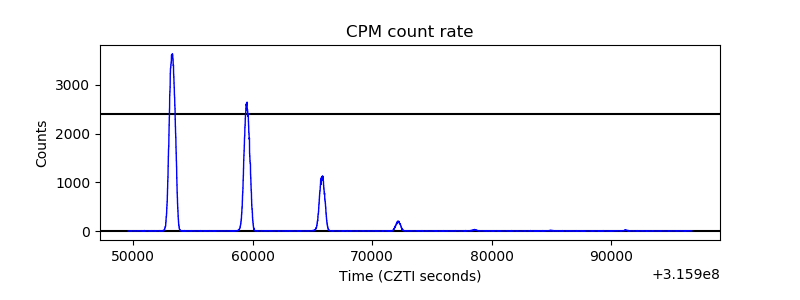 |
| CZT Counter |  |
| +2.5 Volts monitor |  |
| +5 Volts monitor | 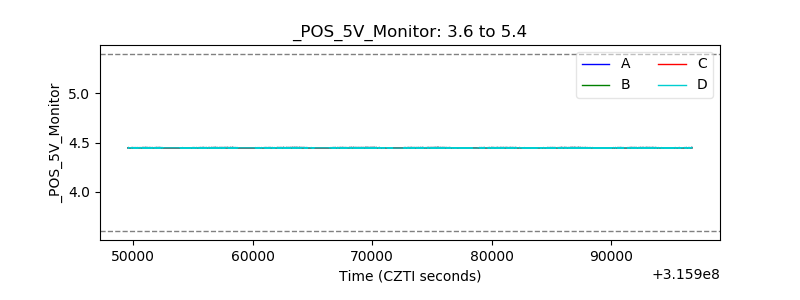 |
| _ROLL_ROT | 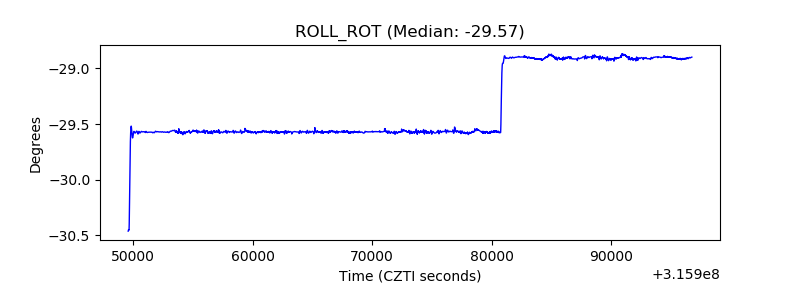 |
| _Roll_DEC |  |
| _Roll_RA | 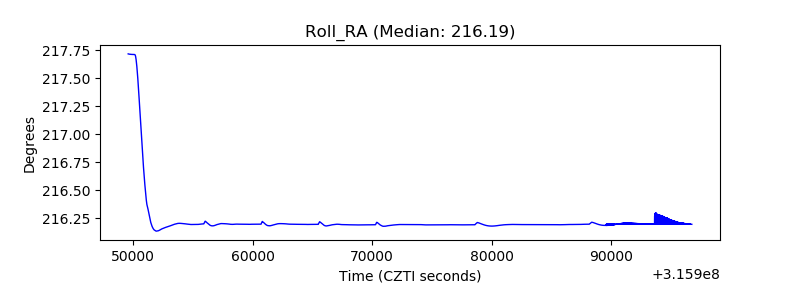 |
| Veto Counter | 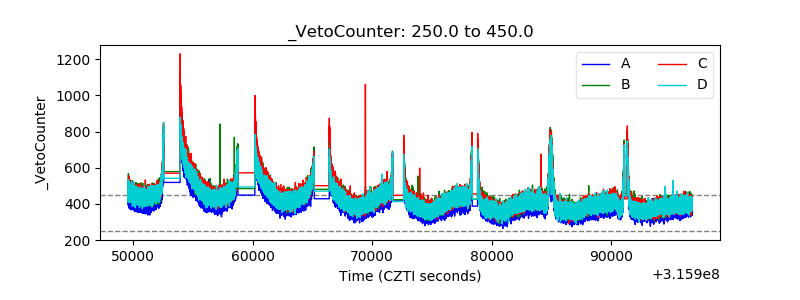 |