| Param | Original file | Final file |
|---|---|---|
| Filename | modeM0/AS1A07_138T05_9000003410_23101cztM0_level2.evt | modeM0/AS1A07_138T05_9000003410_23101cztM0_level2_quad_clean.evt |
| Size (bytes) | 310,988,160 | 66,456,000 |
| Size | 296.6 MB | 63.4 MB |
| Events in quadrant A | 2,336,103 | 428,537 |
| Events in quadrant B | 2,212,254 | 443,625 |
| Events in quadrant C | 2,293,953 | 429,010 |
| Events in quadrant D | 2,293,272 | 418,979 |
| Mode SS | |||
|---|---|---|---|
| Quadrant | BADHDUFLAG | Total packets | Discarded packets |
| A | 0 | 86 | 0 |
| B | 0 | 86 | 0 |
| C | 0 | 86 | 0 |
| D | 0 | 86 | 0 |
| Mode M9 | |||
|---|---|---|---|
| Quadrant | BADHDUFLAG | Total packets | Discarded packets |
| A | 0 | 14 | 0 |
| B | 0 | 14 | 0 |
| C | 0 | 14 | 0 |
| D | 0 | 14 | 0 |
| Mode M0 | |||
|---|---|---|---|
| Quadrant | BADHDUFLAG | Total packets | Discarded packets |
| A | 0 | 9671 | 1 |
| B | 0 | 9287 | 1 |
| C | 0 | 9533 | 1 |
| D | 0 | 9796 | 1 |
| Quadrant | Total seconds | Saturated seconds | Saturation percentage |
|---|---|---|---|
| A | 4142 | 76 | 1.834862% |
| B | 4142 | 65 | 1.569290% |
| C | 4142 | 101 | 2.438436% |
| D | 4142 | 103 | 2.486721% |
Noise dominated data is calculated using 1-second bins in cleaned event files. If a bin has >2000 counts, and if more than 50% of those come from <1% of pixels, then it is considered to be noise-dominated and hence unusable.
| Quadrant | # 1 sec bins | Bins with >0 counts | Bins with >2000 counts | High rate bins dominated by noise | Noise dominated (total time) | Noise dominated (detector-on time) | Marked lightcurve |
|---|---|---|---|---|---|---|---|
| A | 5522 | 4143 | 2 | 2 | 0.04% | 0.05% | 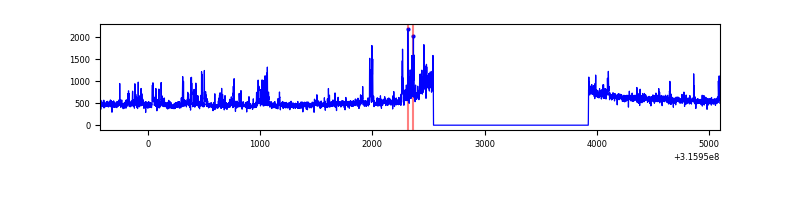 |
| B | 5522 | 4142 | 1 | 1 | 0.02% | 0.02% | 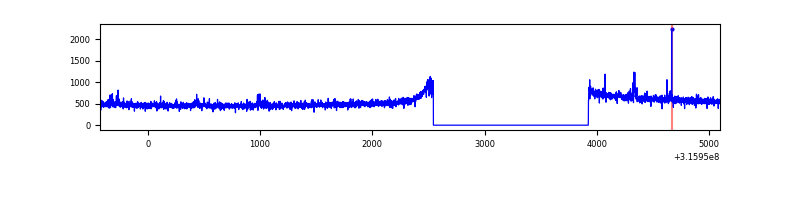 |
| C | 5522 | 4143 | 5 | 5 | 0.09% | 0.12% | 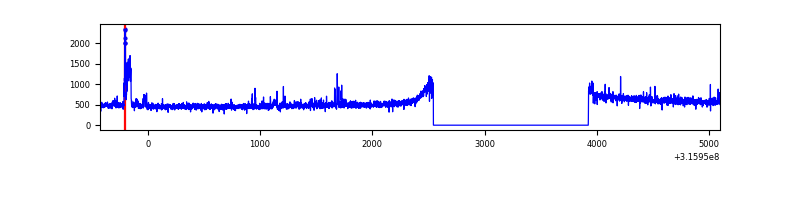 |
| D | 5522 | 4143 | 31 | 31 | 0.56% | 0.75% | 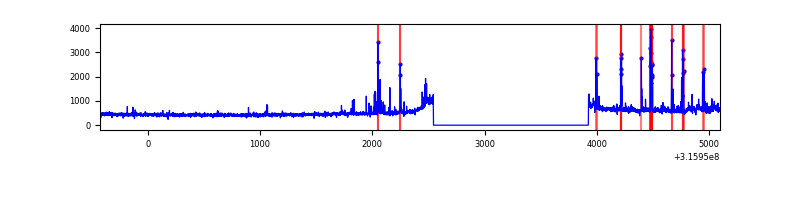 |
Top three noisy pixels from each quadrant. If the there are fewer than three noisy pixels in the level2.evt file, extra rows are filled as -1
| Pixel properties | Quadrant properties | ||||||
|---|---|---|---|---|---|---|---|
| Quadrant | DetID | PixID | Counts | Sigma | Mean | Median | Sigma |
| A | 6 | 16 | 202349 | 1802.31 | 553 | 543 | 112.0 |
| A | 13 | 254 | 5985 | 48.6 | 553 | 543 | 112.0 |
| A | 0 | 226 | 4798 | 38.0 | 553 | 543 | 112.0 |
| B | 0 | 189 | 17456 | 157.47 | 557 | 543 | 107.4 |
| B | 12 | 111 | 12271 | 109.2 | 557 | 543 | 107.4 |
| B | 0 | 190 | 11335 | 100.48 | 557 | 543 | 107.4 |
| C | 0 | 10 | 94054 | 738.94 | 540 | 544 | 126.5 |
| C | 14 | 238 | 85536 | 671.63 | 540 | 544 | 126.5 |
| C | 0 | 207 | 6204 | 44.73 | 540 | 544 | 126.5 |
| D | 12 | 233 | 75515 | 570.22 | 542 | 529 | 131.5 |
| D | 1 | 52 | 47141 | 354.46 | 542 | 529 | 131.5 |
| D | 13 | 153 | 45270 | 340.23 | 542 | 529 | 131.5 |
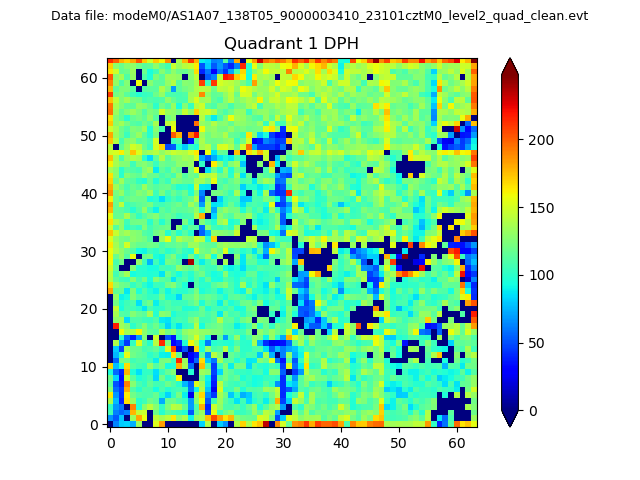
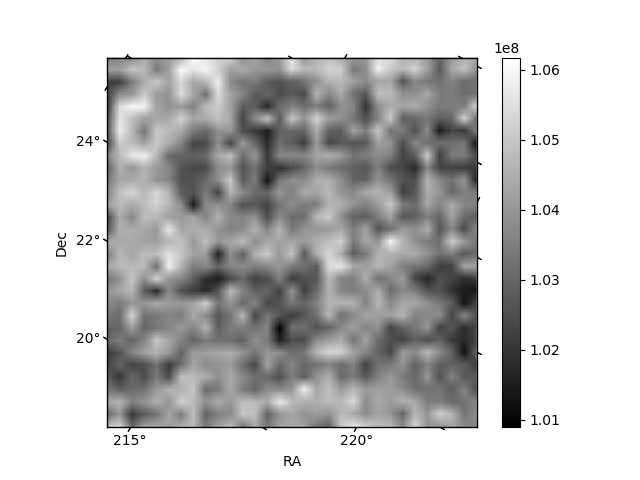
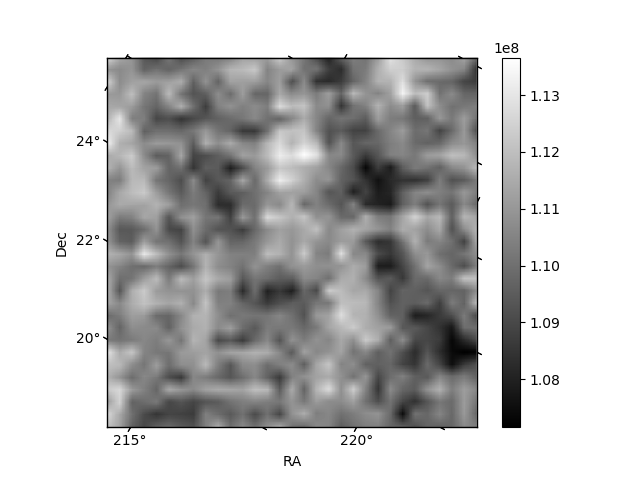
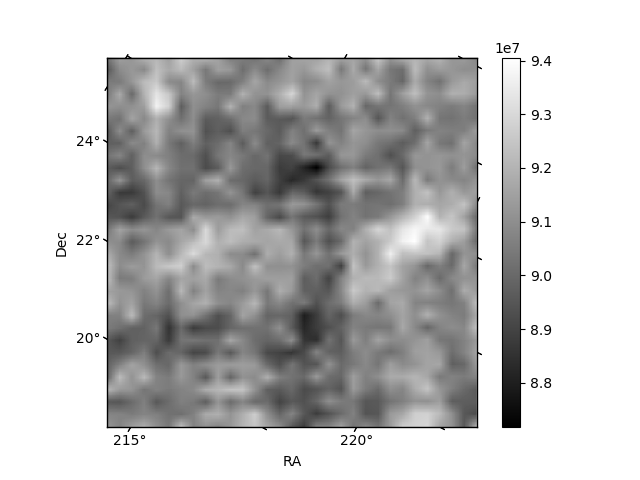
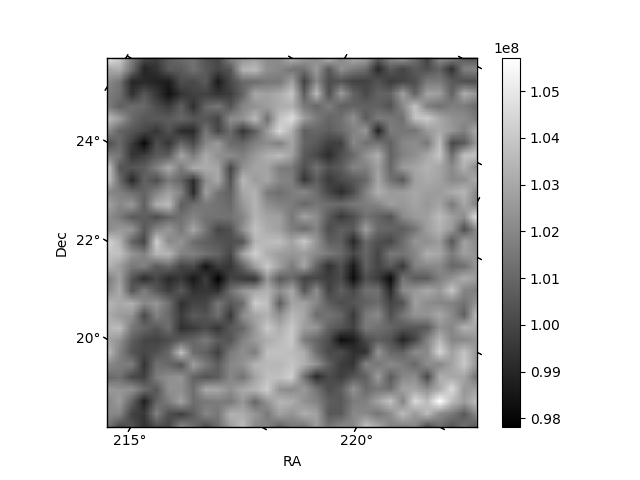
Histogram calculated using DETX and DETY for each event in the final _common_clean file
| Quadrant A |  |
 |
Quadrant B |
|---|---|---|---|
| Quadrant D | 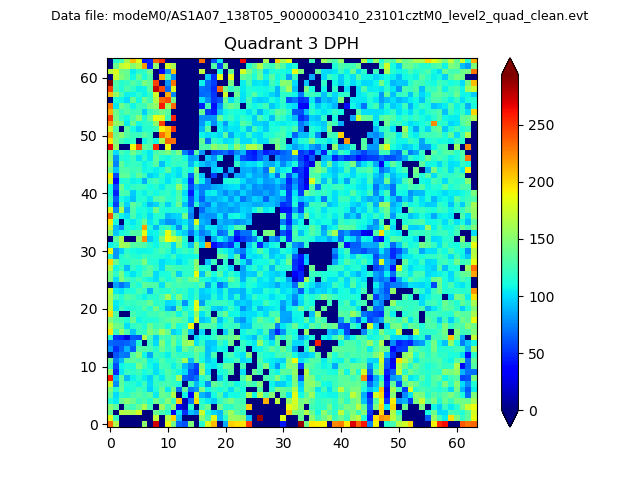 |
 |
Quadrant C |
| Plot type | Count rate plots | Images |
|---|---|---|
| Comparison with Poisson distribution Blue bars denote a histogram of data divided into 1 sec bins. Red curve is a Poisson curve with rate = median count rate of data. |
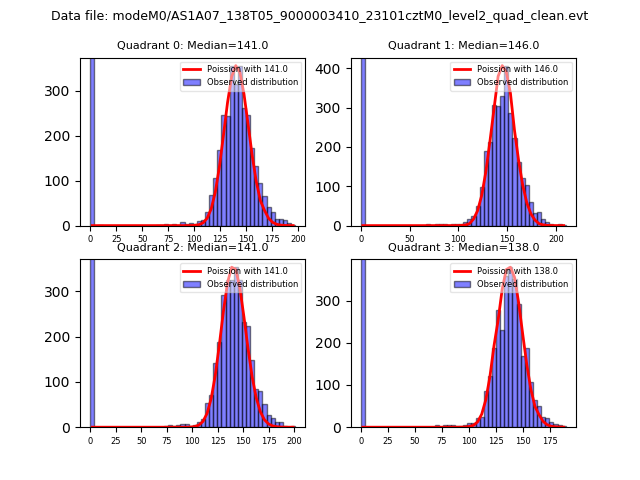 |
 |
| Quadrant-wise count rates Data is divided into 100 sec bins |
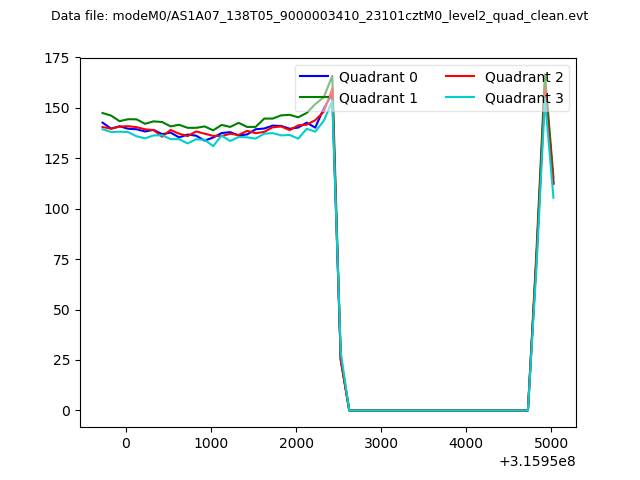 |
|
| Module-wise count rates for Quadrant A Data is divided into 100 sec bins |
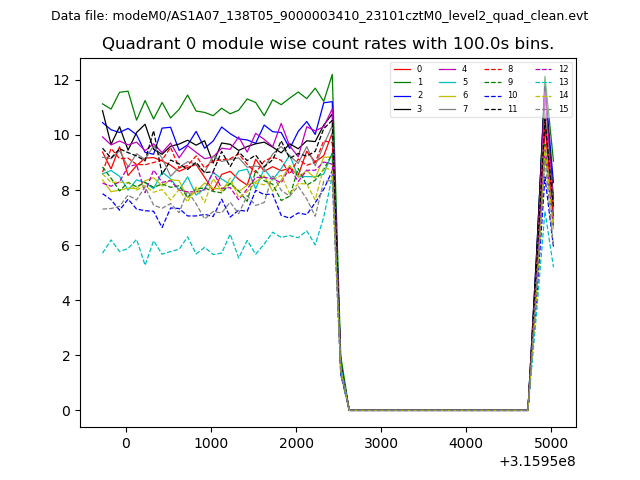 |
 |
| Module-wise count rates for Quadrant B Data is divided into 100 sec bins |
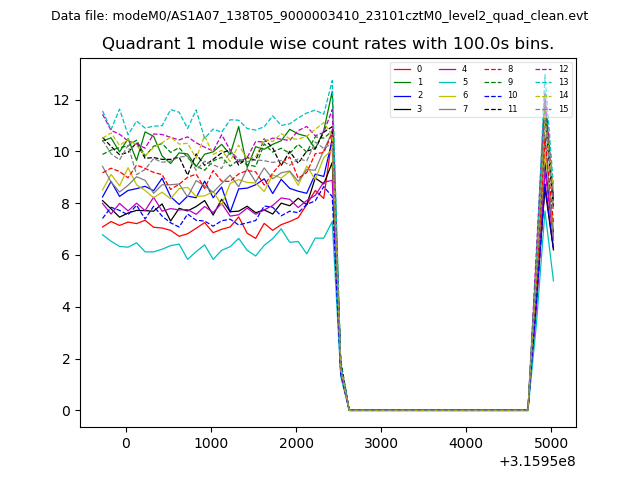 |
 |
| Module-wise count rates for Quadrant C Data is divided into 100 sec bins |
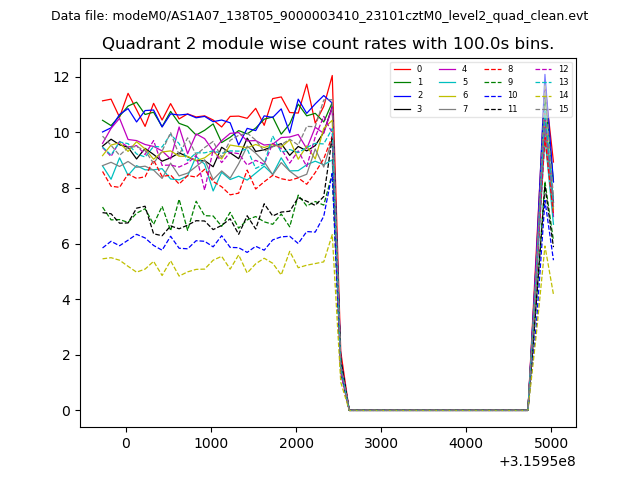 |
 |
| Module-wise count rates for Quadrant D Data is divided into 100 sec bins |
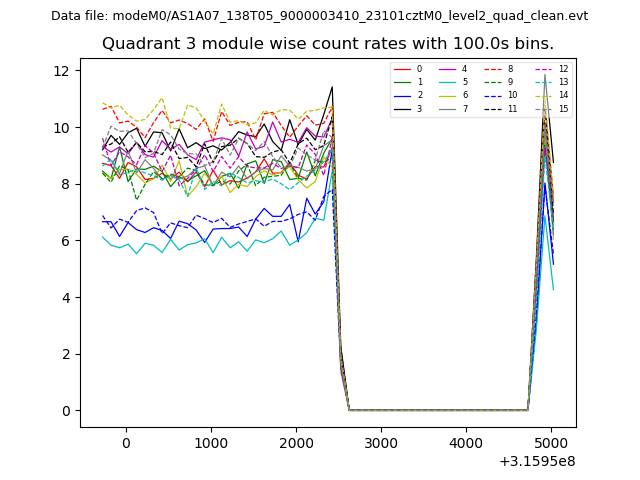 |
 |
| Parameter | Plot |
|---|---|
| CZT HV Monitor | 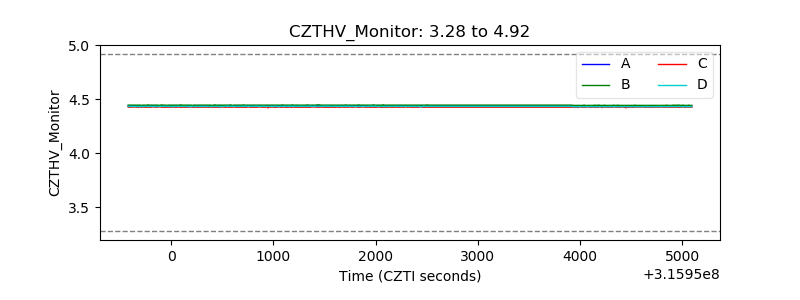 |
| D_VDD | 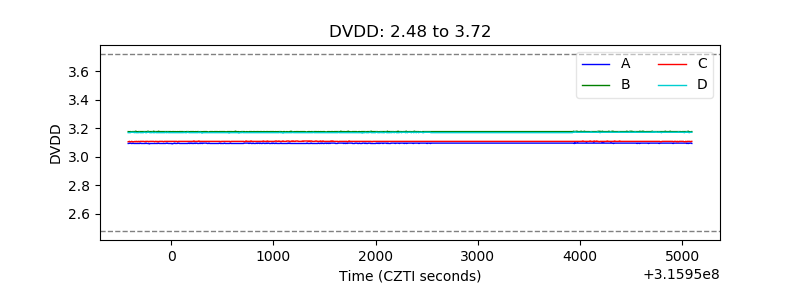 |
| Temperature 1 | 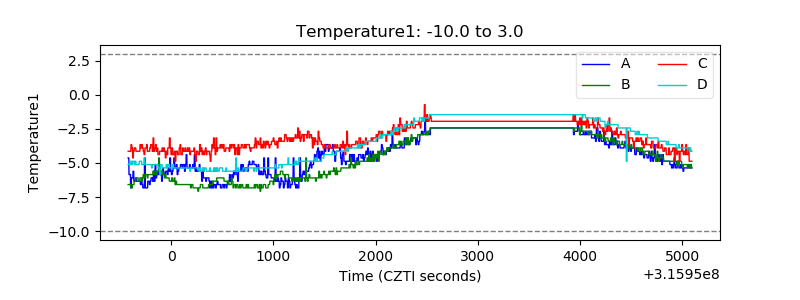 |
| Veto HV Monitor | 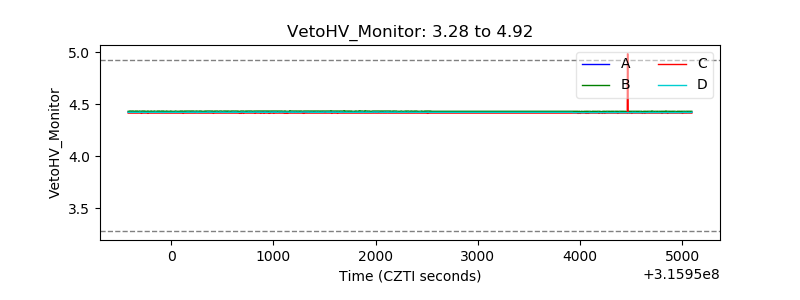 |
| Veto LLD | 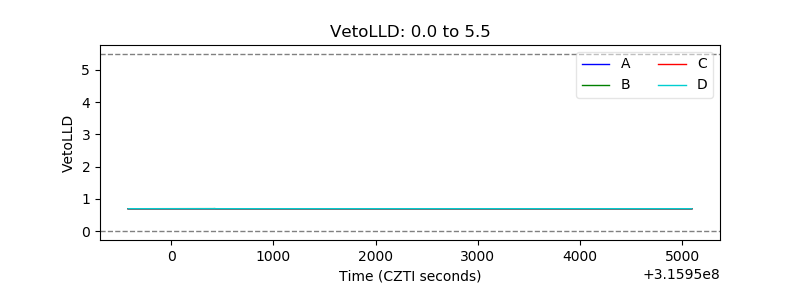 |
| Alpha Counter | 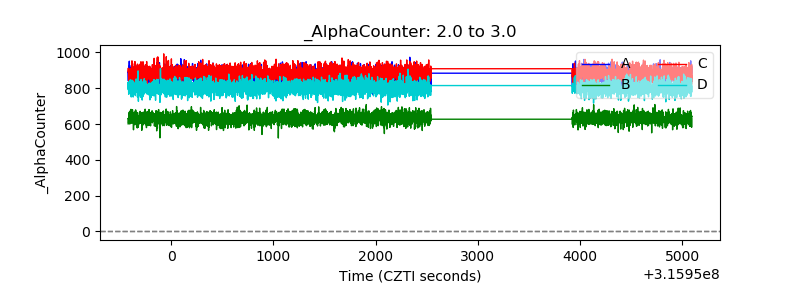 |
| _CPM_Rate | 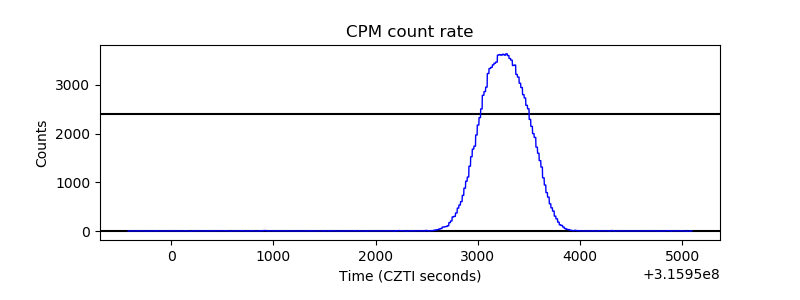 |
| CZT Counter |  |
| +2.5 Volts monitor |  |
| +5 Volts monitor | 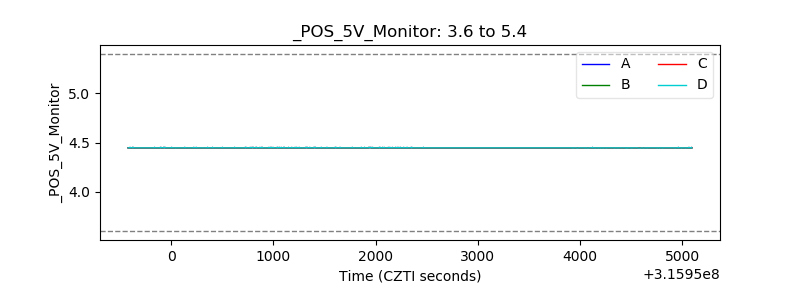 |
| _ROLL_ROT | 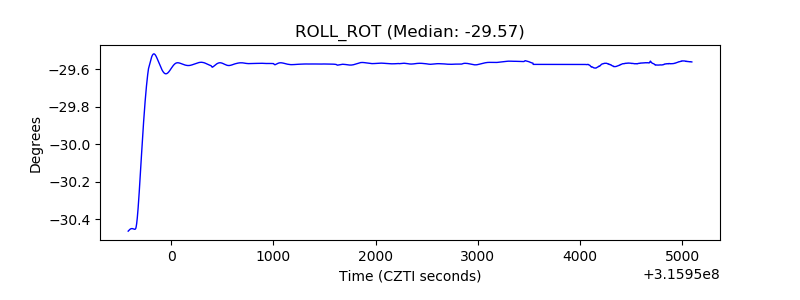 |
| _Roll_DEC | 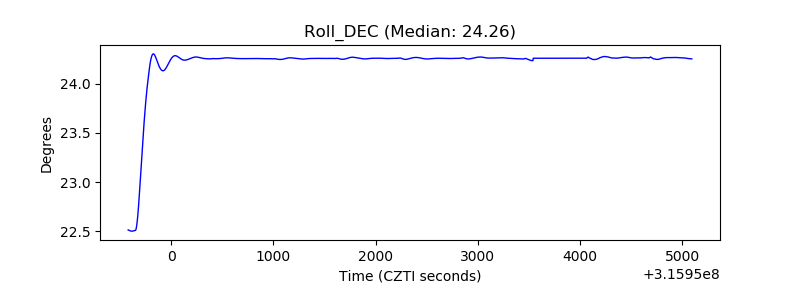 |
| _Roll_RA |  |
| Veto Counter | 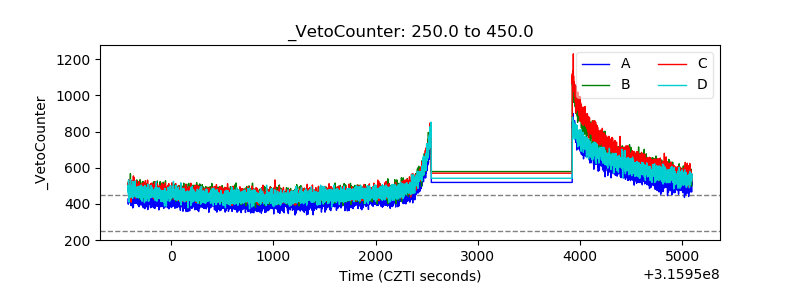 |