| Param | Original file | Final file |
|---|---|---|
| Filename | modeM0/AS1A07_138T05_9000003410_23102cztM0_level2.evt | modeM0/AS1A07_138T05_9000003410_23102cztM0_level2_quad_clean.evt |
| Size (bytes) | 488,784,960 | 97,862,400 |
| Size | 466.1 MB | 93.3 MB |
| Events in quadrant A | 3,431,776 | 635,833 |
| Events in quadrant B | 3,443,764 | 655,301 |
| Events in quadrant C | 3,798,302 | 629,908 |
| Events in quadrant D | 3,710,836 | 612,540 |
| Mode SS | |||
|---|---|---|---|
| Quadrant | BADHDUFLAG | Total packets | Discarded packets |
| A | 0 | 126 | 0 |
| B | 0 | 126 | 0 |
| C | 0 | 126 | 0 |
| D | 0 | 126 | 0 |
| Mode M9 | |||
|---|---|---|---|
| Quadrant | BADHDUFLAG | Total packets | Discarded packets |
| A | 0 | 28 | 0 |
| B | 0 | 28 | 0 |
| C | 0 | 28 | 0 |
| D | 0 | 28 | 0 |
| Mode M0 | |||
|---|---|---|---|
| Quadrant | BADHDUFLAG | Total packets | Discarded packets |
| A | 0 | 14258 | 2 |
| B | 0 | 14217 | 2 |
| C | 0 | 15396 | 2 |
| D | 0 | 15358 | 2 |
| Quadrant | Total seconds | Saturated seconds | Saturation percentage |
|---|---|---|---|
| A | 6167 | 110 | 1.783687% |
| B | 6168 | 135 | 2.188716% |
| C | 6168 | 281 | 4.555772% |
| D | 6168 | 154 | 2.496757% |
Noise dominated data is calculated using 1-second bins in cleaned event files. If a bin has >2000 counts, and if more than 50% of those come from <1% of pixels, then it is considered to be noise-dominated and hence unusable.
| Quadrant | # 1 sec bins | Bins with >0 counts | Bins with >2000 counts | High rate bins dominated by noise | Noise dominated (total time) | Noise dominated (detector-on time) | Marked lightcurve |
|---|---|---|---|---|---|---|---|
| A | 8967 | 6169 | 1 | 1 | 0.01% | 0.02% | 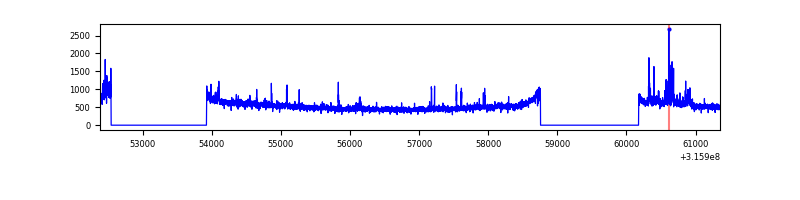 |
| B | 8968 | 6169 | 18 | 18 | 0.20% | 0.29% | 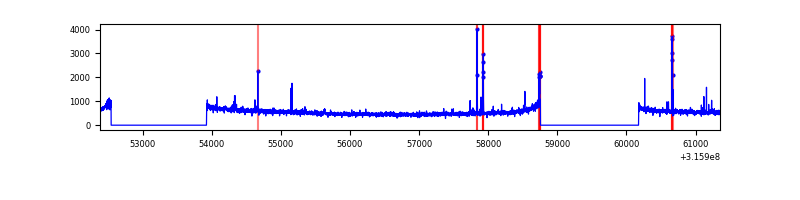 |
| C | 8968 | 6170 | 80 | 80 | 0.89% | 1.30% | 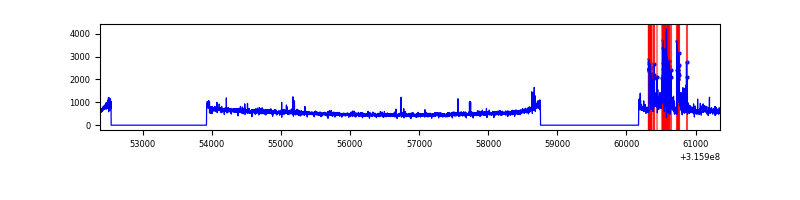 |
| D | 8968 | 6169 | 52 | 52 | 0.58% | 0.84% | 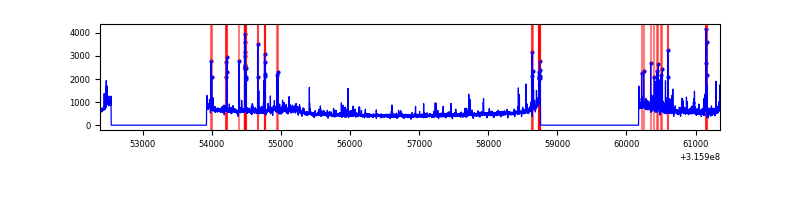 |
Top three noisy pixels from each quadrant. If the there are fewer than three noisy pixels in the level2.evt file, extra rows are filled as -1
| Pixel properties | Quadrant properties | ||||||
|---|---|---|---|---|---|---|---|
| Quadrant | DetID | PixID | Counts | Sigma | Mean | Median | Sigma |
| A | 6 | 16 | 177815 | 1049.85 | 844 | 828 | 168.6 |
| A | 13 | 254 | 9586 | 51.95 | 844 | 828 | 168.6 |
| A | 0 | 226 | 7365 | 38.78 | 844 | 828 | 168.6 |
| B | 0 | 189 | 61355 | 381.86 | 848 | 830 | 158.5 |
| B | 5 | 255 | 19883 | 120.21 | 848 | 830 | 158.5 |
| B | 12 | 111 | 18842 | 113.64 | 848 | 830 | 158.5 |
| C | 0 | 10 | 386444 | 2019.5 | 818 | 825 | 190.9 |
| C | 14 | 238 | 129596 | 674.38 | 818 | 825 | 190.9 |
| C | 0 | 207 | 90499 | 469.63 | 818 | 825 | 190.9 |
| D | 12 | 233 | 182448 | 903.78 | 823 | 801 | 201.0 |
| D | 1 | 52 | 92707 | 457.28 | 823 | 801 | 201.0 |
| D | 12 | 227 | 82739 | 407.68 | 823 | 801 | 201.0 |
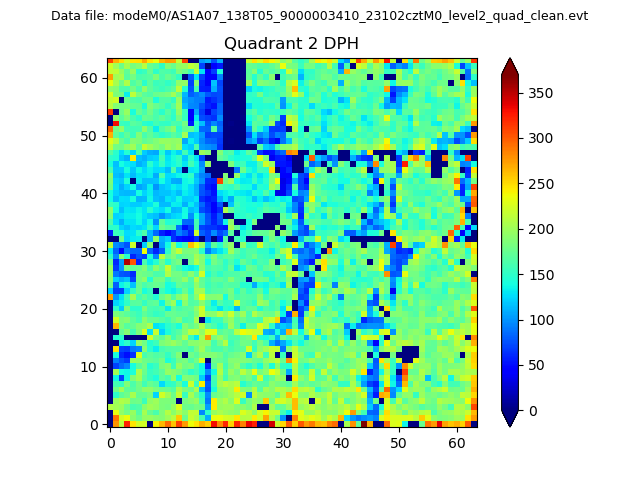
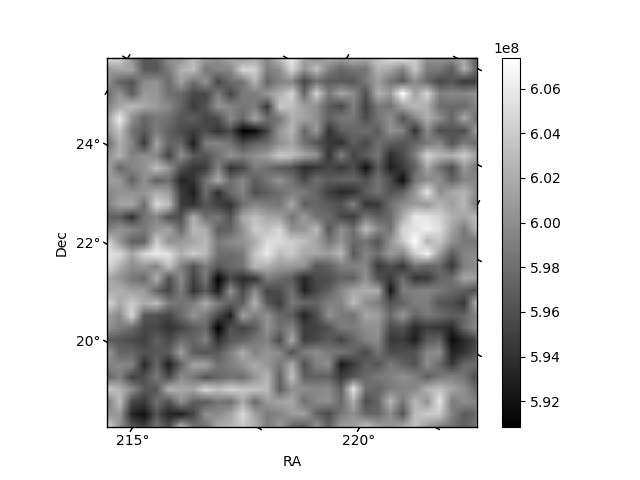
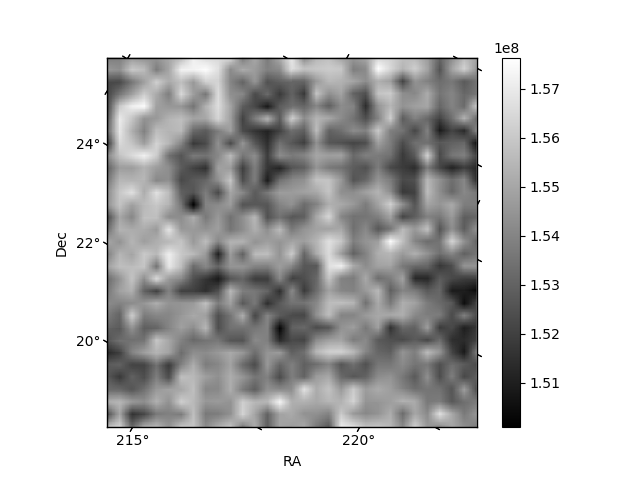
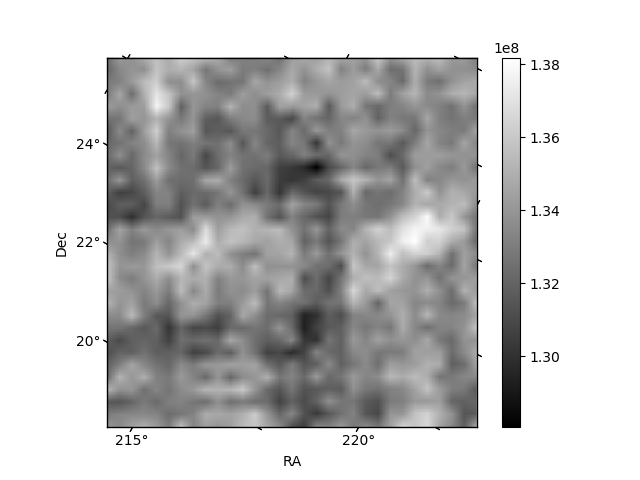
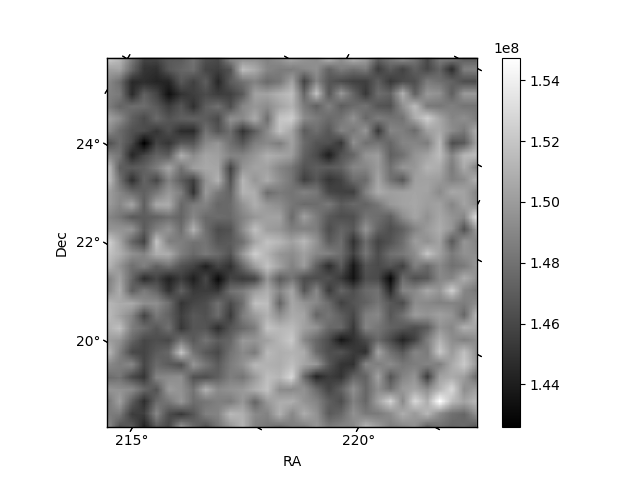
Histogram calculated using DETX and DETY for each event in the final _common_clean file
| Quadrant A | 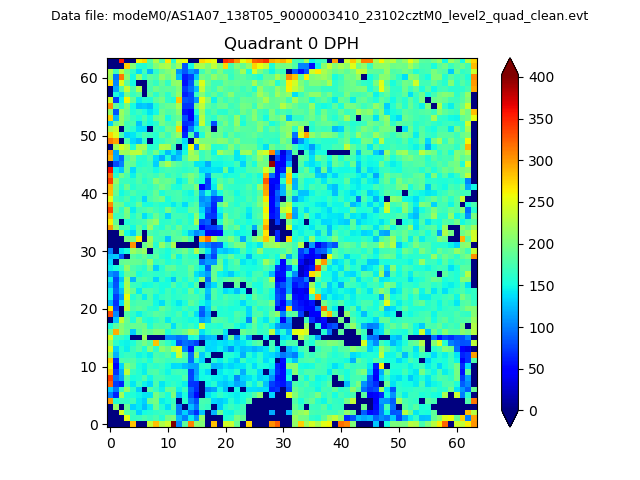 |
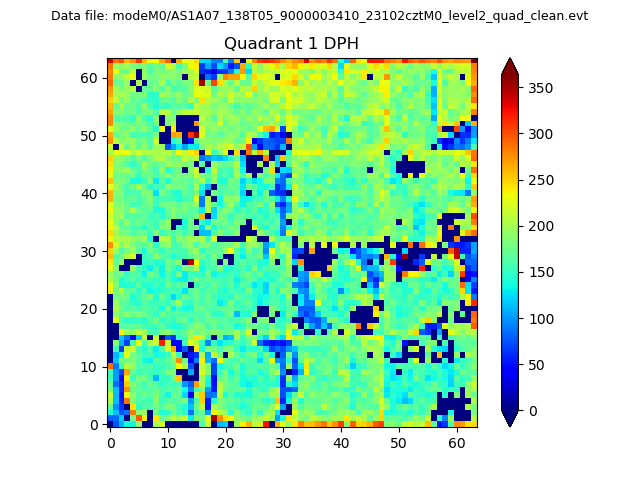 |
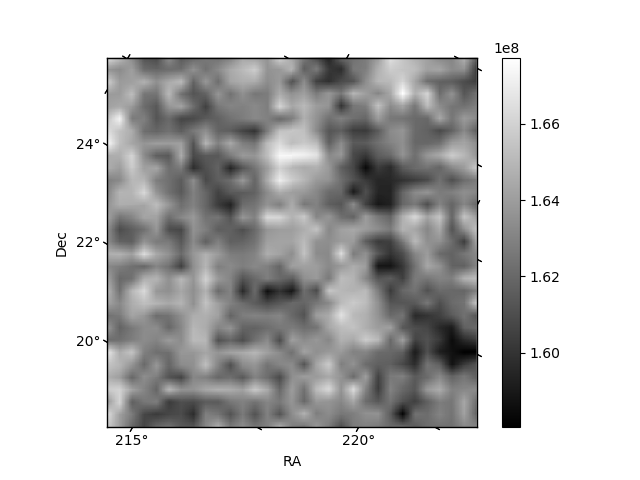
Quadrant B |
|---|---|---|---|
| Quadrant D | 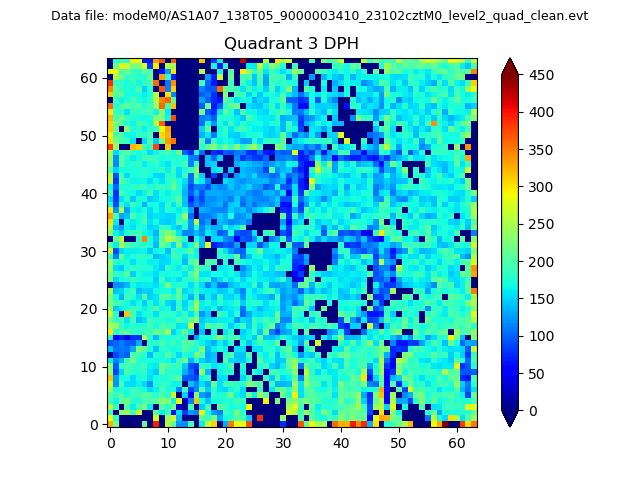 |
 |
Quadrant C |
| Plot type | Count rate plots | Images |
|---|---|---|
| Comparison with Poisson distribution Blue bars denote a histogram of data divided into 1 sec bins. Red curve is a Poisson curve with rate = median count rate of data. |
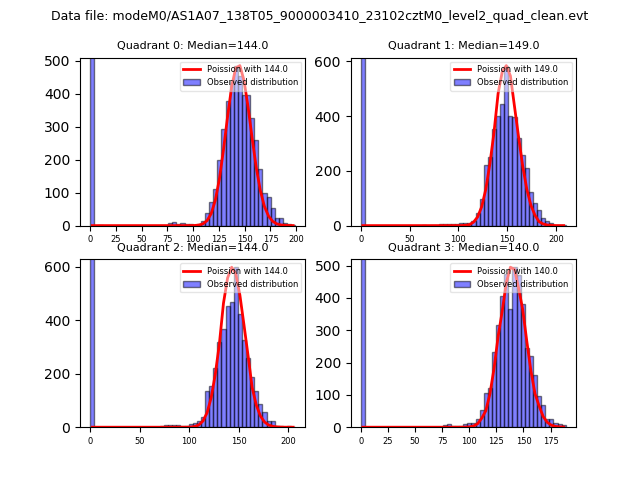 |
 |
| Quadrant-wise count rates Data is divided into 100 sec bins |
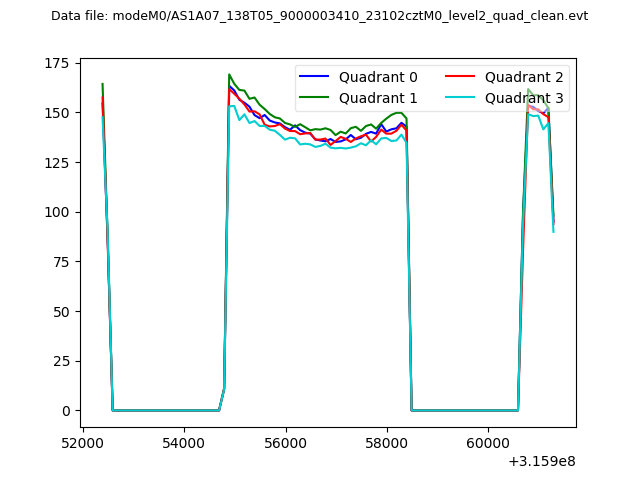 |
|
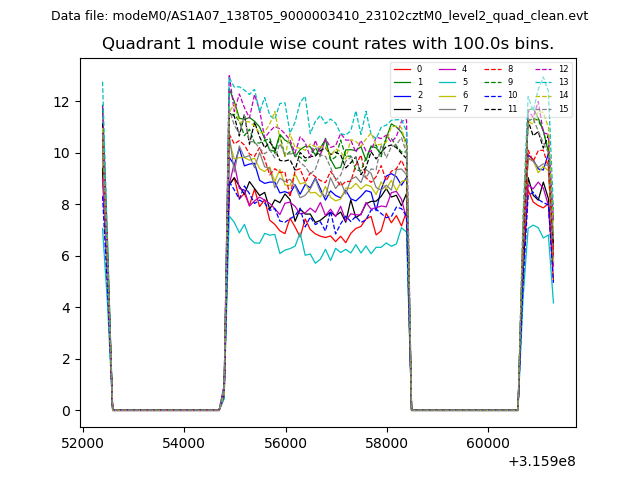
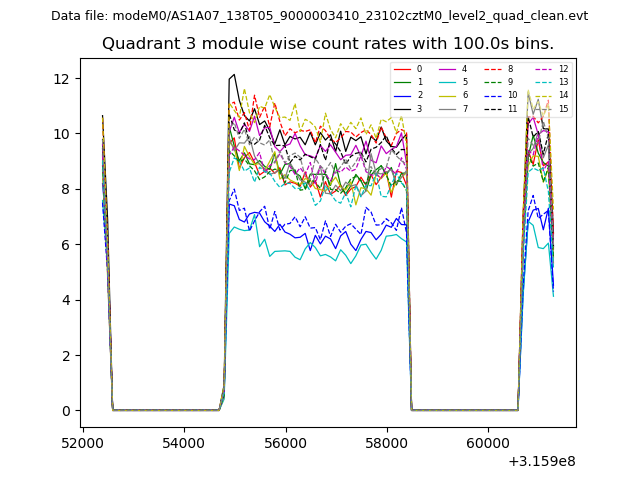
| Module-wise count rates for Quadrant A Data is divided into 100 sec bins |
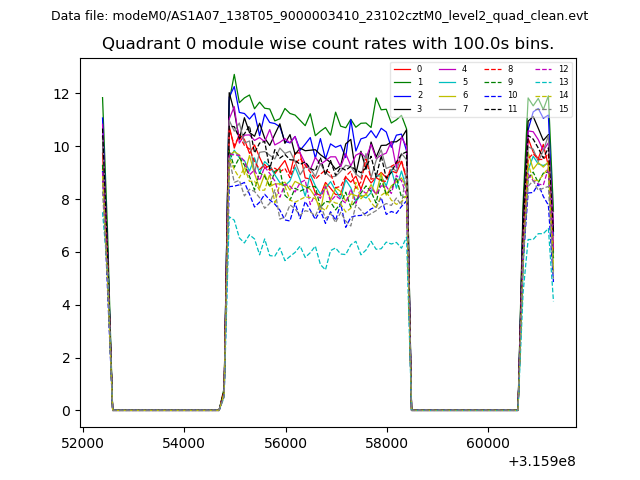 |
 |
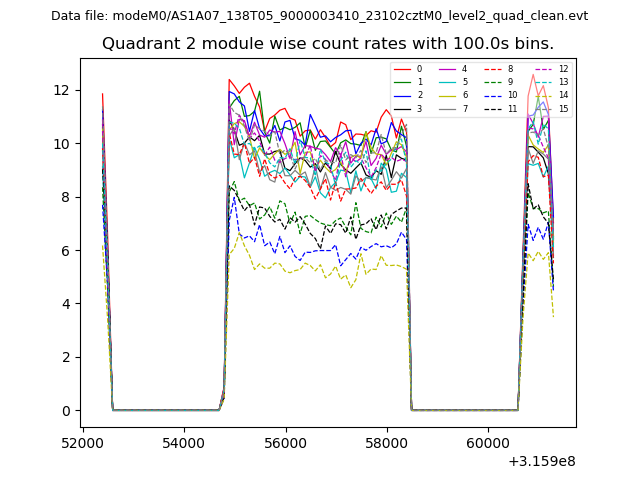
| Module-wise count rates for Quadrant B Data is divided into 100 sec bins |
 |
 |
| Module-wise count rates for Quadrant C Data is divided into 100 sec bins |
 |
 |
| Module-wise count rates for Quadrant D Data is divided into 100 sec bins |
 |
 |
| Parameter | Plot |
|---|---|
| CZT HV Monitor | 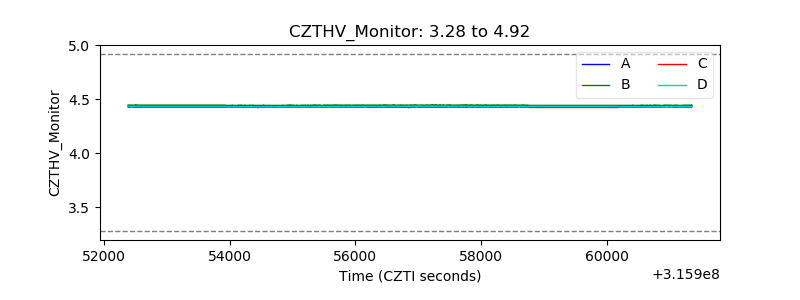 |
| D_VDD | 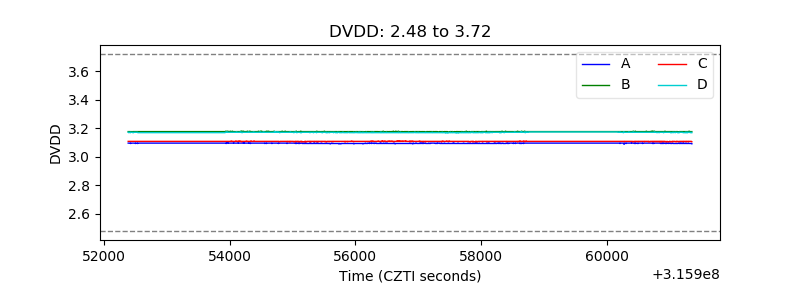 |
| Temperature 1 | 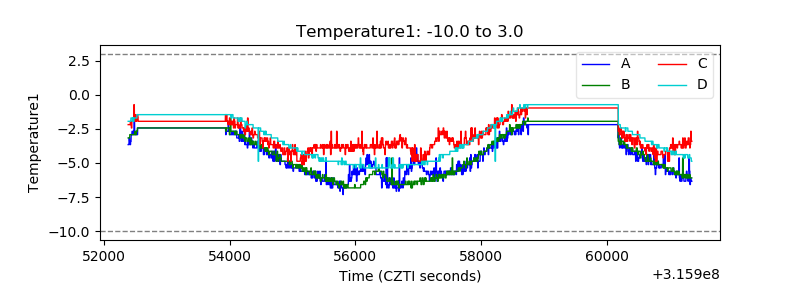 |
| Veto HV Monitor | 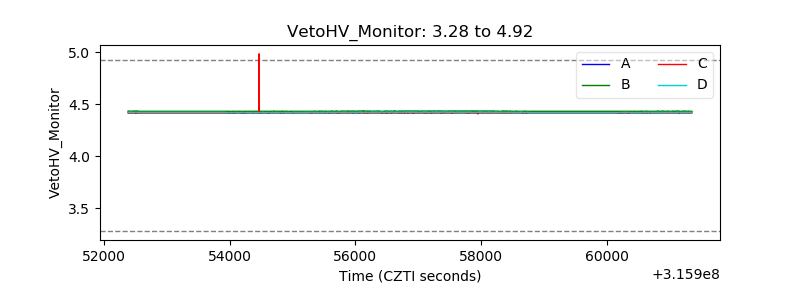 |
| Veto LLD | 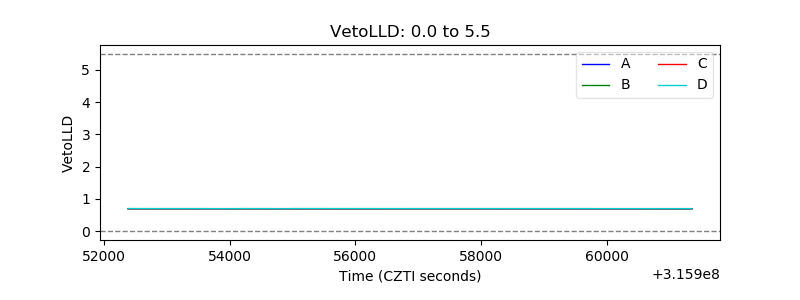 |
| Alpha Counter | 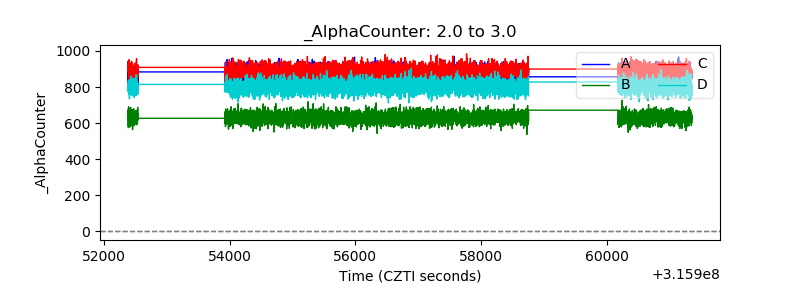 |
| _CPM_Rate | 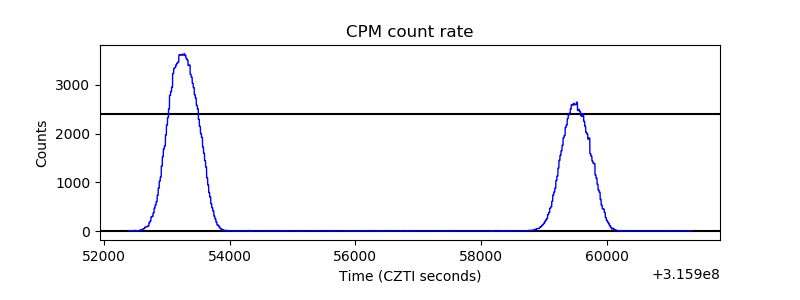 |
| CZT Counter | 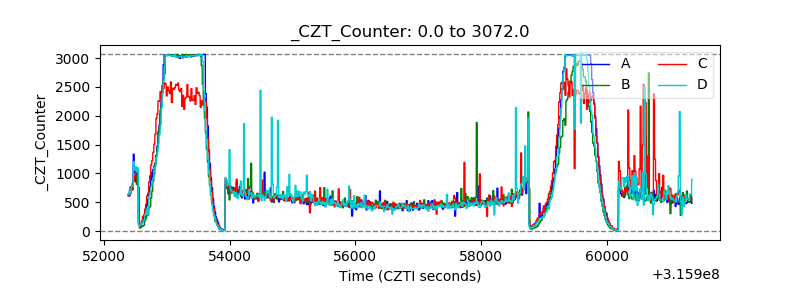 |
| +2.5 Volts monitor | 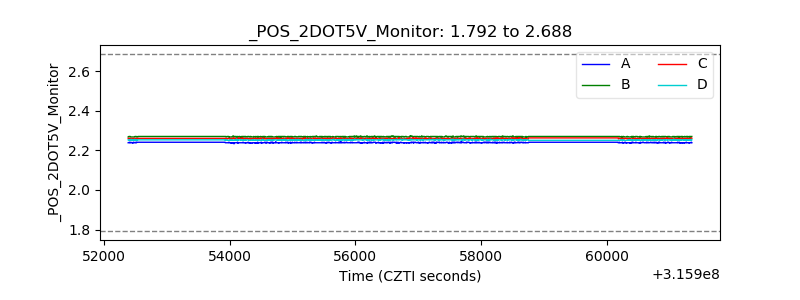 |
| +5 Volts monitor |  |
| _ROLL_ROT | 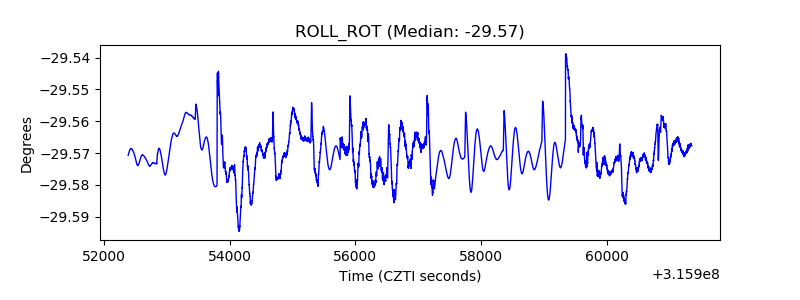 |
| _Roll_DEC | 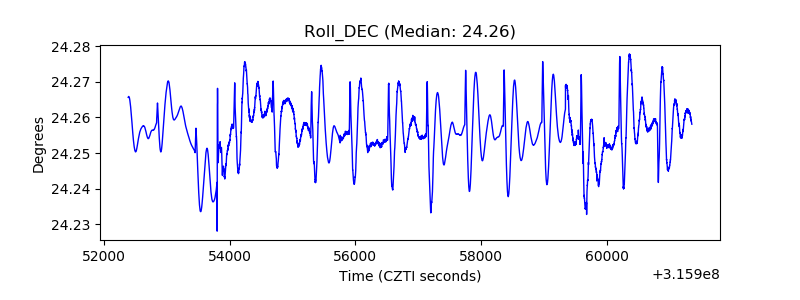 |
| _Roll_RA | 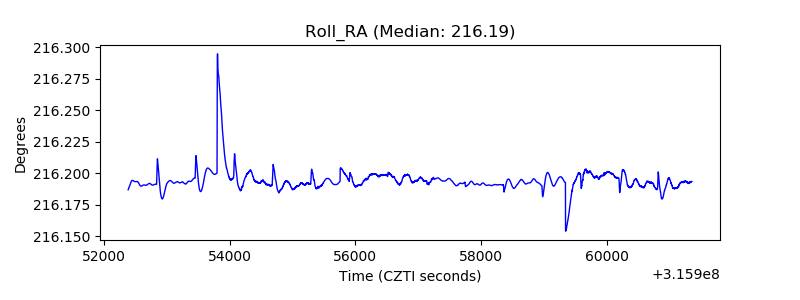 |
| Veto Counter | 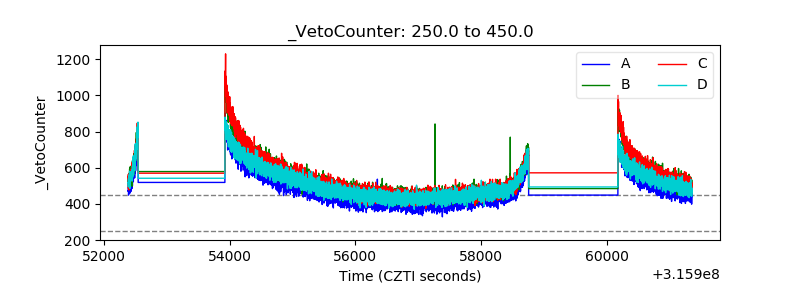 |