| Param | Original file | Final file |
|---|---|---|
| Filename | modeM0/AS1A07_138T05_9000003410_23103cztM0_level2.evt | modeM0/AS1A07_138T05_9000003410_23103cztM0_level2_quad_clean.evt |
| Size (bytes) | 530,951,040 | 101,260,800 |
| Size | 506.4 MB | 96.6 MB |
| Events in quadrant A | 4,339,312 | 653,398 |
| Events in quadrant B | 3,382,744 | 683,751 |
| Events in quadrant C | 3,847,660 | 655,440 |
| Events in quadrant D | 4,082,919 | 634,263 |
| Mode SS | |||
|---|---|---|---|
| Quadrant | BADHDUFLAG | Total packets | Discarded packets |
| A | 0 | 128 | 0 |
| B | 0 | 128 | 0 |
| C | 0 | 128 | 0 |
| D | 0 | 128 | 0 |
| Mode M9 | |||
|---|---|---|---|
| Quadrant | BADHDUFLAG | Total packets | Discarded packets |
| A | 0 | 15 | 0 |
| B | 0 | 16 | 0 |
| C | 0 | 16 | 0 |
| D | 0 | 16 | 0 |
| Mode M0 | |||
|---|---|---|---|
| Quadrant | BADHDUFLAG | Total packets | Discarded packets |
| A | 0 | 17249 | 2 |
| B | 0 | 14070 | 2 |
| C | 0 | 15614 | 2 |
| D | 0 | 16345 | 3 |
| Quadrant | Total seconds | Saturated seconds | Saturation percentage |
|---|---|---|---|
| A | 6304 | 148 | 2.347716% |
| B | 6304 | 112 | 1.776650% |
| C | 6304 | 233 | 3.696066% |
| D | 6303 | 147 | 2.332223% |
Noise dominated data is calculated using 1-second bins in cleaned event files. If a bin has >2000 counts, and if more than 50% of those come from <1% of pixels, then it is considered to be noise-dominated and hence unusable.
| Quadrant | # 1 sec bins | Bins with >0 counts | Bins with >2000 counts | High rate bins dominated by noise | Noise dominated (total time) | Noise dominated (detector-on time) | Marked lightcurve |
|---|---|---|---|---|---|---|---|
| A | 7569 | 6305 | 55 | 55 | 0.73% | 0.87% | 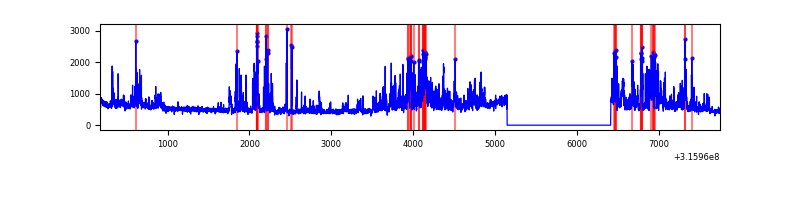 |
| B | 7569 | 6305 | 26 | 26 | 0.34% | 0.41% | 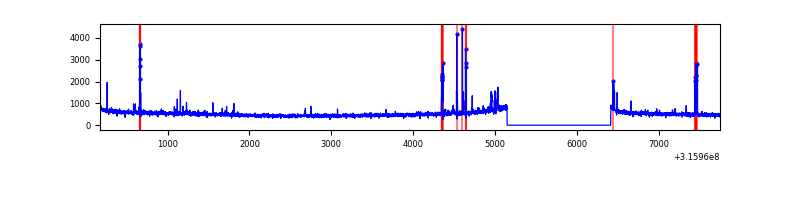 |
| C | 7569 | 6305 | 85 | 85 | 1.12% | 1.35% | 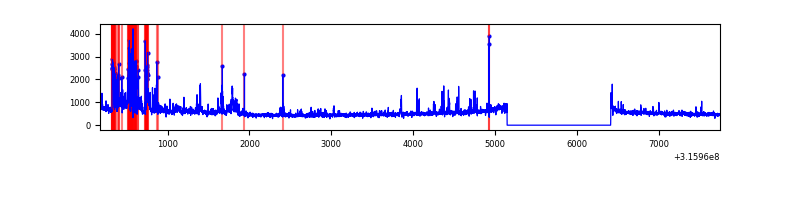 |
| D | 7568 | 6304 | 70 | 70 | 0.92% | 1.11% | 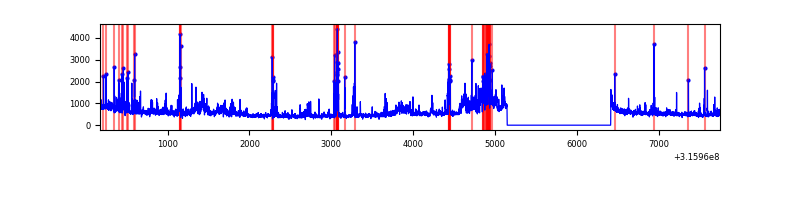 |
Top three noisy pixels from each quadrant. If the there are fewer than three noisy pixels in the level2.evt file, extra rows are filled as -1
| Pixel properties | Quadrant properties | ||||||
|---|---|---|---|---|---|---|---|
| Quadrant | DetID | PixID | Counts | Sigma | Mean | Median | Sigma |
| A | 6 | 16 | 1227549 | 7547.69 | 808 | 792 | 162.5 |
| A | 13 | 254 | 9364 | 52.74 | 808 | 792 | 162.5 |
| A | 0 | 226 | 7042 | 38.45 | 808 | 792 | 162.5 |
| B | 14 | 207 | 70147 | 453.43 | 814 | 794 | 153.0 |
| B | 4 | 216 | 37980 | 243.12 | 814 | 794 | 153.0 |
| B | 0 | 190 | 28124 | 178.68 | 814 | 794 | 153.0 |
| C | 0 | 10 | 501804 | 2749.52 | 783 | 791 | 182.2 |
| C | 0 | 207 | 167095 | 912.66 | 783 | 791 | 182.2 |
| C | 14 | 238 | 123070 | 671.06 | 783 | 791 | 182.2 |
| D | 1 | 52 | 216714 | 1123.8 | 786 | 763 | 192.2 |
| D | 13 | 153 | 208396 | 1080.51 | 786 | 763 | 192.2 |
| D | 7 | 238 | 198187 | 1027.38 | 786 | 763 | 192.2 |
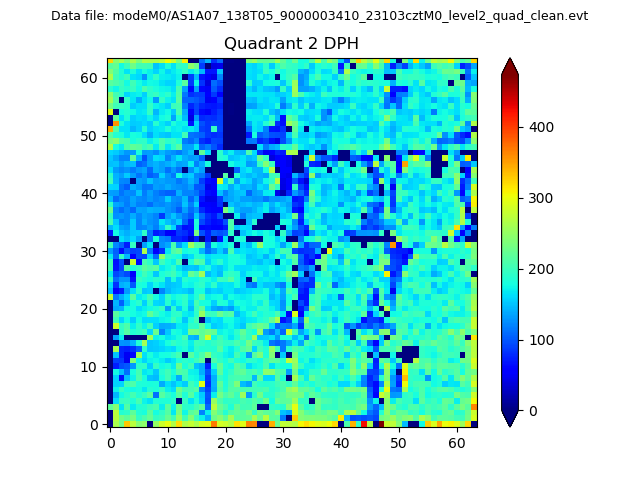
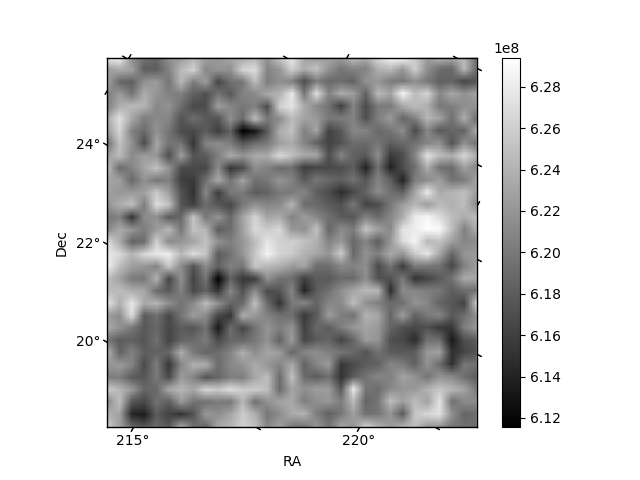
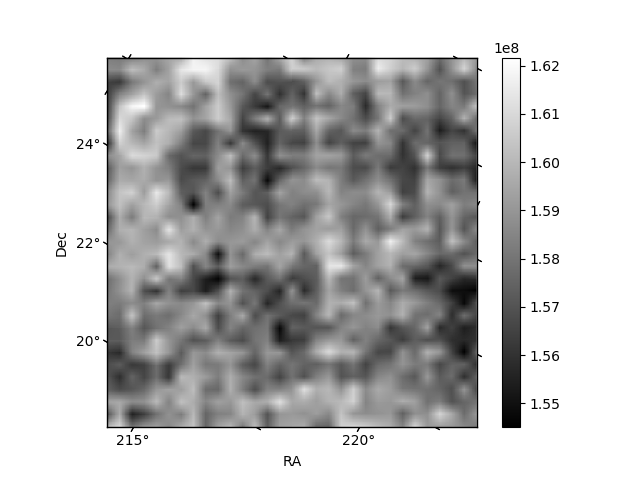
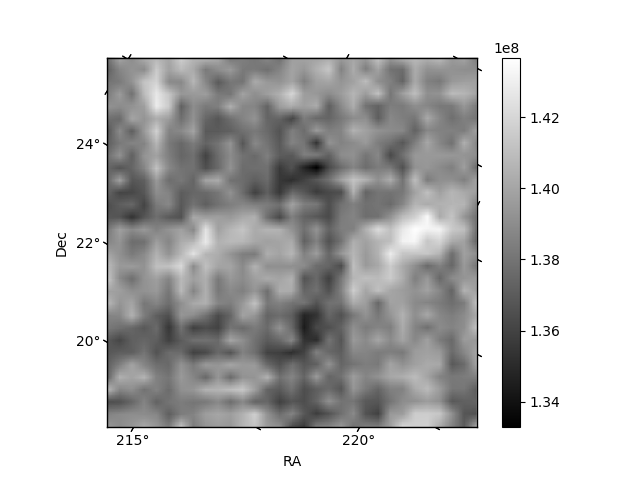
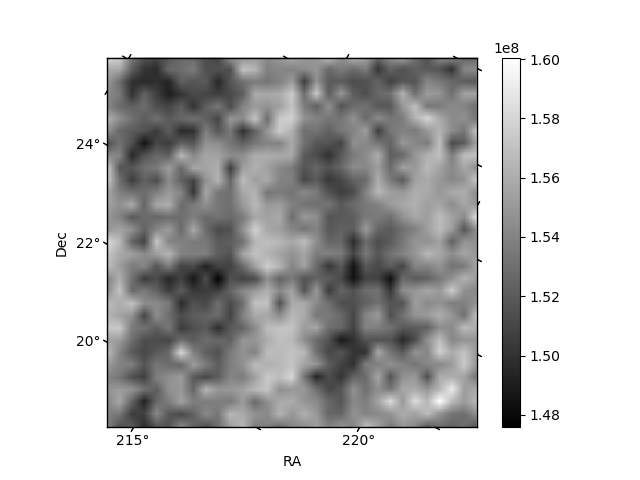
Histogram calculated using DETX and DETY for each event in the final _common_clean file
| Quadrant A | 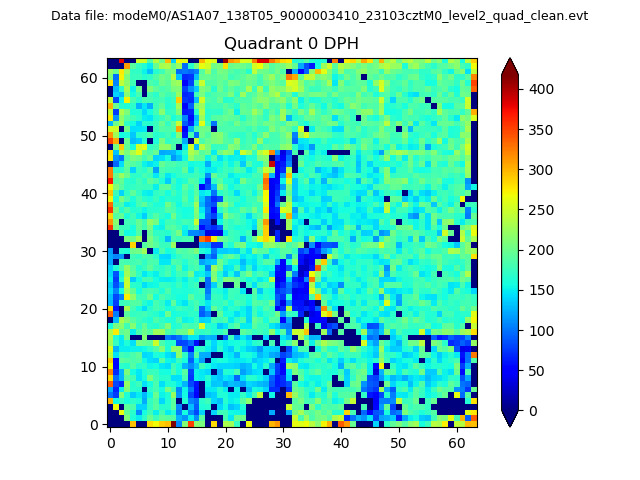 |
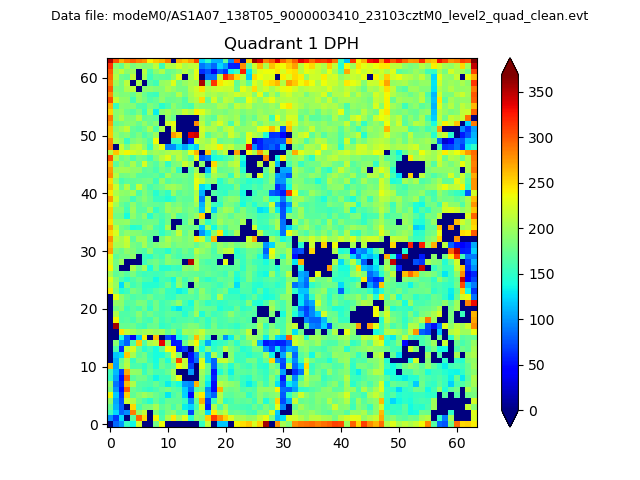 |
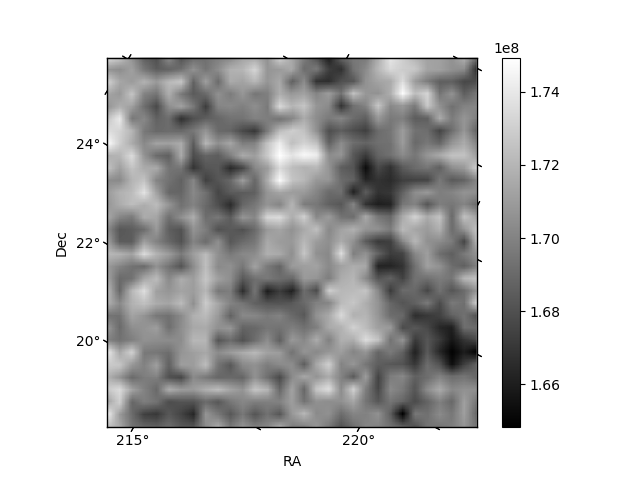
Quadrant B |
|---|---|---|---|
| Quadrant D | 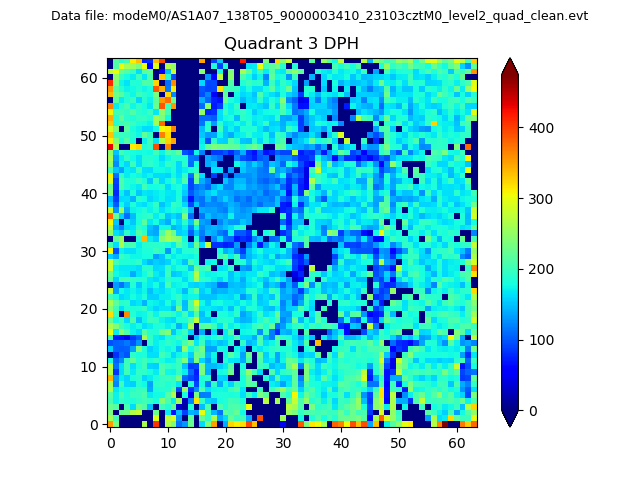 |
 |
Quadrant C |
| Plot type | Count rate plots | Images |
|---|---|---|
| Comparison with Poisson distribution Blue bars denote a histogram of data divided into 1 sec bins. Red curve is a Poisson curve with rate = median count rate of data. |
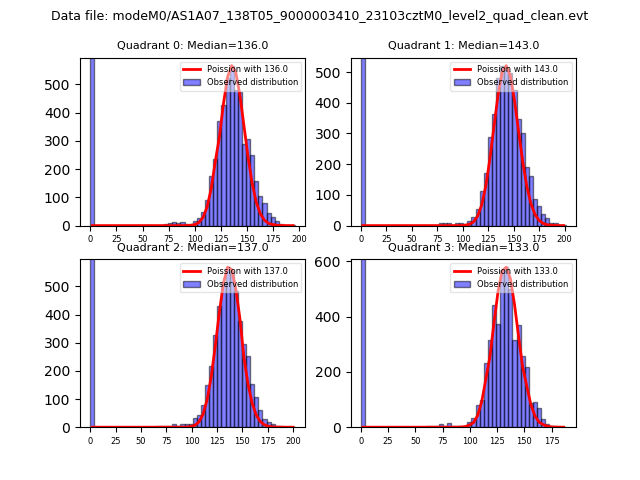 |
 |
| Quadrant-wise count rates Data is divided into 100 sec bins |
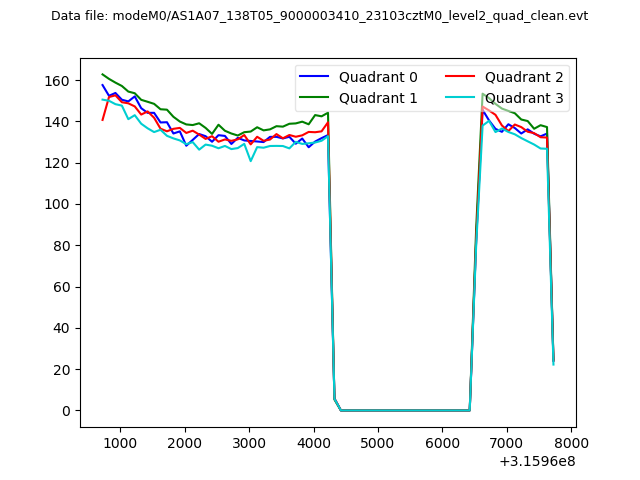 |
|
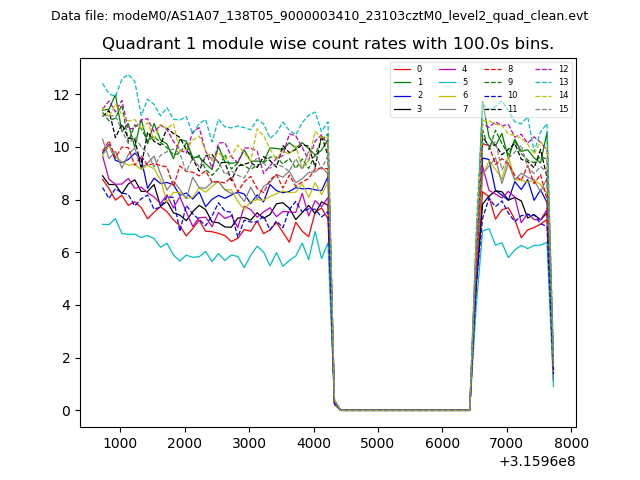
| Module-wise count rates for Quadrant A Data is divided into 100 sec bins |
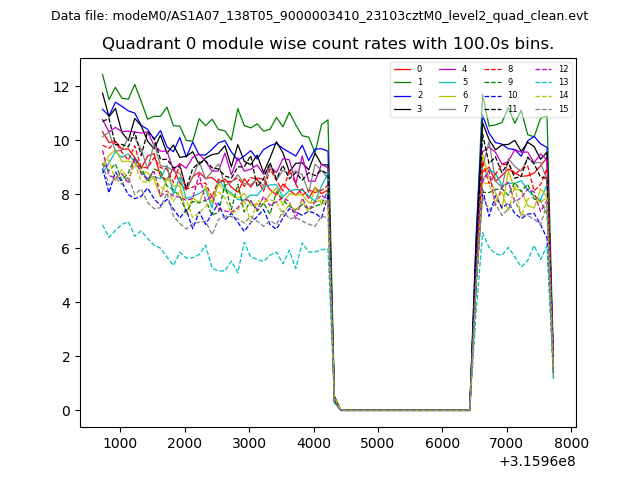 |
 |
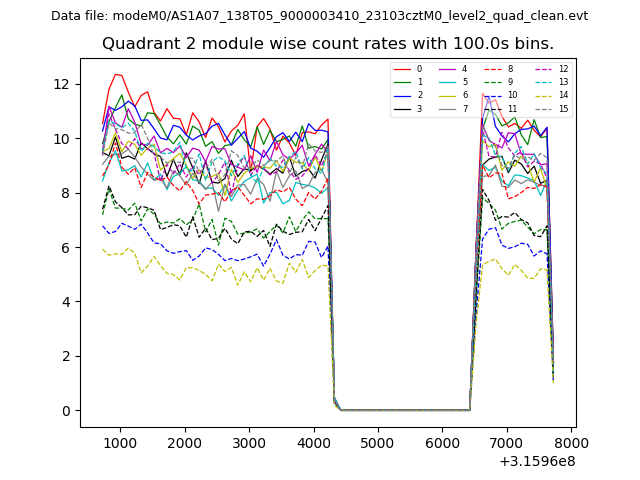
| Module-wise count rates for Quadrant B Data is divided into 100 sec bins |
 |
 |
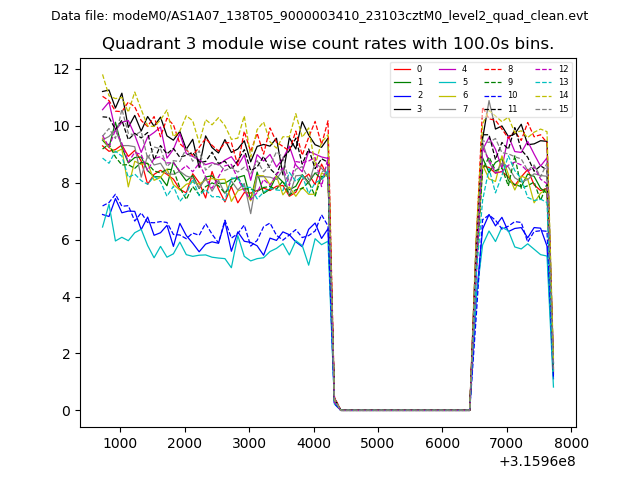
| Module-wise count rates for Quadrant C Data is divided into 100 sec bins |
 |
 |
| Module-wise count rates for Quadrant D Data is divided into 100 sec bins |
 |
 |
| Parameter | Plot |
|---|---|
| CZT HV Monitor | 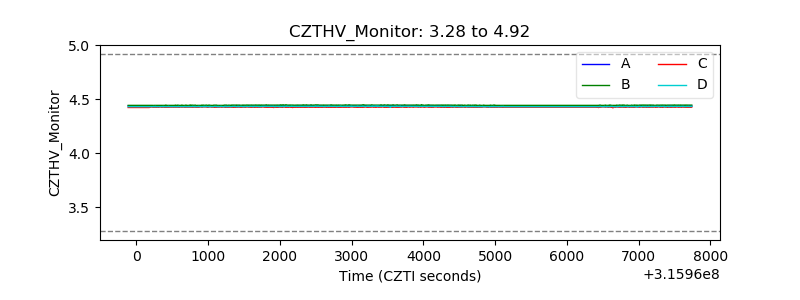 |
| D_VDD | 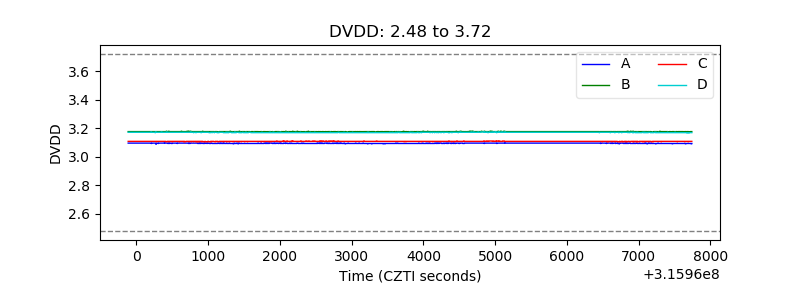 |
| Temperature 1 | 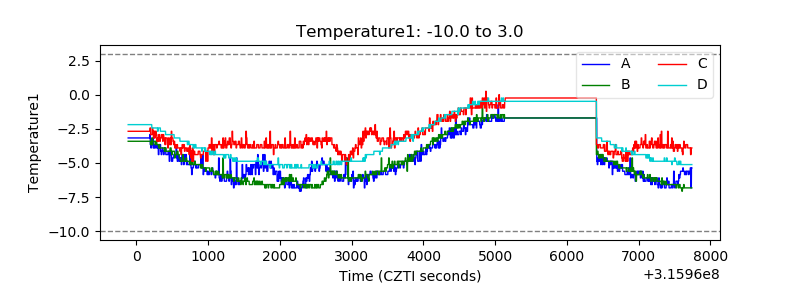 |
| Veto HV Monitor | 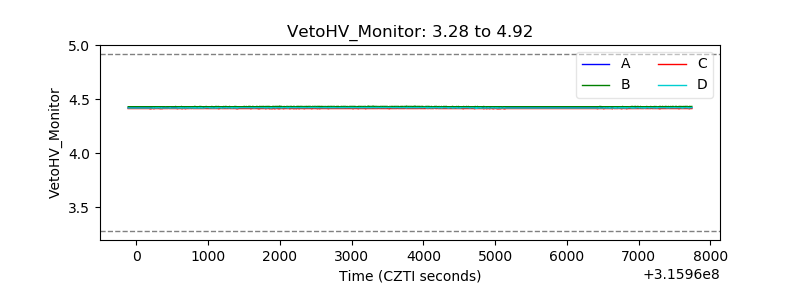 |
| Veto LLD | 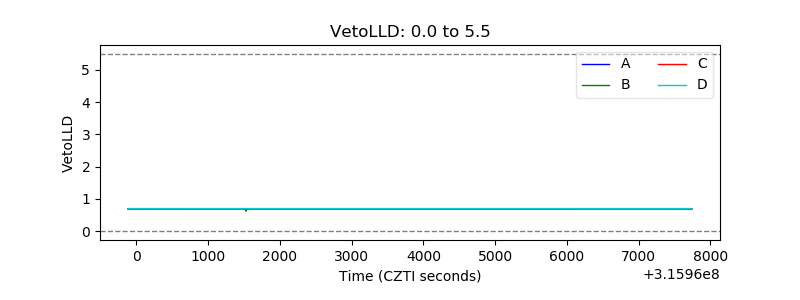 |
| Alpha Counter | 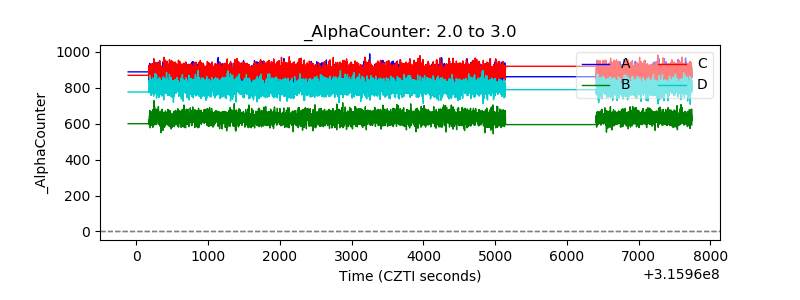 |
| _CPM_Rate | 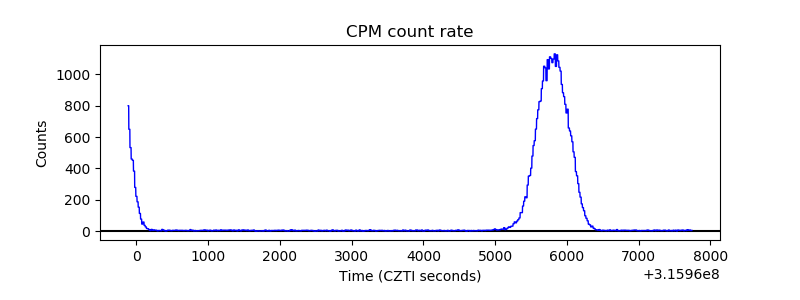 |
| CZT Counter | 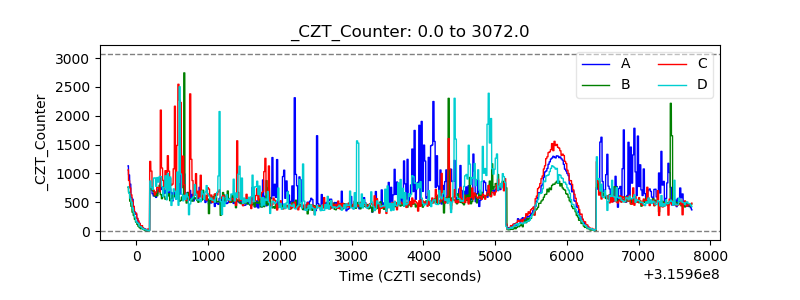 |
| +2.5 Volts monitor |  |
| +5 Volts monitor | 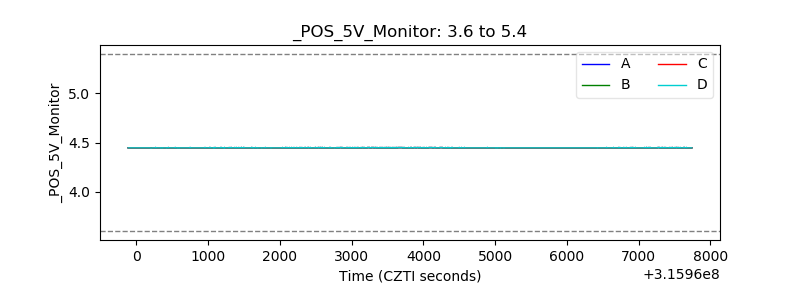 |
| _ROLL_ROT | 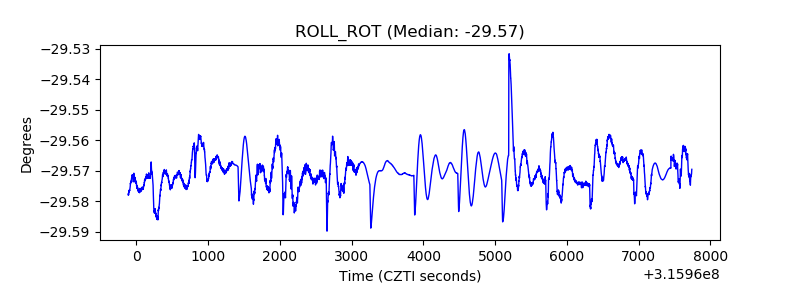 |
| _Roll_DEC | 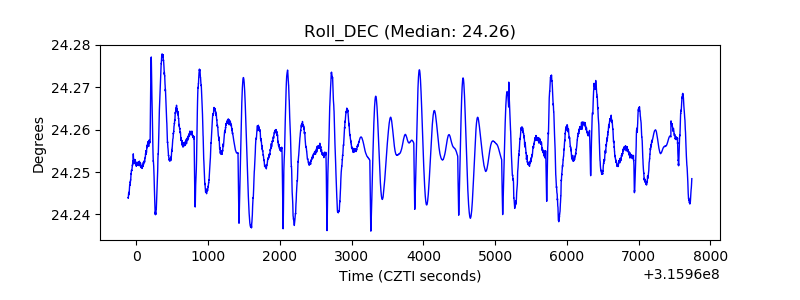 |
| _Roll_RA | 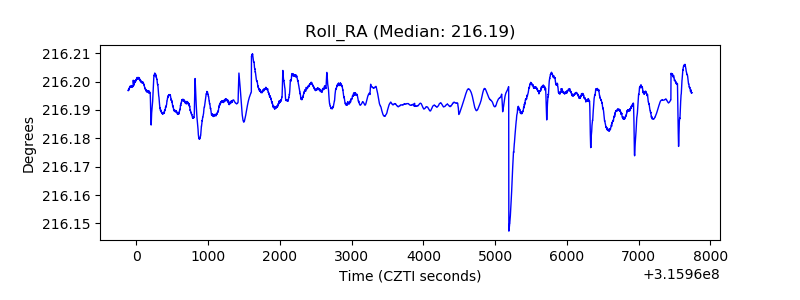 |
| Veto Counter | 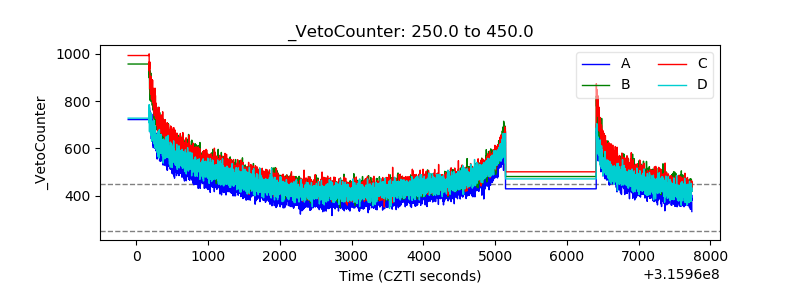 |