| Param | Original file | Final file |
|---|---|---|
| Filename | modeM0/AS1A07_138T05_9000003410_23105cztM0_level2.evt | modeM0/AS1A07_138T05_9000003410_23105cztM0_level2_quad_clean.evt |
| Size (bytes) | 572,889,600 | 103,204,800 |
| Size | 546.4 MB | 98.4 MB |
| Events in quadrant A | 3,947,006 | 654,149 |
| Events in quadrant B | 3,737,302 | 677,507 |
| Events in quadrant C | 3,834,862 | 651,910 |
| Events in quadrant D | 5,323,349 | 621,238 |
| Mode SS | |||
|---|---|---|---|
| Quadrant | BADHDUFLAG | Total packets | Discarded packets |
| A | 0 | 150 | 0 |
| B | 0 | 150 | 0 |
| C | 0 | 150 | 0 |
| D | 0 | 150 | 0 |
| Mode M9 | |||
|---|---|---|---|
| Quadrant | BADHDUFLAG | Total packets | Discarded packets |
| A | 0 | 10 | 0 |
| B | 0 | 11 | 0 |
| C | 0 | 11 | 0 |
| D | 0 | 11 | 0 |
| Mode M0 | |||
|---|---|---|---|
| Quadrant | BADHDUFLAG | Total packets | Discarded packets |
| A | 0 | 16701 | 2 |
| B | 0 | 16059 | 2 |
| C | 0 | 16410 | 2 |
| D | 0 | 21235 | 2 |
| Quadrant | Total seconds | Saturated seconds | Saturation percentage |
|---|---|---|---|
| A | 7486 | 141 | 1.883516% |
| B | 7486 | 88 | 1.175528% |
| C | 7486 | 132 | 1.763291% |
| D | 7486 | 468 | 6.251670% |
Noise dominated data is calculated using 1-second bins in cleaned event files. If a bin has >2000 counts, and if more than 50% of those come from <1% of pixels, then it is considered to be noise-dominated and hence unusable.
| Quadrant | # 1 sec bins | Bins with >0 counts | Bins with >2000 counts | High rate bins dominated by noise | Noise dominated (total time) | Noise dominated (detector-on time) | Marked lightcurve |
|---|---|---|---|---|---|---|---|
| A | 7946 | 7487 | 94 | 94 | 1.18% | 1.26% | 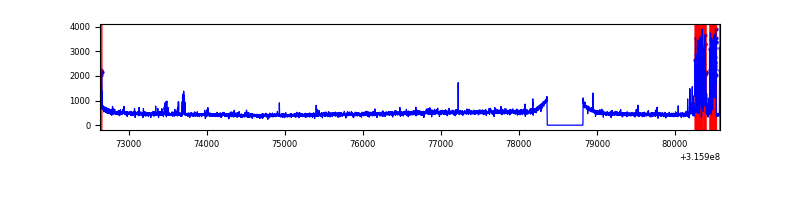 |
| B | 7946 | 7487 | 13 | 13 | 0.16% | 0.17% | 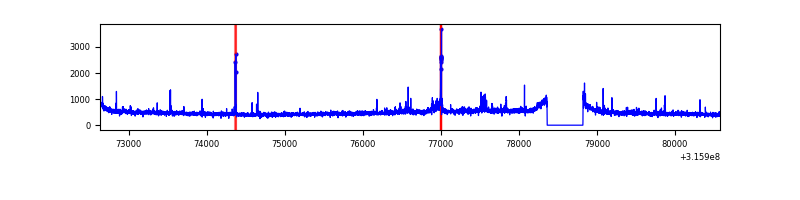 |
| C | 7946 | 7487 | 17 | 17 | 0.21% | 0.23% | 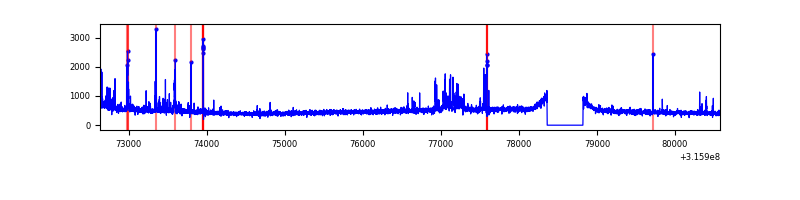 |
| D | 7946 | 7487 | 310 | 310 | 3.90% | 4.14% | 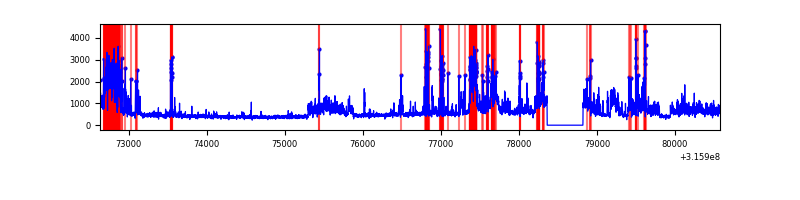 |
Top three noisy pixels from each quadrant. If the there are fewer than three noisy pixels in the level2.evt file, extra rows are filled as -1
| Pixel properties | Quadrant properties | ||||||
|---|---|---|---|---|---|---|---|
| Quadrant | DetID | PixID | Counts | Sigma | Mean | Median | Sigma |
| A | 6 | 16 | 467092 | 2538.09 | 903 | 882 | 183.7 |
| A | 13 | 254 | 11188 | 56.11 | 903 | 882 | 183.7 |
| A | 3 | 137 | 8034 | 38.94 | 903 | 882 | 183.7 |
| B | 0 | 190 | 65192 | 364.62 | 910 | 887 | 176.4 |
| B | 5 | 172 | 27947 | 153.43 | 910 | 887 | 176.4 |
| B | 0 | 189 | 25588 | 140.06 | 910 | 887 | 176.4 |
| C | 0 | 207 | 280660 | 1354.57 | 875 | 880 | 206.5 |
| C | 14 | 238 | 136172 | 655.02 | 875 | 880 | 206.5 |
| C | 13 | 61 | 5963 | 24.61 | 875 | 880 | 206.5 |
| D | 13 | 153 | 1248801 | 5919.18 | 858 | 835 | 210.8 |
| D | 7 | 238 | 630204 | 2985.14 | 858 | 835 | 210.8 |
| D | 1 | 52 | 127586 | 601.19 | 858 | 835 | 210.8 |
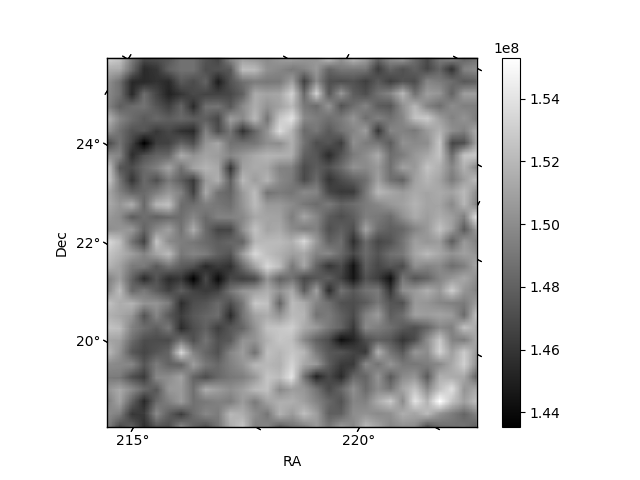
Histogram calculated using DETX and DETY for each event in the final _common_clean file
| Quadrant A |  |
 |
Quadrant B |
|---|---|---|---|
| Quadrant D |  |
 |
Quadrant C |
| Plot type | Count rate plots | Images |
|---|---|---|
| Comparison with Poisson distribution Blue bars denote a histogram of data divided into 1 sec bins. Red curve is a Poisson curve with rate = median count rate of data. |
 |
 |
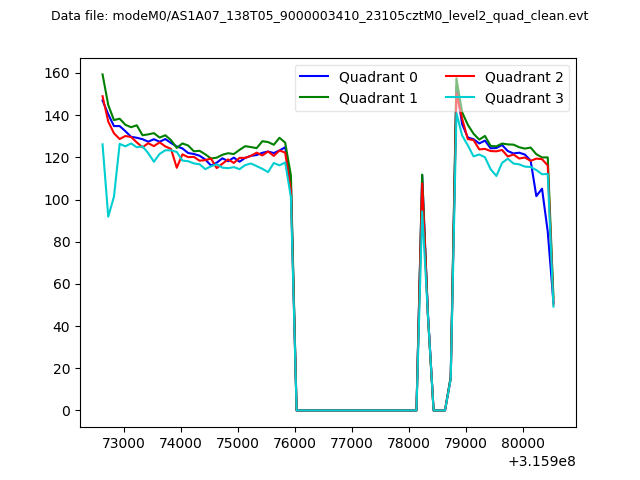
| Quadrant-wise count rates Data is divided into 100 sec bins |
 |
|
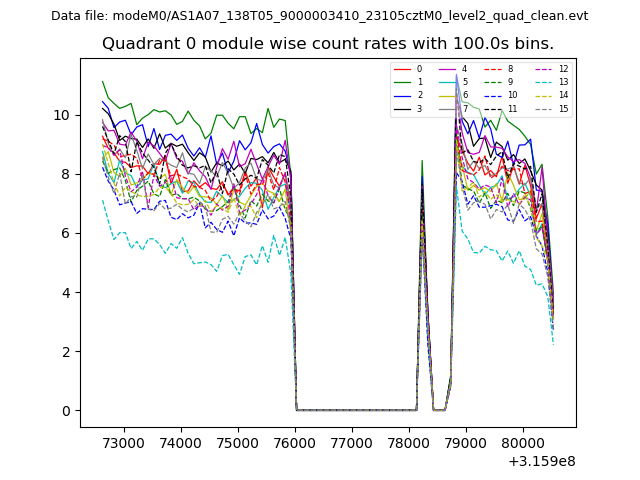
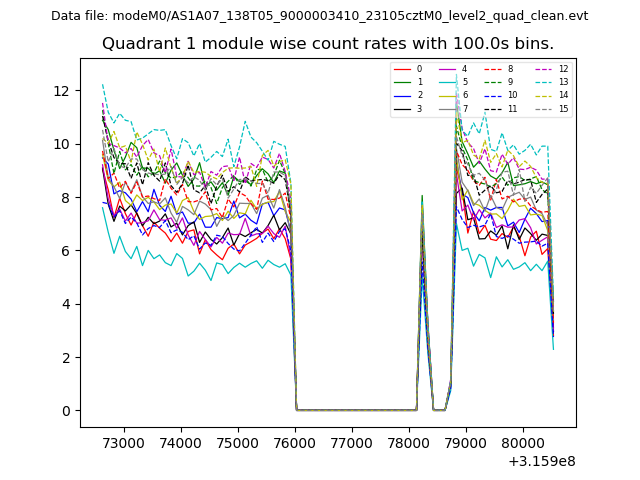
| Module-wise count rates for Quadrant A Data is divided into 100 sec bins |
 |
 |
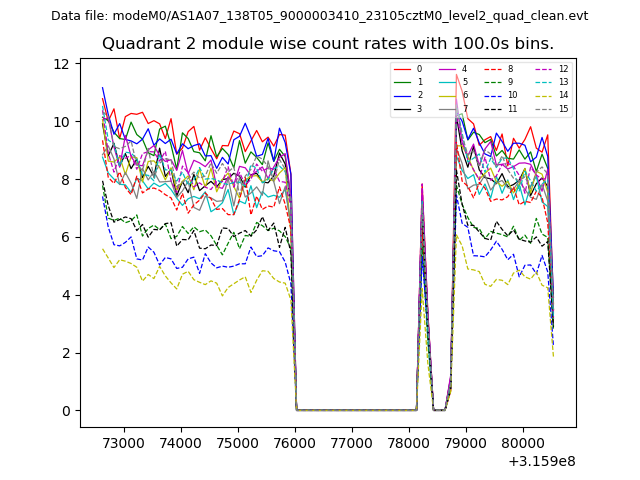
| Module-wise count rates for Quadrant B Data is divided into 100 sec bins |
 |
 |
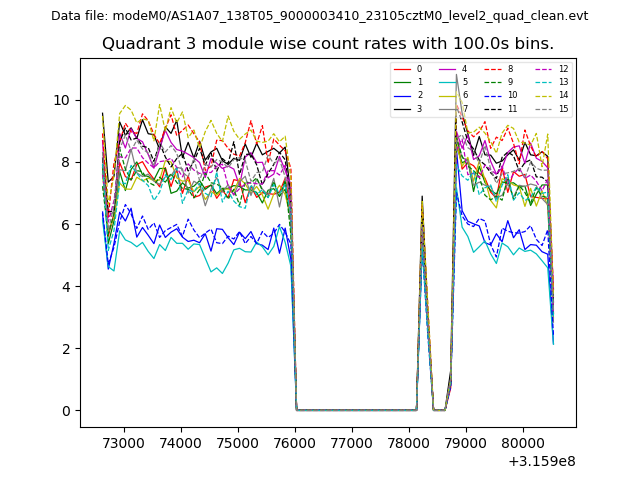
| Module-wise count rates for Quadrant C Data is divided into 100 sec bins |
 |
 |
| Module-wise count rates for Quadrant D Data is divided into 100 sec bins |
 |
 |
| Parameter | Plot |
|---|---|
| CZT HV Monitor | 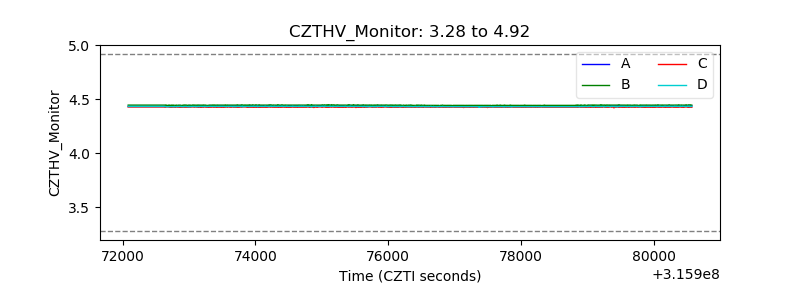 |
| D_VDD | 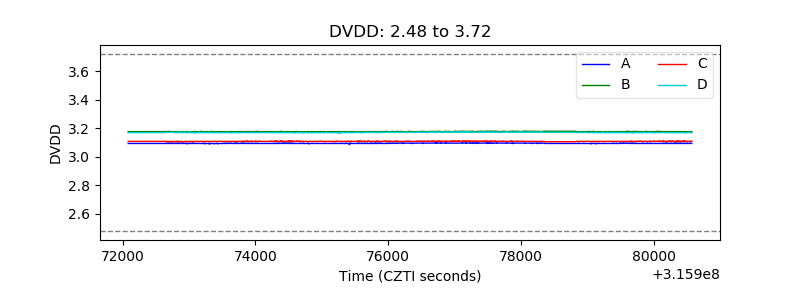 |
| Temperature 1 | 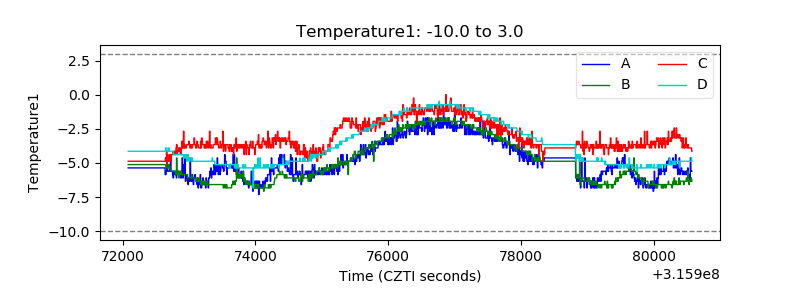 |
| Veto HV Monitor |  |
| Veto LLD | 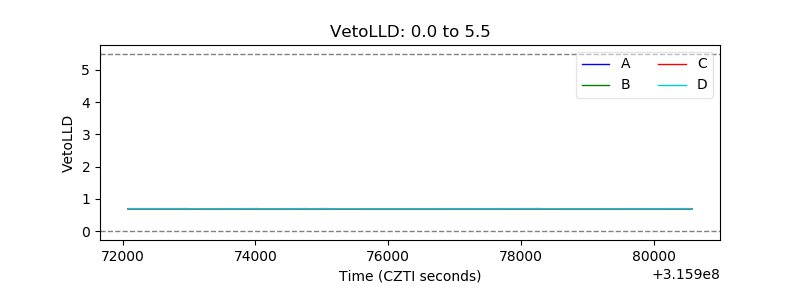 |
| Alpha Counter | 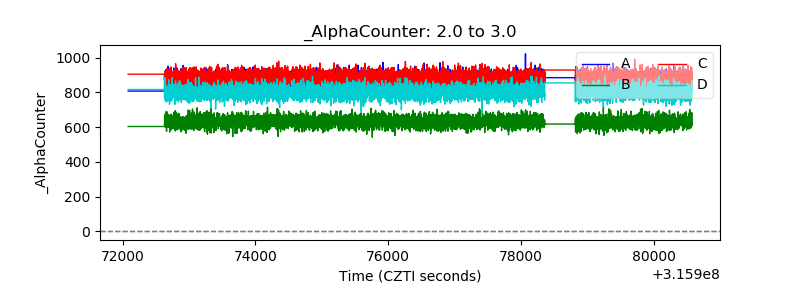 |
| _CPM_Rate | 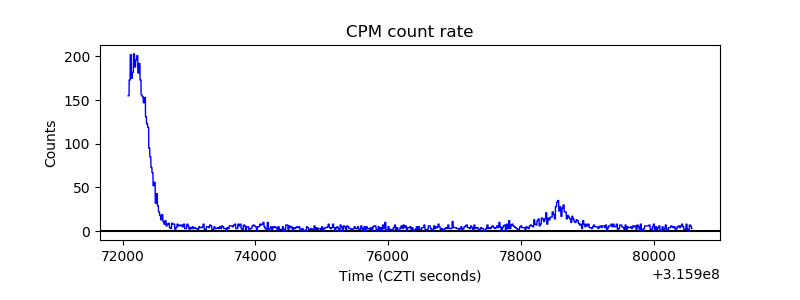 |
| CZT Counter |  |
| +2.5 Volts monitor |  |
| +5 Volts monitor | 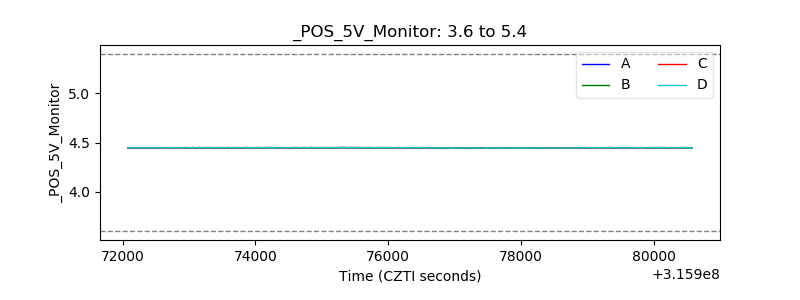 |
| _ROLL_ROT | 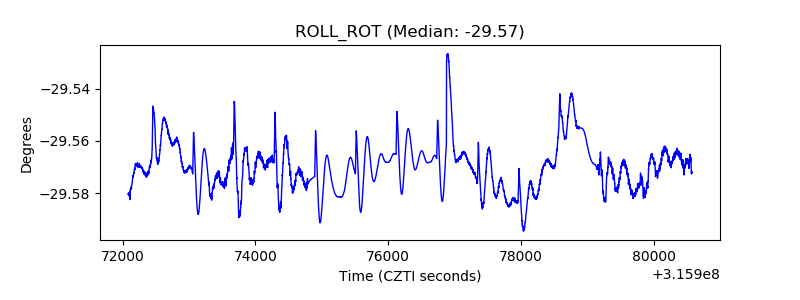 |
| _Roll_DEC |  |
| _Roll_RA |  |
| Veto Counter | 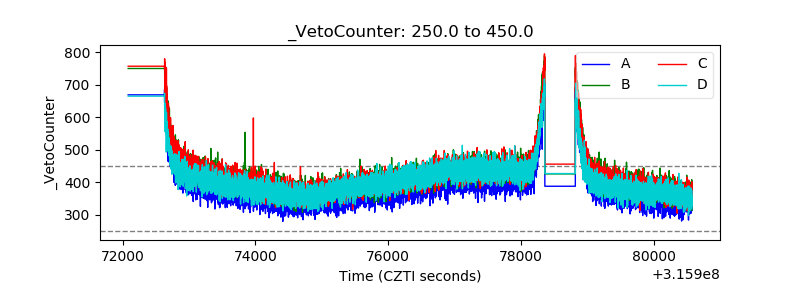 |