| Param | Original file | Final file |
|---|---|---|
| Filename | modeM0/AS1A07_138T05_9000003410_23106cztM0_level2.evt | modeM0/AS1A07_138T05_9000003410_23106cztM0_level2_quad_clean.evt |
| Size (bytes) | 663,589,440 | 109,454,400 |
| Size | 632.8 MB | 104.4 MB |
| Events in quadrant A | 5,909,704 | 667,012 |
| Events in quadrant B | 3,939,427 | 724,778 |
| Events in quadrant C | 3,861,280 | 698,607 |
| Events in quadrant D | 5,850,918 | 674,099 |
| Mode SS | |||
|---|---|---|---|
| Quadrant | BADHDUFLAG | Total packets | Discarded packets |
| A | 0 | 158 | 0 |
| B | 0 | 158 | 0 |
| C | 0 | 158 | 0 |
| D | 0 | 158 | 0 |
| Mode M9 | |||
|---|---|---|---|
| Quadrant | BADHDUFLAG | Total packets | Discarded packets |
| A | 0 | 1 | 0 |
| B | 0 | 1 | 0 |
| C | 0 | 1 | 0 |
| D | 0 | 1 | 0 |
| Mode M0 | |||
|---|---|---|---|
| Quadrant | BADHDUFLAG | Total packets | Discarded packets |
| A | 0 | 22848 | 1 |
| B | 0 | 17043 | 1 |
| C | 0 | 16738 | 1 |
| D | 0 | 23139 | 1 |
| Quadrant | Total seconds | Saturated seconds | Saturation percentage |
|---|---|---|---|
| A | 7917 | 825 | 10.420614% |
| B | 7916 | 200 | 2.526529% |
| C | 7916 | 203 | 2.564426% |
| D | 7916 | 263 | 3.322385% |
Noise dominated data is calculated using 1-second bins in cleaned event files. If a bin has >2000 counts, and if more than 50% of those come from <1% of pixels, then it is considered to be noise-dominated and hence unusable.
| Quadrant | # 1 sec bins | Bins with >0 counts | Bins with >2000 counts | High rate bins dominated by noise | Noise dominated (total time) | Noise dominated (detector-on time) | Marked lightcurve |
|---|---|---|---|---|---|---|---|
| A | 7937 | 7918 | 536 | 536 | 6.75% | 6.77% | 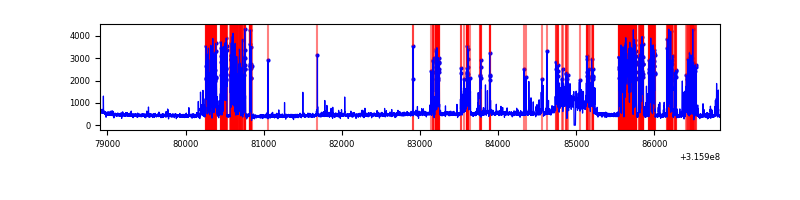 |
| B | 7936 | 7917 | 2 | 2 | 0.03% | 0.03% |  |
| C | 7936 | 7917 | 10 | 10 | 0.13% | 0.13% |  |
| D | 7936 | 7917 | 91 | 91 | 1.15% | 1.15% | 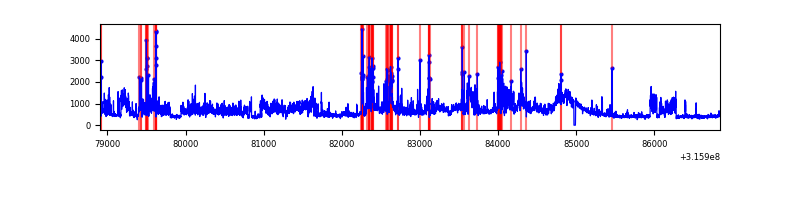 |
Top three noisy pixels from each quadrant. If the there are fewer than three noisy pixels in the level2.evt file, extra rows are filled as -1
| Pixel properties | Quadrant properties | ||||||
|---|---|---|---|---|---|---|---|
| Quadrant | DetID | PixID | Counts | Sigma | Mean | Median | Sigma |
| A | 6 | 16 | 2300780 | 12103.9 | 936 | 915 | 190.0 |
| A | 13 | 254 | 11643 | 56.46 | 936 | 915 | 190.0 |
| A | 3 | 137 | 8393 | 39.36 | 936 | 915 | 190.0 |
| B | 0 | 190 | 65949 | 344.26 | 967 | 941 | 188.8 |
| B | 12 | 111 | 23522 | 119.58 | 967 | 941 | 188.8 |
| B | 4 | 216 | 21306 | 107.85 | 967 | 941 | 188.8 |
| C | 14 | 238 | 145257 | 651.71 | 931 | 936 | 221.5 |
| C | 0 | 207 | 34409 | 151.15 | 931 | 936 | 221.5 |
| C | 2 | 16 | 33461 | 146.87 | 931 | 936 | 221.5 |
| D | 7 | 238 | 1093968 | 4782.69 | 934 | 906 | 228.5 |
| D | 13 | 153 | 498156 | 2175.71 | 934 | 906 | 228.5 |
| D | 12 | 227 | 441938 | 1929.73 | 934 | 906 | 228.5 |
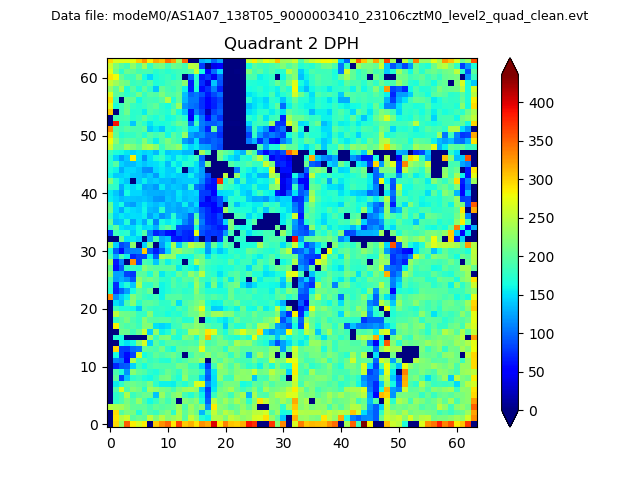
Histogram calculated using DETX and DETY for each event in the final _common_clean file
| Quadrant A | 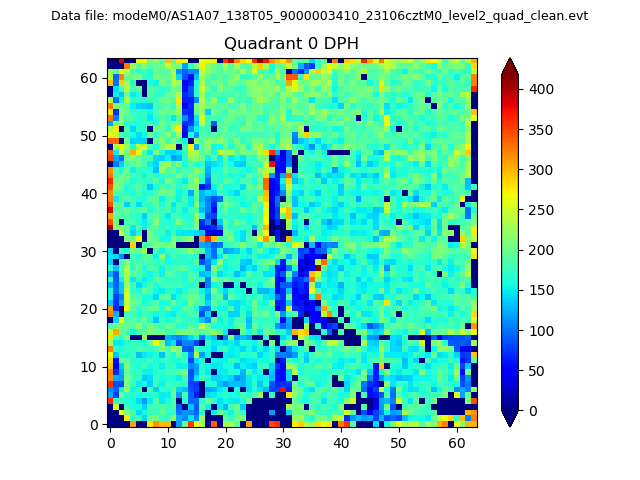 |
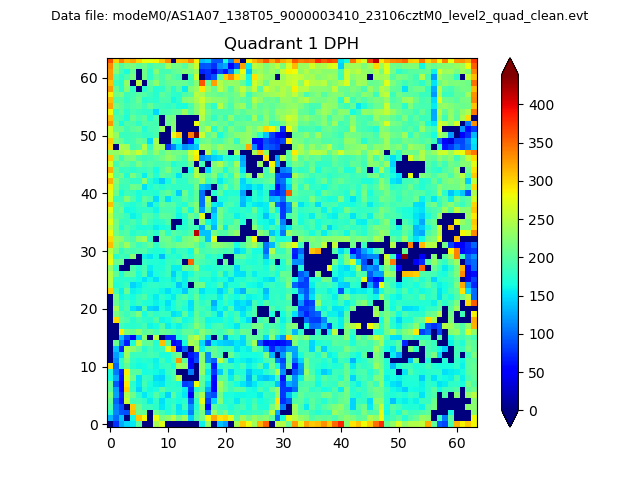 |
Quadrant B |
|---|---|---|---|
| Quadrant D | 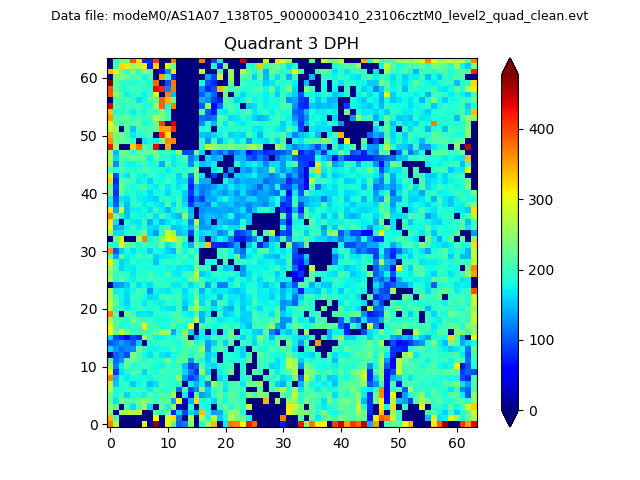 |
 |
Quadrant C |
| Plot type | Count rate plots | Images |
|---|---|---|
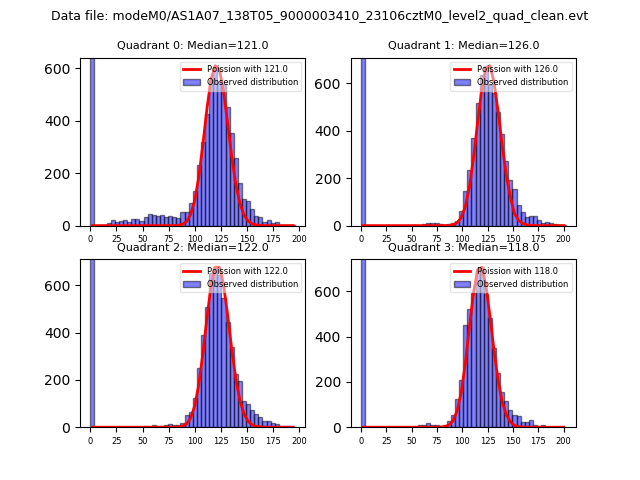
| Comparison with Poisson distribution Blue bars denote a histogram of data divided into 1 sec bins. Red curve is a Poisson curve with rate = median count rate of data. |
 |
 |
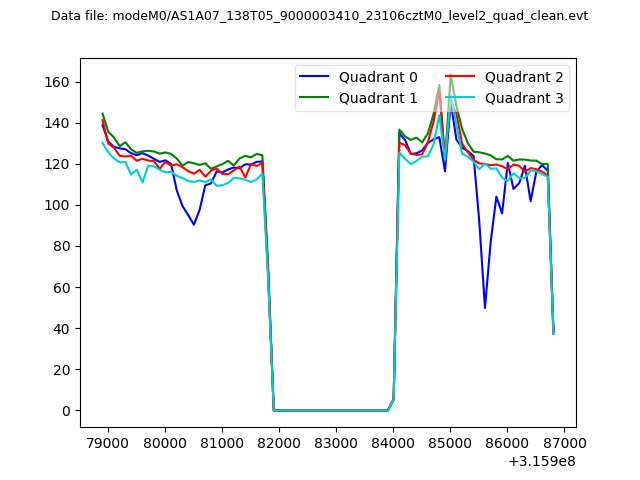
| Quadrant-wise count rates Data is divided into 100 sec bins |
 |
|
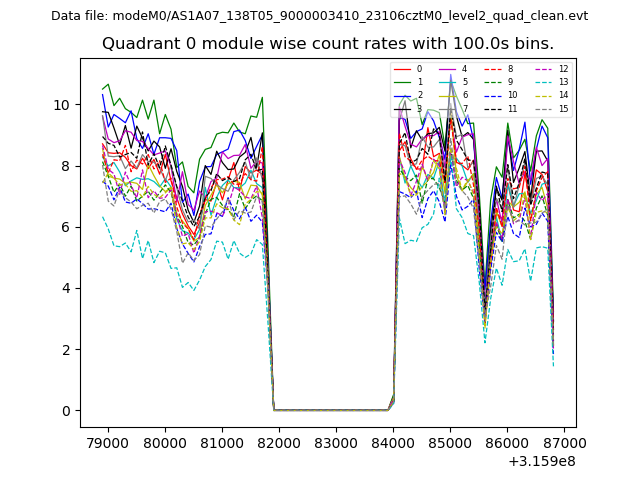
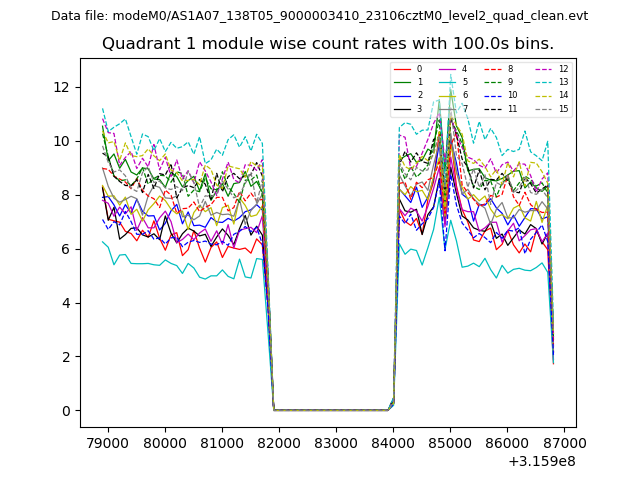
| Module-wise count rates for Quadrant A Data is divided into 100 sec bins |
 |
 |
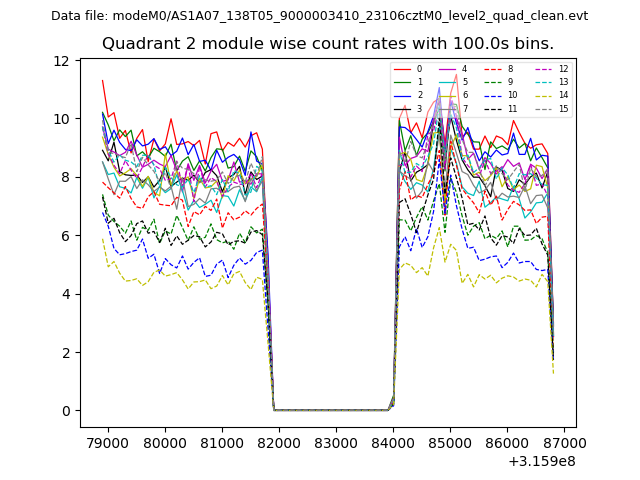
| Module-wise count rates for Quadrant B Data is divided into 100 sec bins |
 |
 |
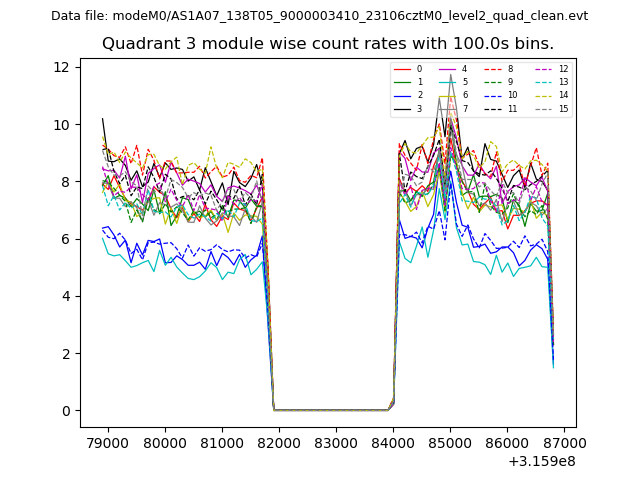
| Module-wise count rates for Quadrant C Data is divided into 100 sec bins |
 |
 |
| Module-wise count rates for Quadrant D Data is divided into 100 sec bins |
 |
 |
| Parameter | Plot |
|---|---|
| CZT HV Monitor | 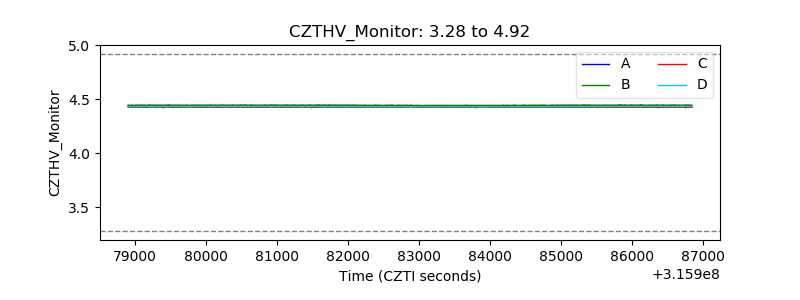 |
| D_VDD | 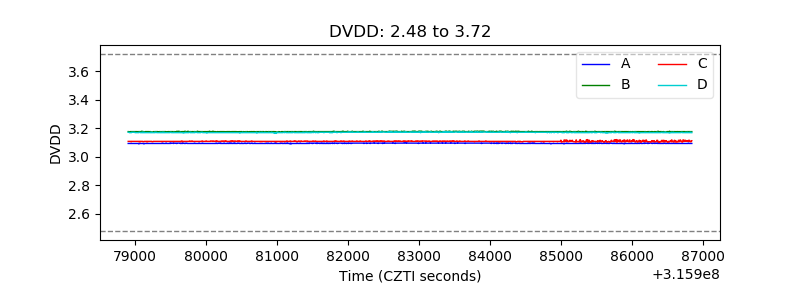 |
| Temperature 1 | 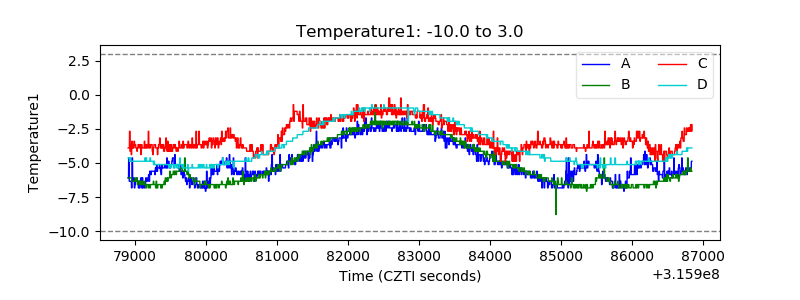 |
| Veto HV Monitor | 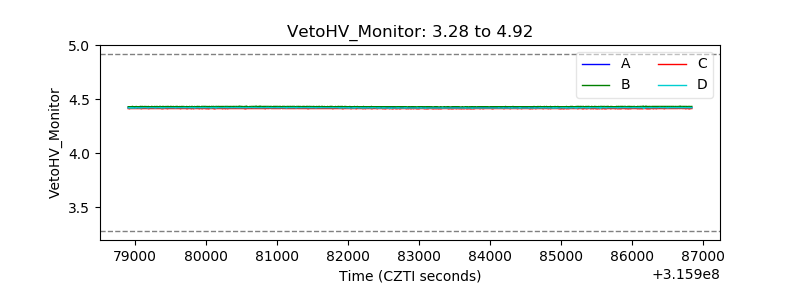 |
| Veto LLD | 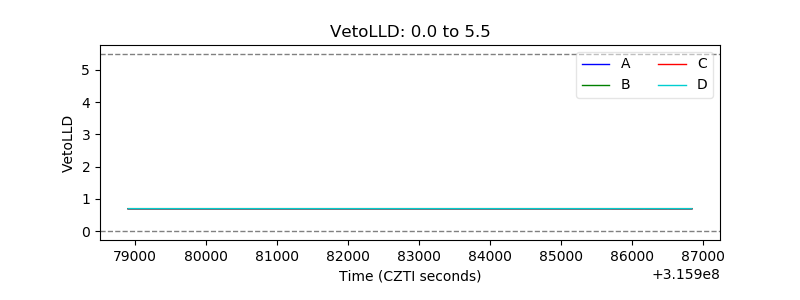 |
| Alpha Counter | 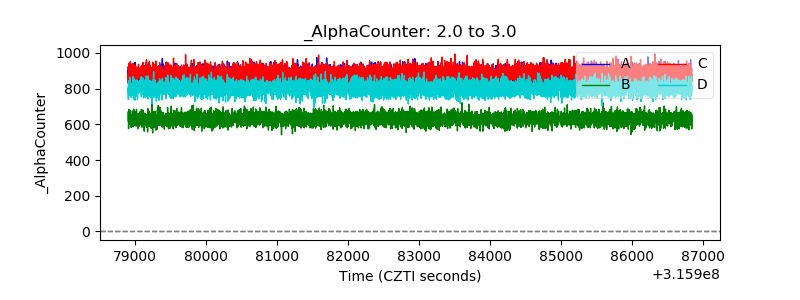 |
| _CPM_Rate |  |
| CZT Counter |  |
| +2.5 Volts monitor |  |
| +5 Volts monitor |  |
| _ROLL_ROT | 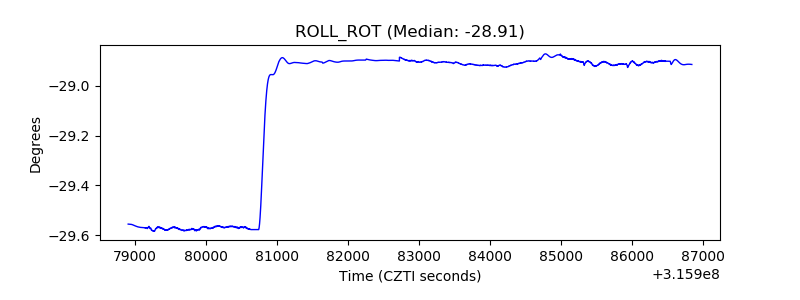 |
| _Roll_DEC | 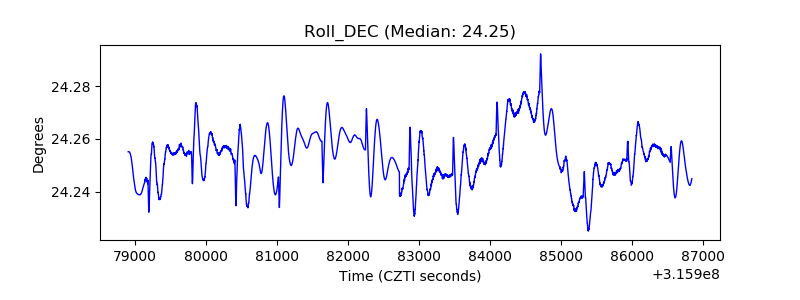 |
| _Roll_RA |  |
| Veto Counter | 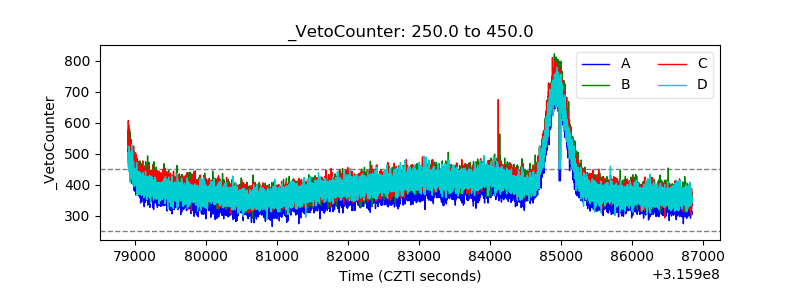 |