| Param | Original file | Final file |
|---|---|---|
| Filename | modeM0/AS1A07_138T05_9000003410_23107cztM0_level2.evt | modeM0/AS1A07_138T05_9000003410_23107cztM0_level2_quad_clean.evt |
| Size (bytes) | 574,911,360 | 98,470,080 |
| Size | 548.3 MB | 93.9 MB |
| Events in quadrant A | 5,892,215 | 599,628 |
| Events in quadrant B | 3,563,901 | 644,220 |
| Events in quadrant C | 3,453,736 | 618,360 |
| Events in quadrant D | 4,001,874 | 607,438 |
| Mode SS | |||
|---|---|---|---|
| Quadrant | BADHDUFLAG | Total packets | Discarded packets |
| A | 0 | 150 | 0 |
| B | 0 | 150 | 0 |
| C | 0 | 150 | 0 |
| D | 0 | 150 | 0 |
| Mode M9 | |||
|---|---|---|---|
| Quadrant | BADHDUFLAG | Total packets | Discarded packets |
| A | 0 | 2 | 0 |
| B | 0 | 2 | 0 |
| C | 0 | 2 | 0 |
| D | 0 | 2 | 0 |
| Mode M0 | |||
|---|---|---|---|
| Quadrant | BADHDUFLAG | Total packets | Discarded packets |
| A | 0 | 22332 | 1 |
| B | 0 | 15434 | 1 |
| C | 0 | 15142 | 1 |
| D | 0 | 16986 | 1 |
| Quadrant | Total seconds | Saturated seconds | Saturation percentage |
|---|---|---|---|
| A | 7357 | 889 | 12.083730% |
| B | 7358 | 109 | 1.481381% |
| C | 7358 | 115 | 1.562925% |
| D | 7358 | 75 | 1.019299% |
Noise dominated data is calculated using 1-second bins in cleaned event files. If a bin has >2000 counts, and if more than 50% of those come from <1% of pixels, then it is considered to be noise-dominated and hence unusable.
| Quadrant | # 1 sec bins | Bins with >0 counts | Bins with >2000 counts | High rate bins dominated by noise | Noise dominated (total time) | Noise dominated (detector-on time) | Marked lightcurve |
|---|---|---|---|---|---|---|---|
| A | 7592 | 7358 | 690 | 690 | 9.09% | 9.38% | 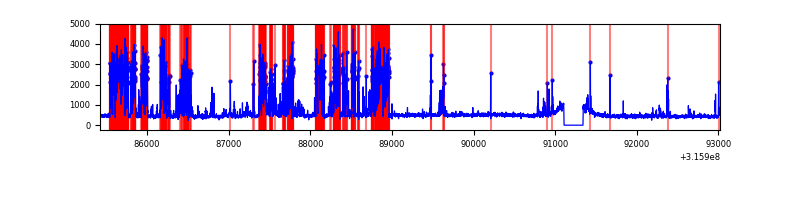 |
| B | 7593 | 7359 | 21 | 21 | 0.28% | 0.29% | 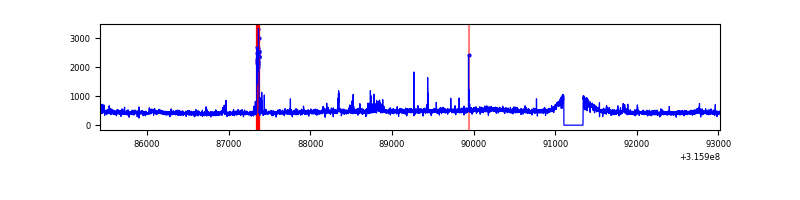 |
| C | 7593 | 7359 | 2 | 2 | 0.03% | 0.03% | 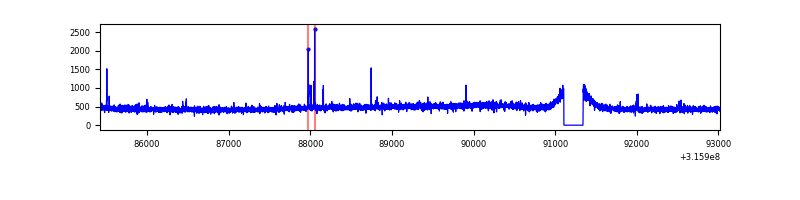 |
| D | 7593 | 7359 | 15 | 15 | 0.20% | 0.20% | 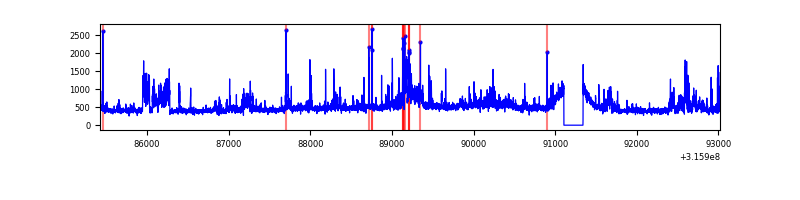 |
Top three noisy pixels from each quadrant. If the there are fewer than three noisy pixels in the level2.evt file, extra rows are filled as -1
| Pixel properties | Quadrant properties | ||||||
|---|---|---|---|---|---|---|---|
| Quadrant | DetID | PixID | Counts | Sigma | Mean | Median | Sigma |
| A | 6 | 16 | 2684684 | 15856.28 | 832 | 814 | 169.3 |
| A | 13 | 254 | 10064 | 54.65 | 832 | 814 | 169.3 |
| A | 3 | 137 | 7336 | 38.53 | 832 | 814 | 169.3 |
| B | 0 | 189 | 86380 | 503.06 | 868 | 847 | 170.0 |
| B | 0 | 190 | 43456 | 250.61 | 868 | 847 | 170.0 |
| B | 12 | 111 | 21110 | 119.18 | 868 | 847 | 170.0 |
| C | 14 | 238 | 132151 | 664.87 | 837 | 842 | 197.5 |
| C | 2 | 16 | 17508 | 84.39 | 837 | 842 | 197.5 |
| C | 0 | 207 | 14415 | 68.73 | 837 | 842 | 197.5 |
| D | 7 | 238 | 335910 | 1603.46 | 849 | 825 | 209.0 |
| D | 1 | 52 | 189724 | 903.93 | 849 | 825 | 209.0 |
| D | 13 | 153 | 93755 | 444.69 | 849 | 825 | 209.0 |
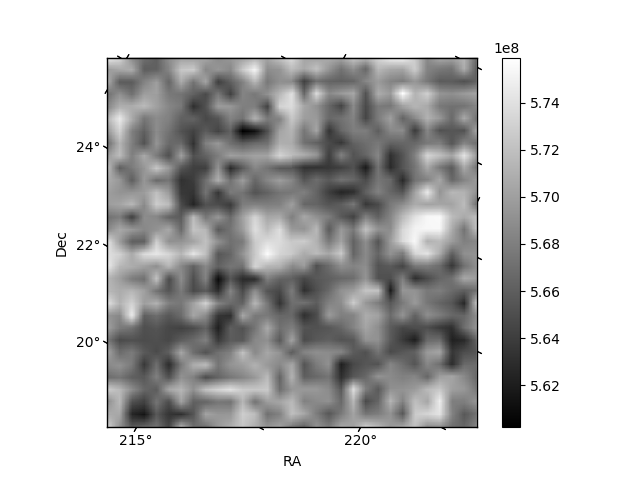
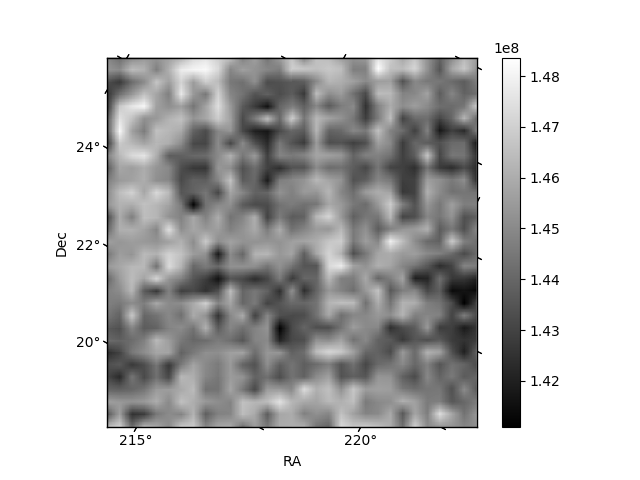
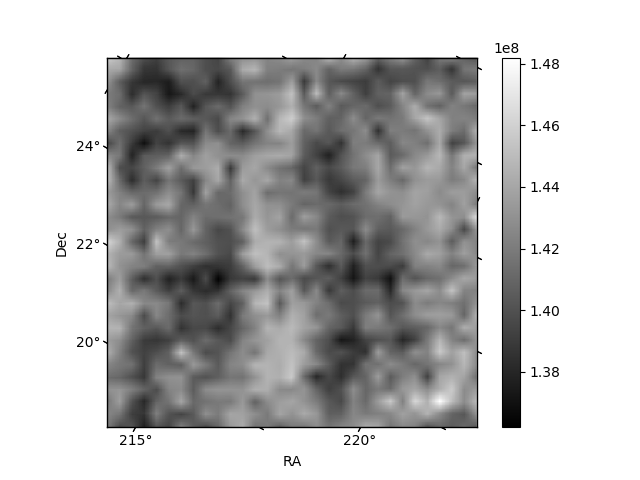
Histogram calculated using DETX and DETY for each event in the final _common_clean file
| Quadrant A | 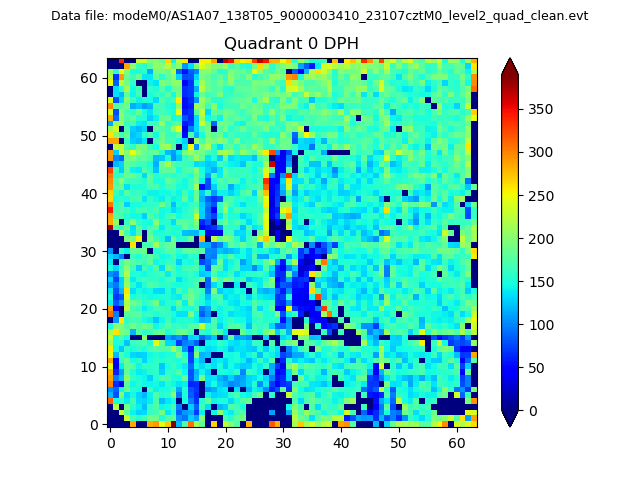 |
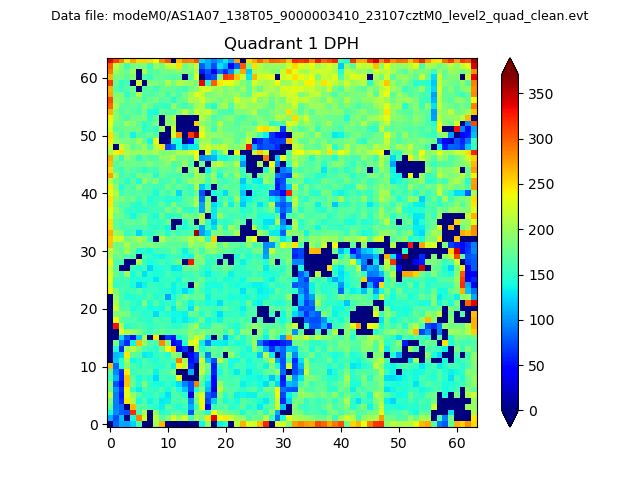 |
Quadrant B |
|---|---|---|---|
| Quadrant D | 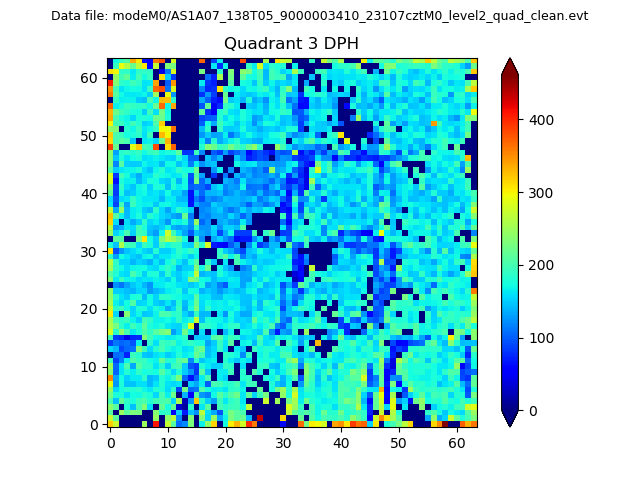 |
 |
Quadrant C |
| Plot type | Count rate plots | Images |
|---|---|---|
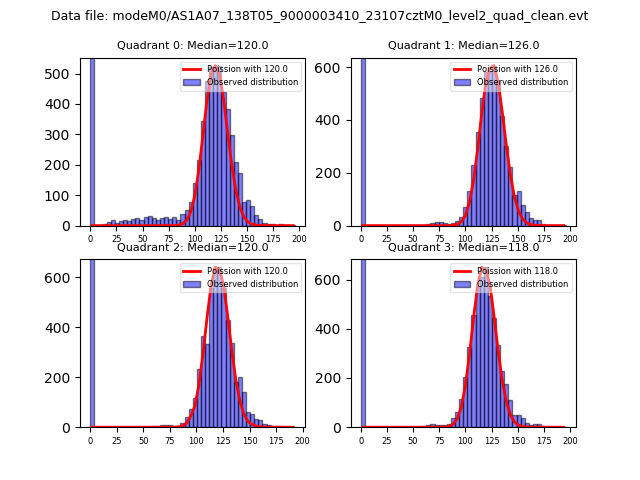
| Comparison with Poisson distribution Blue bars denote a histogram of data divided into 1 sec bins. Red curve is a Poisson curve with rate = median count rate of data. |
 |
 |
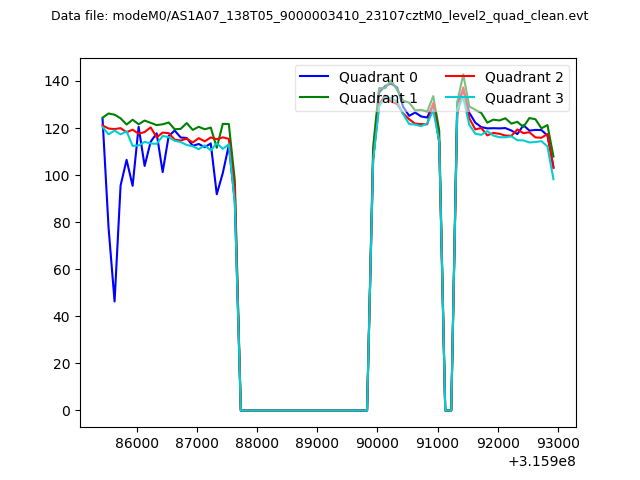
| Quadrant-wise count rates Data is divided into 100 sec bins |
 |
|
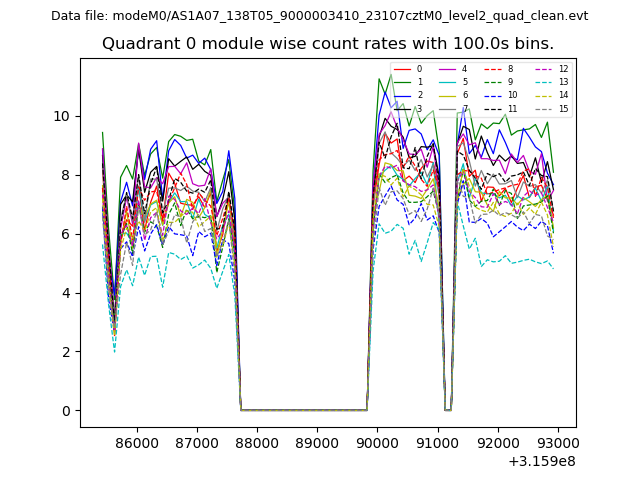
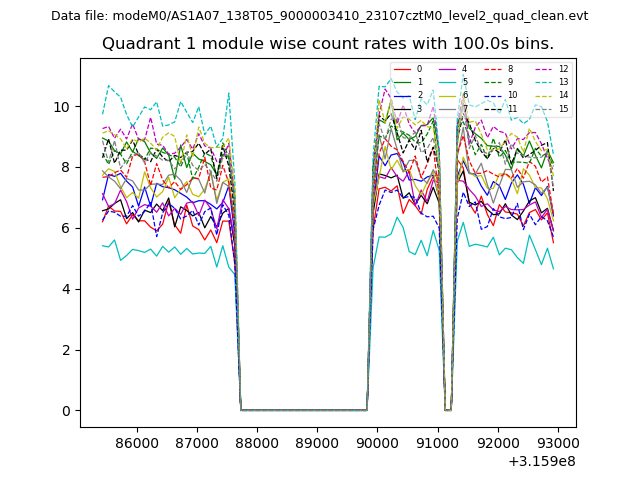
| Module-wise count rates for Quadrant A Data is divided into 100 sec bins |
 |
 |
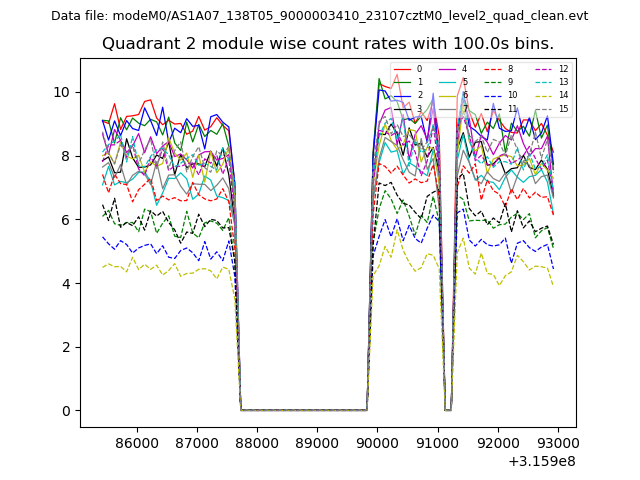
| Module-wise count rates for Quadrant B Data is divided into 100 sec bins |
 |
 |
| Module-wise count rates for Quadrant C Data is divided into 100 sec bins |
 |
 |
| Module-wise count rates for Quadrant D Data is divided into 100 sec bins |
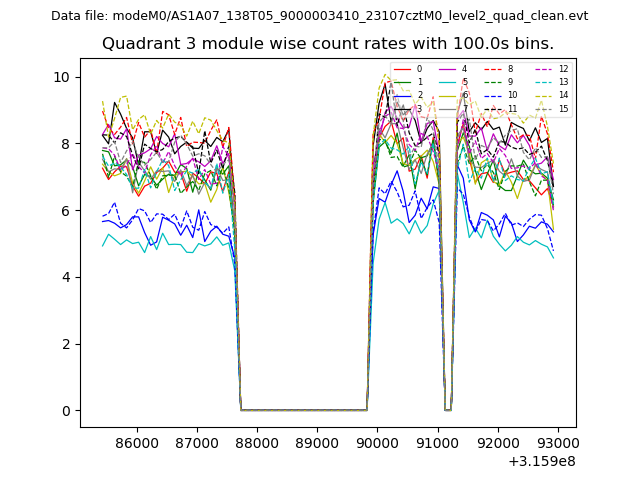 |
 |
| Parameter | Plot |
|---|---|
| CZT HV Monitor | 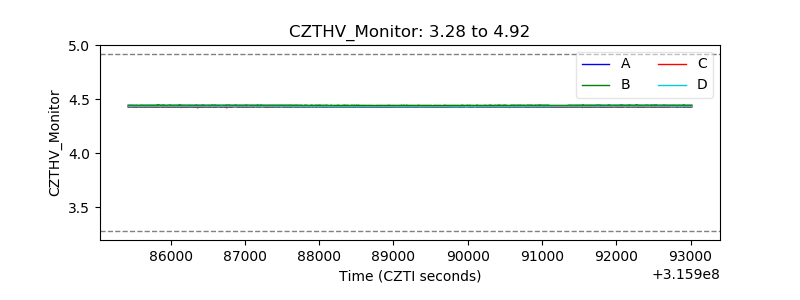 |
| D_VDD | 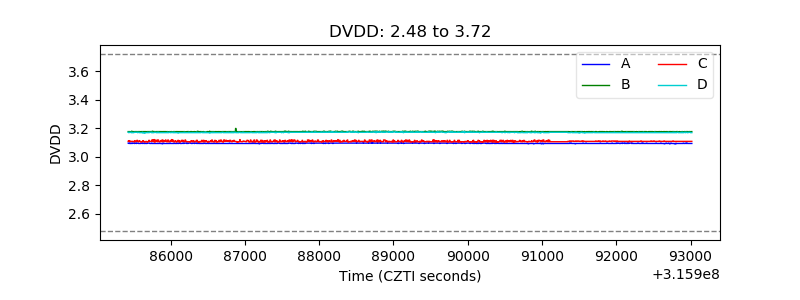 |
| Temperature 1 | 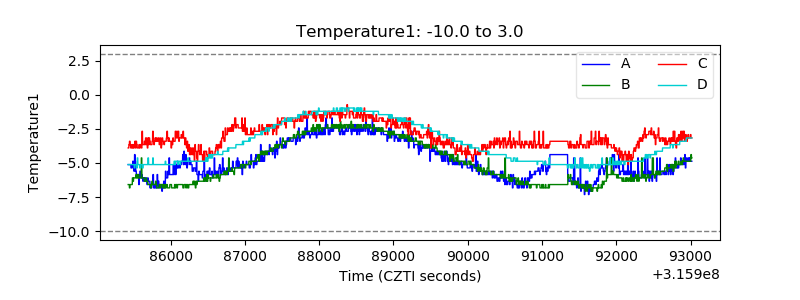 |
| Veto HV Monitor | 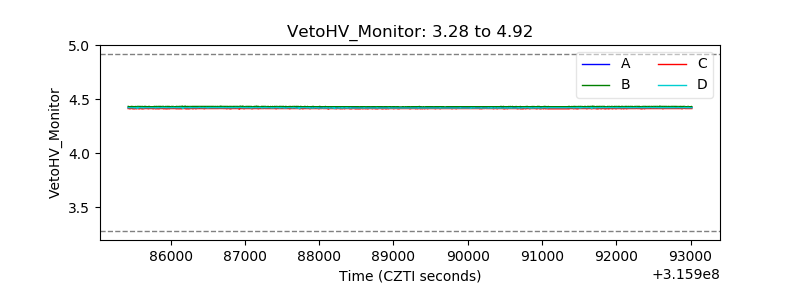 |
| Veto LLD | 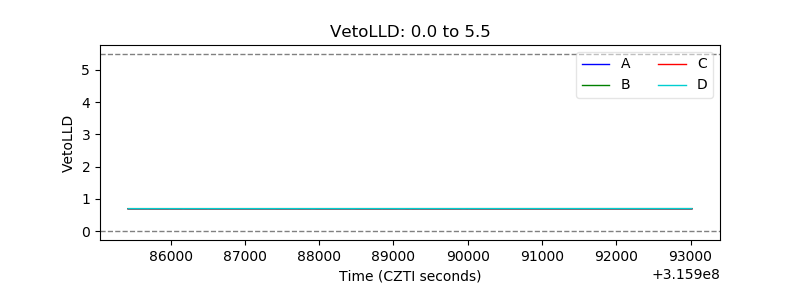 |
| Alpha Counter | 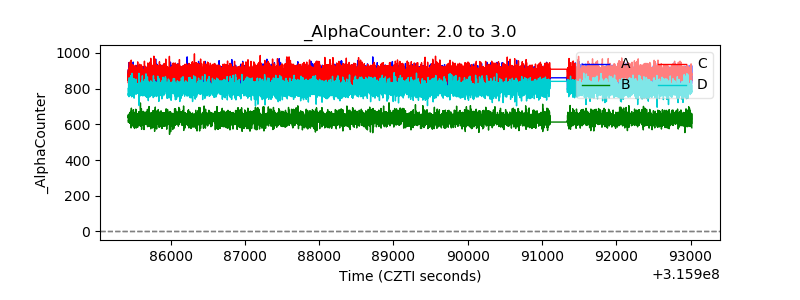 |
| _CPM_Rate | 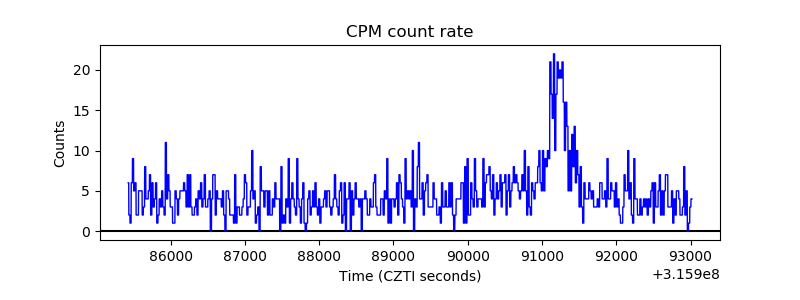 |
| CZT Counter | 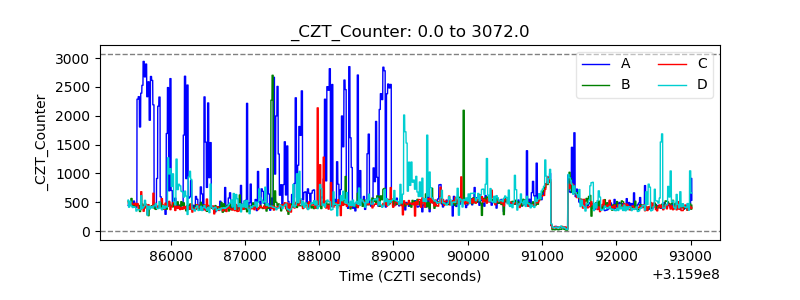 |
| +2.5 Volts monitor |  |
| +5 Volts monitor |  |
| _ROLL_ROT | 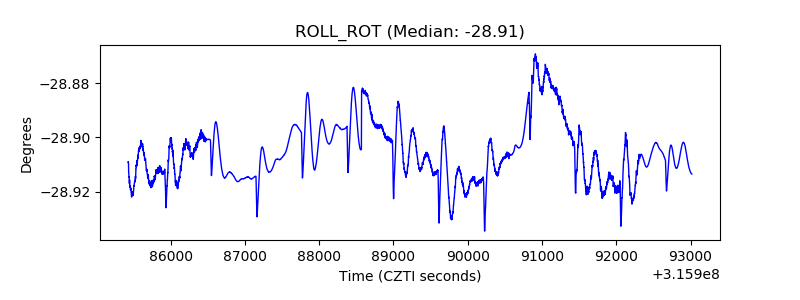 |
| _Roll_DEC | 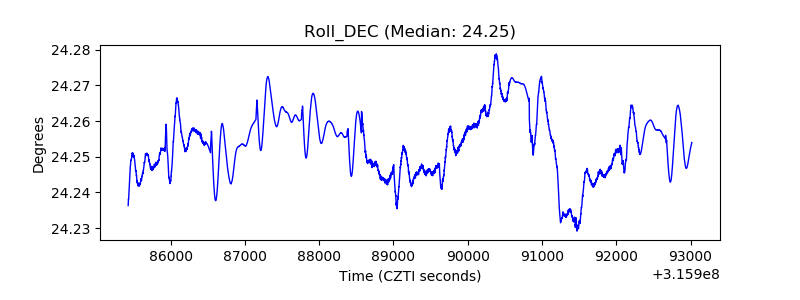 |
| _Roll_RA | 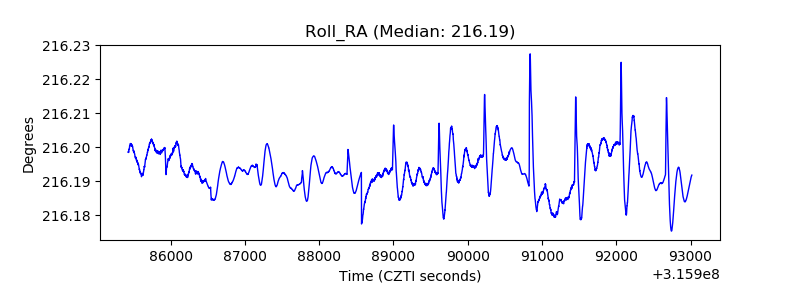 |
| Veto Counter | 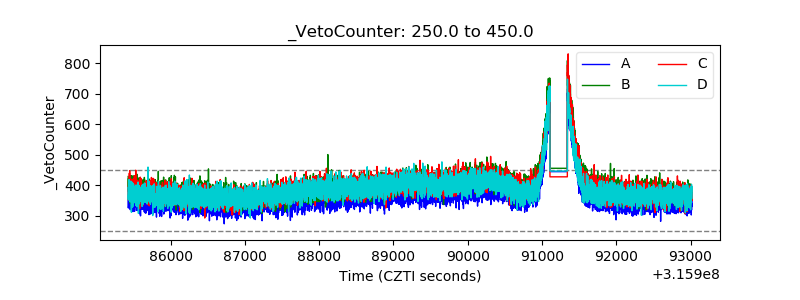 |